. 2022 May 16;13(1):2687.
doi: 10.1038/s41467-022-30357-w.

An Artificial Intelligence-guided signature reveals the shared host immune response in MIS-C and Kawasaki disease

Collaborators, Affiliations

An Artificial Intelligence-guided signature reveals the shared host immune response in MIS-C and Kawasaki disease

Pradipta Ghosh et al. Nat Commun. .

Erratum in

Abstract

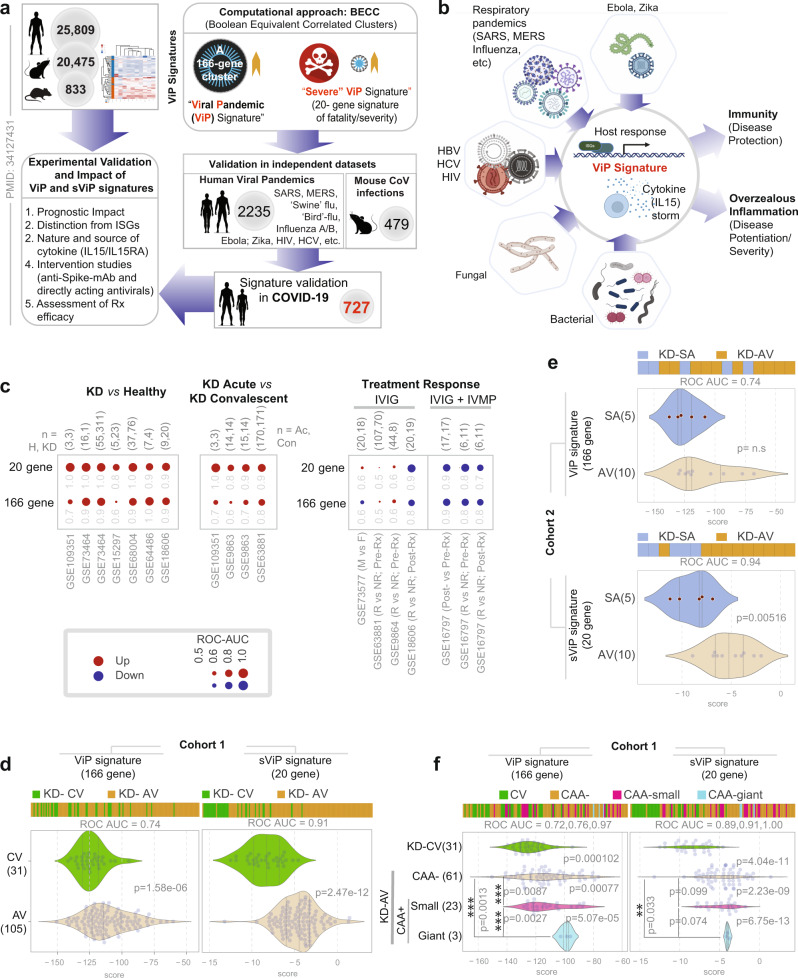
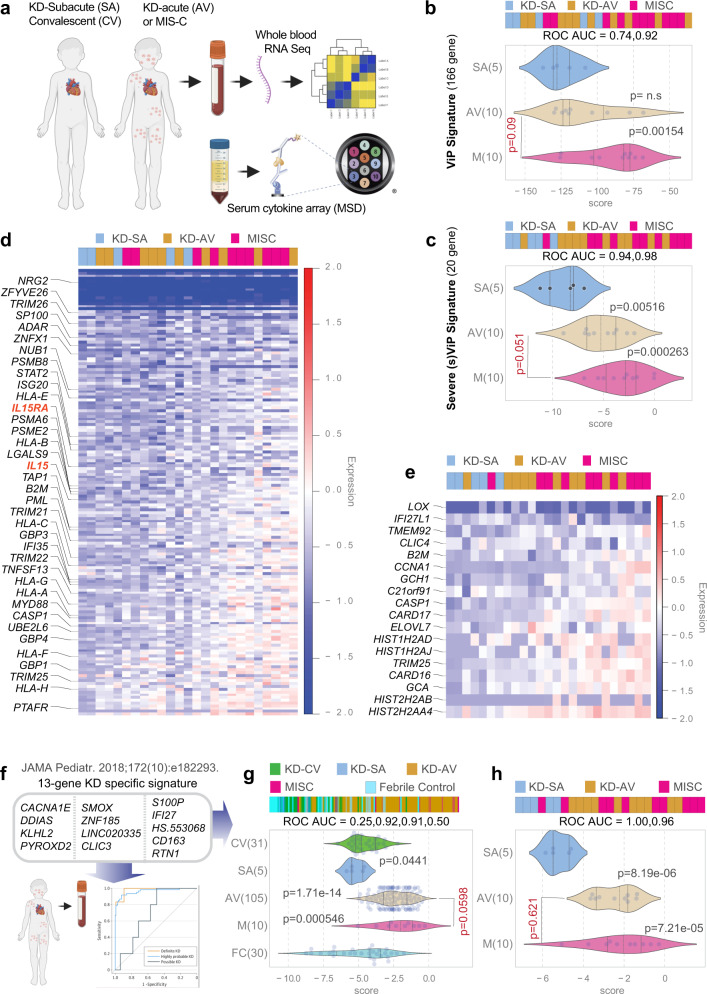
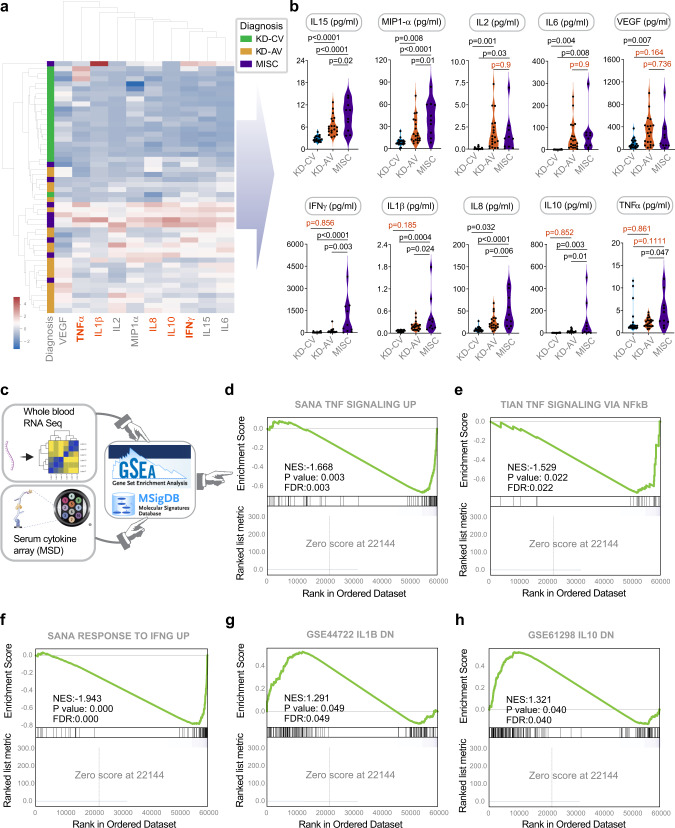
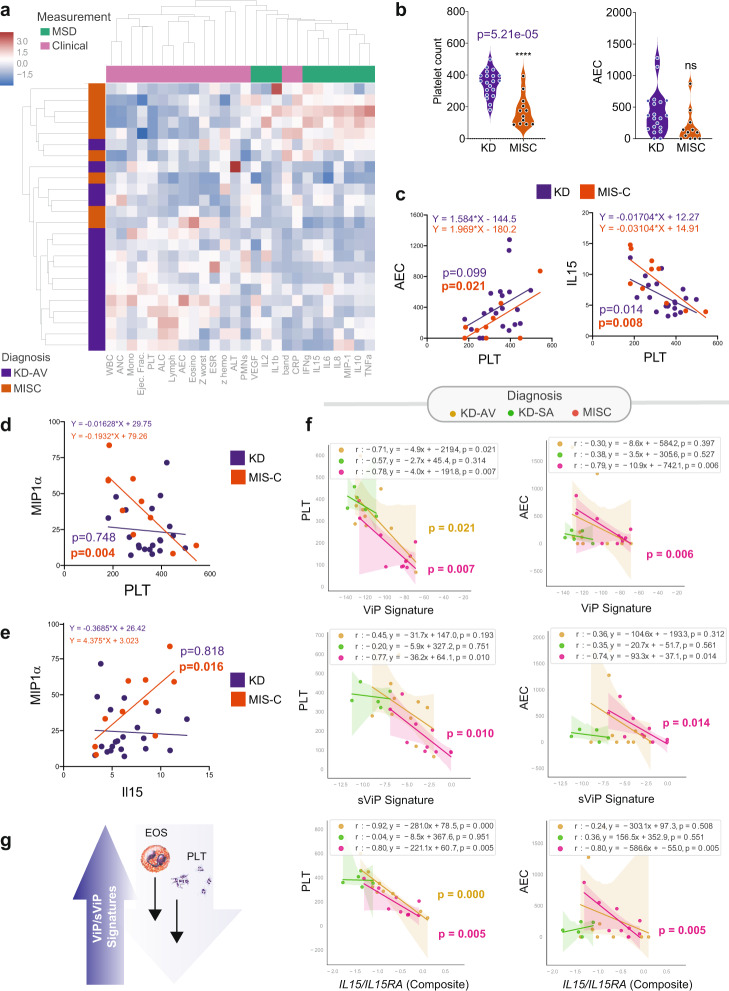
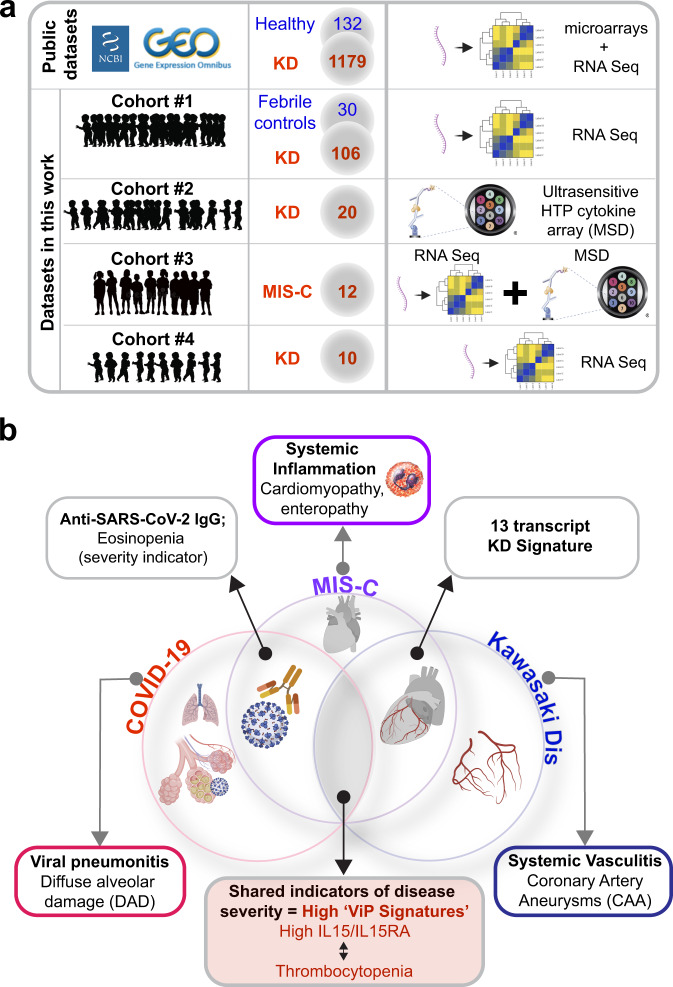
Multisystem inflammatory syndrome in children (MIS-C) is an illness that emerged amidst the COVID-19 pandemic but shares many clinical features with the pre-pandemic syndrome of Kawasaki disease (KD). Here we compare the two syndromes using a computational toolbox of two gene signatures that were developed in the context of SARS-CoV-2 infection, i.e., the viral pandemic (ViP) and severe-ViP signatures and a 13-transcript signature previously demonstrated to be diagnostic for KD, and validated our findings in whole blood RNA sequences, serum cytokines, and formalin fixed heart tissues. Results show that KD and MIS-C are on the same continuum of the host immune response as COVID-19. Both the pediatric syndromes converge upon an IL15/IL15RA-centric cytokine storm, suggestive of shared proximal pathways of immunopathogenesis; however, they diverge in other laboratory parameters and cardiac phenotypes. The ViP signatures reveal unique targetable cytokine pathways in MIS-C, place MIS-C farther along in the spectrum in severity compared to KD and pinpoint key clinical (reduced cardiac function) and laboratory (thrombocytopenia and eosinopenia) parameters that can be useful to monitor severity.


Conflict of interest statement

The authors declare no competing interests.

Figures

Fig. 1
Fig. 1. A Viral Pandemic (ViP) signature that is induced in COVID-19, is induced also in epidemic outbreaks of KD.
a Schematic displays the computational approach (BECC) and rigor (diversity and number of datasets) used to identify the 166-gene ViP and a subset of 20-gene severe (s)ViP signatures, and the subsequent experimentally validated inferences and impact of the same in a recent study. The numbers in gray circles denote the total number of datasets analyzed in each category. b Schematic displays the various pathogenic triggers that induce ViP signatures (many of which are triggers also for KD) and the prominent induction of IL15/IL15RA as an invariant nature of the cytokine storm. c Bubble plots of ROC-AUC values (radii of circles are based on the ROC-AUC) demonstrating the strength of classification and the direction of gene regulation (Up, red; Down, blue) for the classification based on the 20-gene severe ViP signature (top) and 166-gene ViP signature (bottom) in numerous publicly available historic datasets. ViP signatures classified KD vs. healthy children (left), acute vs. convalescent KD (middle) and treatment response in the setting of combination therapy with IV steroids (MP methylprednisone) and IV IgG alone (IVIG), but not IVIG alone. Numbers on top of bubble plots indicate number of subjects in each comparison group. d, e Bar (top) and violin (bottom) plots display the classification of blood samples that were collected during acute (AV), sub-acute (SA; ~10–14 days post-discharge) and convalescent (CV; 1 year post-onset) visits from two independent KD cohorts (d; Historic Cohort 1; e; Prospective Cohort 2) using ViP (left) or sViP (right) signatures. f Bar (top) and violin (bottom) plots display the sub-classification of blood samples in Cohort 1 based on coronary artery aneurysm (CAA) status using ViP (left) or sViP (right) signatures. Welch’s two sample unpaired two-sided t-test is performed on the composite gene signature score to compute the p values. In multi-group setting each group is compared to the first control group and only significant p values are displayed on the right. Additional pvalues are displayed on the left.
Fig. 2
Fig. 2. A KD-specific 13 transcript signature shows that KD and MIS-C are indistinguishable, but ViP/sViP signatures place MIS-C as farther along the spectrum than KD.
a Schematic displays the workflow for patient blood collection and analysis by RNA Seq (this figure) and cytokine array by mesoscale (Figs. 4 and 5). b, c Bar (top) and violin (bottom) plots display the classification of blood samples that were collected during collected during acute (AV) and sub-acute (SA; ~10–14 days post-discharge) visits of KD subjects and from patients diagnosed with MIS-C. The p value for comparison between acute KD (AV) and MIS-C (M) is displayed in red font. d, e Heatmaps display the patterns of expression of the 166 genes in ViP (d) and 20 gene sViP (e) signatures in the KD and MIS-C samples. The only cytokine–receptor pair within the signature, i.e., IL15/IL15RA, are highlighted on the left in red font in (d). f Schematic displays the 13-transcript whole blood signature (no overlaps with ViP signature genes) previously demonstrated to distinguish KD from other childhood febrile illnesses. g and h Bar (top) and violin (bottom) plots display the classification of blood samples that were collected during acute (AV) and convalescent (CV) visits from two independent KD cohorts (g; Historic Cohort 1; e; Prospective Cohort 2) using 13-transcript KD signature. FC, febrile control. See also Supplementary Fig. S1 for co-dependence analysis of ViP and KD-13 signatures. Welch’s two sample unpaired two-sided t-test is performed on the composite gene signature score to compute the p values. In multi-group setting each group is compared to the first control group and only significant p values are displayed. The p value for comparison between acute KD (AV) and MIS-C (M) is displayed in red font.
Fig. 3
Fig. 3. Performance of ViP/sViP signatures on independent MIS-C datasets and on diverse tissues and in diverse diseases of the immune system.
ac Severe (s)ViP signature can classify severe MIS-C based on in two independent studies (GSE166489 and GSE167028). Schematic in a summarizes the definition of severe MIS-C. b, c Classification of blood samples in two cohorts of MIS-C subjects, based on the need for ICU management due to the presence (MYO+) or recovery in the absence (R or MYO−) of myocardial dysfunction using sViP signature. Welch’s two sample unpaired two-sided t-test is performed to compute the p values. d Bubble plots of ROC-AUC values (radii of circles are based on the ROC-AUC) and the direction of gene regulation (Up, red; Down, blue) in publicly available datasets using 4 gene signatures: the 166-gene ViP signature, the 20-gene sViP signature, the KD-13 signature, and finally the IL15/IL15RA composite score. Numbers on top of bubble plots indicate number (n) of control vs. disease samples in each dataset. Abbreviations: PBMCs peripheral blood mononuclear cells, Mac macrophages, WB whole blood, MTb M. tubercutosis, Flu Influenza, HIV human immunodeficiency virus, RSV respiratory syncytial virus, JM juvenile myositis, sjia systemic juvenile idiopathic arthritis, SLE systemic lupus erythematosus, IBD Inflammatory bowel disease, COPD chronic obstructive pulmonary disesase, JDM juvenile dermatomyositis, MS multiple sclerosis, BAL bronchoalveolar lavage, NOMID neonatal onset multisystem inflammatory disease, MAS macrophage activation syndrome, NLRC4 NLR Family CARD Domain Containing 4. e Schematic showing the experimental design for studying differentially expressed genes (DEGs) in between KD and MIS-C subjects. f, g PCA (f) and a clustered heatmap analysis (g) of KD (green, f) and MIS-C (orange, f) samples are shown based on top 2242 genes according to mean absolute deviation identified using StepMiner algorithm. Source data are provided. h Reactome pathway analysis of the DEGs between seven KD and seven MIS-C subjects in f (marked on the PCA). i Venn diagram between 166-gene ViP signature against the DEGs. Number of genes are indicated for each group in the Venn diagram. 11 overlapping genes between ViP signature and up-regulated in MIS-C are listed at the top.
Fig. 4
Fig. 4. Serum cytokine arrays and whole blood transcriptomes reveal the severity and nature of the cytokine storm in MIS-C that distinguishes it from KD.
a Heatmap displays the results of unsupervised clustering of sub-acute and acute KD (KD-SA, KD-AV; n = 10 each) and MIS-C (n = 10) subjects using the cytokine profiles determined by mesoscale (MSD). Red = cytokines differentially expressed between MIS-C and KD. See also Supplementary Fig. S2 for violin plots for individual cytokines. b Source data are provided as a Supplementary Data 2. Violin plots display the shared (top panels; IL15, MIP1a, IL2, IL6 and VEGF) and distinct (bottom panels; IFNγ, IL1β, IL8, IL10, and TNFα) features of the cytokine storm in MIS-C vs. KD subjects. Statistical significance was determined by one-way ANOVA followed by Tukey’s test for multiple comparisons. c Schematic shows the process used to integrate serum cytokine array results with whole blood RNA Seq data; cytokines that were differentially expressed in MIS-C were used to inform GSEA of the corresponding pathways. df Gene set enrichment analysis (GSEA pre-ranked analysis) of three pathways derived from MSigDB: SANA TNF SIGNALING UP (d), TIAN TNF SIGNALING VIA NFkB (e), and SANA RESPONSE TO IFNG UP (f) demonstrate the significance of TNF (d, e) and IFNG (f) pathway activation in MIS-C. g, h Down-regulated genes after IL1B (g) and IL10 (h) stimulation were derived from differential expression analysis of GSE44722 (n = 269 genes), and GSE61298 (n = 208 genes) respectively. GSEA pre-ranked analysis to test the significance of IL1B and IL10 pathway is performed like panels df using the down-regulated genes. GSEA pre-ranked analysis computes nominal pvalue and FDR using an empirical phenotype-based permutation test procedure. No adjustments were made for multiple comparisons because of single hypothesis testing. Source data are provided as a Source Data file.
Fig. 5
Fig. 5. An integrated analysis of mesoscale (cytokine) data, ViP/sViP transcriptomic signatures and laboratory and clinical parameters reveals features that are unique to MIS-C.
a Heatmap displays the results of hierarchical agglomerative clustering of acute KD (KD-AV; n = 10) and MIS-C (n = 10) subjects using the cytokine profiles determined by mesoscale (MSD) and the laboratory features. Source data are provided as a Source Data file. b Violin plots display PLT (platelet) and AEC (absolute eosinophil counts) in KD and MIS-C (unpaired two-sided Student’s t-test used to test significance). ce Correlation test (two-sided test of the slope of the regression line compared to zero) between AEC and PLT (c; left) and IL15 and PLT (c; right), and MIP1α and PLT (d) and MIP1α and IL15 (e) are shown, and significance was calculated and displayed using GraphPad Prism 9. Significance: ns: non-significant, ****p < 0.0001. See Supplementary Fig. S3 for all possible correlation tests between clinical and cytokine data in KD, MIS-C and COVID-19. f Correlation tests between PLT (left) or AEC (right) on the Y-axis and gene signature scores on the X-axis [either ViP (top), sViP (middle) or a IL15/IL15RA composite (bottom)] were calculated and displayed as scatter plots using python seaborn lmplots with the p-values. The confidence interval around the regression line is indicated with shades. g Schematic summarizing the findings in MIS-C based on laboratory and RNA seq analysis.
Fig. 6
Fig. 6. ViP/sViP signatures correlate with two distinct cardiac phenotypes in MIS-C and KD.
a Violin plots display the left ventricular ejection functions (LVEF) in KD and MIS-C patients. Statistical significance was determined by unpaired two-sided Student’s t-test. bd Correlation tests (two-sided test of the slope of the regression line compared to zero) between LVEF (Y-axis) and gene signature scores on the X-axis [either ViP (b), sViP (c), or a IL15/IL15RA composite (d)] are displayed as a scatter plot and significance was calculated and displayed as in Fig. 5f. The confidence interval around the regression line is indicated with shades. e Bar and violin plots show how a IL15/IL15RA compositive score varies between KD samples. The score classifies KD-AV with giant CAAs from control (KD-CV) samples with a ROC AUC 0.95. Welch’s two sample unpaired two-sided t-test is performed on the composite gene signature score to compute the p values. In multi-group setting each group is compared to the first control group and only significant p values are displayed.
Fig. 7
Fig. 7. Summary of findings and conclusions.
a Summary of datasets used (publicly available prior ones and new original cohorts) to support the conclusions in this work. Numbers in circles denote the number of subjects in each cohort. b Venn diagram displays the major findings from the current work. ViP/sViP signatures, and more specifically, the IL15/IL15RA specific gene induction are shared between patients in all three diagnostic groups. While these signatures are known to be associated with diffuse alveolar damage in the lungs of patients with COVID-19, it is associated with CAA in KD and with reduction in cardiac muscle contractility in MIS-C. Overlapping features between each entity are displayed.

Comment in

Similar articles

Cited by

References

    1. Levin M. Childhood multisystem inflammatory syndrome - a new challenge in the pandemic. N. Engl. J. Med. 2020;383:393–395. doi: 10.1056/NEJMe2023158. - DOI - PMC - PubMed
    1. Whittaker E, et al. Clinical characteristics of 58 children with a pediatric inflammatory multisystem syndrome temporally associated with SARS-CoV-2. JAMA. 2020;324:259–269. doi: 10.1001/jama.2020.10369. - DOI - PMC - PubMed
    1. Riphagen S, Gomez X, Gonzalez-Martinez C, Wilkinson N, Theocharis P. Hyperinflammatory shock in children during COVID-19 pandemic. Lancet. 2020;395:1607–1608. doi: 10.1016/S0140-6736(20)31094-1. - DOI - PMC - PubMed
    1. Toubiana J, et al. Kawasaki-like multisystem inflammatory syndrome in children during the covid-19 pandemic in Paris, France: prospective observational study. BMJ. 2020;369:m2094. doi: 10.1136/bmj.m2094. - DOI - PMC - PubMed
    1. Kawasaki T, Kosaki F, Okawa S, Shigematsu I, Yanagawa H. A new infantile acute febrile mucocutaneous lymph node syndrome (MLNS) prevailing in Japan. Pediatrics. 1974;54:271–276. doi: 10.1542/peds.54.3.271. - DOI - PubMed

Publication types

Supplementary concepts