. 2022 May 16;13(1):2708.
doi: 10.1038/s41467-022-30293-9.

Ca2+-mediated higher-order assembly of heterodimers in amino acid transport system b0,+ biogenesis and cystinuria

Affiliations

Ca2+-mediated higher-order assembly of heterodimers in amino acid transport system b0,+ biogenesis and cystinuria

Yongchan Lee et al. Nat Commun. .

Abstract

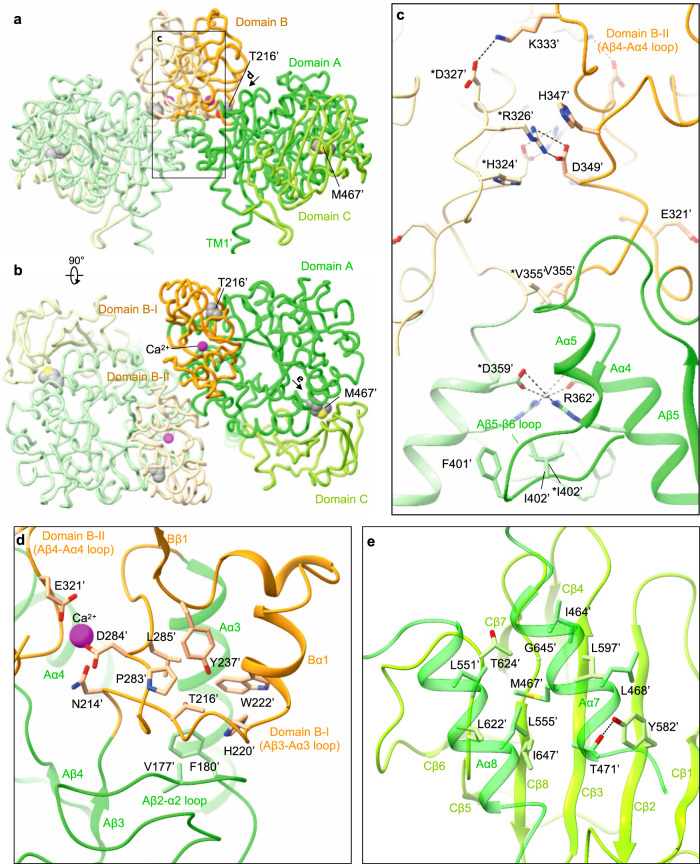
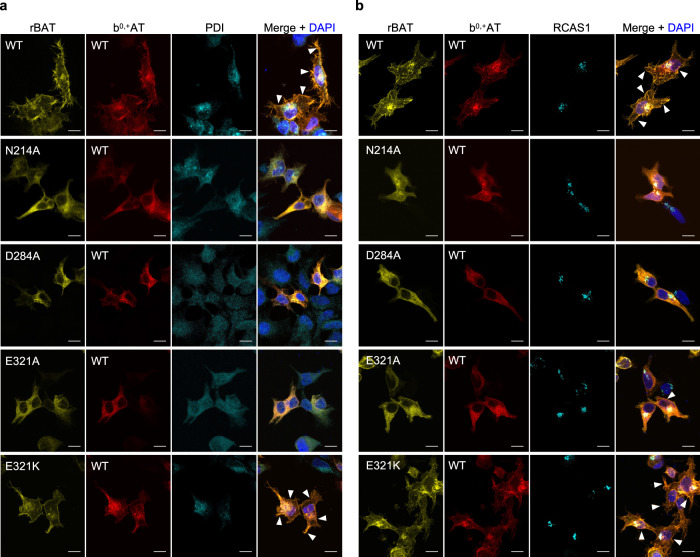
Cystinuria is a genetic disorder characterized by overexcretion of dibasic amino acids and cystine, causing recurrent kidney stones and kidney failure. Mutations of the regulatory glycoprotein rBAT and the amino acid transporter b0,+AT, which constitute system b0,+, are linked to type I and non-type I cystinuria respectively and they exhibit distinct phenotypes due to protein trafficking defects or catalytic inactivation. Here, using electron cryo-microscopy and biochemistry, we discover that Ca2+ mediates higher-order assembly of system b0,+. Ca2+ stabilizes the interface between two rBAT molecules, leading to super-dimerization of b0,+AT-rBAT, which in turn facilitates N-glycan maturation and protein trafficking. A cystinuria mutant T216M and mutations of the Ca2+ site of rBAT cause the loss of higher-order assemblies, resulting in protein trapping at the ER and the loss of function. These results provide the molecular basis of system b0,+ biogenesis and type I cystinuria and serve as a guide to develop new therapeutic strategies against it. More broadly, our findings reveal an unprecedented link between transporter oligomeric assembly and protein-trafficking diseases.


Conflict of interest statement

The authors declare no competing interests.

Figures

Fig. 1
Fig. 1. Structural and biochemical characterization of b0,+AT–rBAT in a lipid environment.
a 2D class averages of ovine and murine b0,+AT–rBAT imaged by negative-stain electron microscopy. The rBAT ectodomains are marked by yellow arrows. b 2D class averages of LAT1–CD98hc. The CD98hc ectodomain is marked by a yellow arrow. c Uptake of ʟ-[3H]Arg by ovine b0,+AT–rBAT reconstituted into proteoliposomes. Proteoliposomes were pre-loaded with either 1 mM or no ʟ-Arg. Control experiments were performed with protein-free liposomes. Values are mean ± SEM. n = 3 technical replicates. d Cryo-EM map of the super-dimeric b0,+AT–rBAT complex in lipid nanodiscs. Map densities corresponding to different chains and chemical identities are colored as follows: rBAT (green and light green), b0,+AT (cyan and light cyan), nanodisc (translucent white), lipids (yellow) and N-linked glycans (orange). e Ribbon diagram of b0,+AT–rBAT. The position of the lipid bilayer is based on the lipid-solvent boundaries calculated by the PPM server (https://opm.phar.umich.edu/ppm_server).
Fig. 2
Fig. 2. Structure of the ovine b0,+AT–rBAT heterodimer.
a Detailed depiction of the b0,+AT–rBAT subcomplex, derived from 3D multi-body refinement (see Methods). Note that the complex is re-oriented from Fig. 1e to the membrane normal. CHOL, cholesterol; POPC, palmitoyl oleoyl phosphatidyl choline; TMD; transmembrane domain; ED, ectodomain; NAG, N-acetylglucosamine. b The rBAT ectodomain. The Ca2+ ion, N-linked glycans, and individual subdomains are labeled. c b0,+AT complexed with rBAT TM1′. Lipids and individual TMs are labeled. CH, C-terminal helix; NH, N-terminal helix.
Fig. 3
Fig. 3. The interface analysis of b0,+AT–rBAT.
a Extracellular interactions formed by the Aα4-β5 loop, Aα6, EL4a and EL4b. Key interacting residues are shown, with hydrophilic interactions depicted by dotted lines. Arg365′ stabilizes the Aα4-β5 loop through interaction with Tyr378′. The locations of panels (ad) are indicated on the right. b C-terminal peptide of rBAT. The peptide is dark green for better visibility. Leu678′ contacts the membrane surface, as calculated by the PPM server (https://opm.phar.umich.edu/ppm_server). c Intramembrane interactions. TM1′ and TM4 have numerous hydrophobic residues that pack against each other. The C-terminal helix (CH) of b0,+AT is dark cyan for better visibility. d CH and ‘Val-Pro-Pro’ motif of b0,+AT, forming intracellular interactions.
Fig. 4
Fig. 4. The rBAT ectodomain.
a Structure of the ectodomain homo-dimer. The three subdomains are A (green), B (orange) and C (light green). Common cystinuria-related residues Thr216′ and Met467′ and the Ca2+ ions are shown as spheres. b Extracellular view of the rBAT ectodomain. c Zoom-up of super-dimer interface. Salt bridges, π-cation-π stacking and van-der-Waals interactions are indicated. Residues from the adjacent protomer are marked with asterisks (*). d Interaction network around Thr216′ and Ca2+. e Interaction network around Met467′.
Fig. 5
Fig. 5. The Ca2+-binding site.
a Cryo-EM map of the Ca2+-binding site at 2.6 Å resolution, contoured at 16 σ (blue) and 36 σ (magenta). b Close-up view of the Ca2+-binding site. The coordination distances in Å are labeled. Note that unmodelled water molecules may contribute to the full Ca2+ coordination. c Endo H assay evaluating the N-glycan maturation. The wild-type rBAT yields a mature, higher molecular-weight form that resists Endo H treatment (upper band), in addition to the core-glycosylated form (lower band, left lane), which gets de-glycosylated by the Endo H treatment (lowest band, right lane). d Endo H assay for the Ca2+-binding site. Lanes 1–3: positive controls, where WT or disulfide-less mutants (rBAT C114S or b0,+AT C144S) showed normal rBAT maturation. Lane 4: negative control, where rBAT without b0,+AT lost the mature band. Lanes 5–8: Ca2+-binding site mutants. Cation-compensating E321K restored the mature band nearly to the WT level. e Endo H assay for super-dimerization mutants (locations shown in Fig. 4c). The two double mutations D349R/D359R (labeled RR) and R326D/R362D (labeled DD) completely abolished maturation. f Workflow of site-specific cross-linking assay for detecting super-dimers. V355C introduces a pair of cysteines at the rBAT–rBAT homomeric interface (locations shown in Fig. 4c). When b0,+AT–rBAT forms a super-dimer, a pair of Cys355′ residues form a disulfide bond, which can be detected as higher-molecular weight species in oxidizing SDS-PAGE. Also see Supplementary Fig. 10 for larger gels. g Cross-linking assay for Ca2+-binding site mutants. Overlay displays two fluorescence channels (GFP (green) and mCherry (red)) on non-reducing SDS-PAGE. Yellow thus represents the b0,+AT–rBAT heterocomplexes (monomeric or super-dimeric). Note that wild-type rBAT mutations show some super-dimers even without the V355C mutation, indicating a strong assembly. h Cross-linking assay for super-dimer interface mutants. i Control experiments for cross-linking assay. Addition of β-mercaptoethanol dissociates b0,+AT and rBAT into two separate bands. j Uptake of 100 μM ʟ-[14C]-ornithine in HEK293 cells transfected with b0,+AT-WT, and rBAT-WT or rBAT mutants. Net uptake was normalized to WT set as 100%. Values are mean ± SEM. n = 4 technical replicates.
Fig. 6
Fig. 6. b0,+AT-rBAT biogenesis and protein stability.
a Schematic model proposing b0,+AT-rBAT biogenesis. The process is initiated by dimerization of b0,+AT and rBATc followed by their super-dimerization, both of which take place in the ER. Super-dimer is then translocated to the Golgi apparatus for N-glycan maturation. Symbols below each protein form correspond to those presented on the gels in bh. be Pulse-chase analysis of HeLa cells transfected with wild-type b0,+AT (no tag) and wild-type GFP-rBAT b or the Ca2+-binding site mutants (D284A, E321A, or E321K; ce). After labeling the cells with [35S]Met/Cys, the cells were chased at indicated times with or without 100 nM thapsigargin. The eluent from immunoprecipitation were subjected to 7% non-reducing SDS-PAGE. Three major forms of rBAT were detected during chasing times: super-dimer, b0,+AT-rBAT dimers (mature and immature forms), and core glycosylated rBAT (rBATc) monomer. Asterisk indicates the aggregation of rBAT at the top of polyacrylamide gel. f Cycloheximide (CHX)-chase analysis of HeLa cells transfected with wild-type mCherry-b0,+AT and wild-type GFP-rBAT or the Ca2+-binding site mutants (D284A, E321A, or E321K). After transfection for 16 hrs, the cells were treated with 50 μg/ml CHX at indicated times. Equal amount of total protein lysates were subjected to 7% non-reducing SDS-PAGE. Two gel images display the overlayed GFP (green) and mCherry (red) fluorescence channels imaged at the same exposure time (30 s for GFP and 5 min for mCherry). Yellow thus represents the merge of mCherry-b0,+AT and GFP-rBAT. g Band intensity analysis of the wild-type b0,+AT-rBAT. The intensities of rBAT in all complex forms (super-dimers, mature b0,+AT-rBAT dimers, b0,+AT-rBATc dimers, and rBAT monomer) were quantitated and normalized to their values at 0 h. Graphs are mean ± SD. n = 3 (independent experiments including the representative gels in f). h Band intensity analysis of the super-dimers from the wild-type b0,+AT-rBAT and the Ca2+-binding site mutants. The band intensities of super-dimers from rBAT mutants were compared to that of wild-type rBAT at 0 h. Graphs are mean ± SD. n = 3 (independent experiments including the representative gels in f).
Fig. 7
Fig. 7. Localization of b0,+AT-rBAT and its Ca2+-binding site mutants.
Fluorescence imaging of HeLa cells expressing wild-type b0,+AT-mCherry (red) and wild-type or mutated GFP-rBAT (yellow). Fluorescent staining with anti-PDI (panel a, colored cyan) and anti-RCAS1 (panel b, colored cyan) antibodies were used as markers for the ER and Golgi apparatus, respectively. Plasma membrane localization of b0,+AT-rBAT are indicated in the white arrowheads. Scale bar = 10 μm.
Fig. 8
Fig. 8. Cystinuria mutants.
a Cross-linking assay to evaluate the super-dimerization for cystinuria mutants. Overlay of GFP and mCherry fluorescence channels on non-reducing SDS-PAGE are displayed. b Endo H assay to evaluate the N-glycan maturation for cystinuria mutants. c Fluorescence imaging of HeLa cells expressing GFP-rBAT (yellow) and mCherry-b0,+AT (red) or the indicated mutants. Fluorescent staining with anti-PDI (cyan in the left panel) and anti-RCAS1 (cyan in the right panel) antibodies were used as markers for ER and Golgi apparatus, respectively. Plasma membrane localization of b0,+AT-rBAT are indicated in the white arrowheads. Scale bar = 10 μm. d Uptake of 100 μM ʟ-[14C]-ornithine in HEK293 cells transfected with wild-type b0,+AT and rBAT or the indicated mutants. Net uptake was normalized to WT set as 100%. Values are mean ± SEM. n = 4 technical replicates.
Fig. 9
Fig. 9. Putative substrate-binding site of b0,+AT and transport assays.
a, b Cα trace representation of b0,+AT, highlighting the TMs involved in substrate translocation. The hash domain is colored cyan and the bundle domain is blue. The Asp233 is shown as stick model. c Cut-away surface representation of b0,+AT from the same view as a. The inward-facing cavity is indicated by an arrow. d Close-up view of putative substrate-binding site. e Comparison of b0,+AT with ApcT. Residues of ApcT are shown in pink. f Comparison of b0,+AT with LAT1. Residues of LAT1 are shown in yellow. g Uptake of 100 μM ʟ-[14C]ornithine in HEK293 cells expressing b0,+AT–rBAT or its mutants. Net uptake was normalized to WT set as 100%. h Uptake of 100 μM ʟ-[3H]tyrosine by b0,+AT mutants in the transfected HEK293 cells. The uptake was performed in Na+-free buffer with 10 μM SKN103 to inhibit LAT1 function. i Uptake of 100 μM ʟ-[3H]tyrosine by b0,+AT mutants in the transfected HEK293 cells. The uptake was performed in Na+-containing buffer with 10 μM SKN103. j Uptake of 50 μM ʟ-[14C]cystine by b0,+AT mutants in the transfected HEK293 cells. k Uptake of 100 μM ʟ-[3H]alanine by b0,+AT mutants in the transfected HEK293 cells. l Concentration-dependent uptake of ʟ-[14C]Ornithine by b0,+AT WT and N236D in the transfected HEK293 cells. Km and Vmax of ʟ-[14C]Orn transport by b0,+AT WT are 145 μM and 7.5 nmol/mg prot./min, respectively, those of N236D are 97 μM and 2.1 nmol/mg prot./min, respectively. m Concentration-dependent uptake of ʟ-[3H]tyrosine by b0,+AT WT and D233S in the transfected HEK293 cells. Km and Vmax of ʟ-[3H]Tyr transport by b0,+AT WT are 87 μM and 1.1 nmol/mg prot./min, respectively, and those of N233S are 44 μM and 0.5 nmol/mg prot./min, respectively. The values in gm are mean ± SEM. n = 3-4 technical replicates (see data in Source Data file).
Fig. 10
Fig. 10. A working model for b0,+AT-rBAT biogenesis and its defects in cystinuria.
a Model of super-dimer assembly in the ER. The initial step is the heterodimerization of b0,+AT and core-glycosylated rBAT (denoted as rBATc). Since b0,+AT is known to be required for oxidative folding and N-glycan maturation of rBAT, defects in the b0,+AT expression itself (e.g., b0,+AT G105R) or the b0,+AT–rBAT interaction (e.g., rBAT L89P) would interfere with the initial assembly process and thus prevent glycan maturation. In the latter step, two molecules of b0,+AT–rBAT assemble to form a super-dimer, which requires Ca2+ binding. Mutations that prevent super-dimerization, such as rBAT T216M and the Ca2+-binding site mutants, abolish this step. Incomplete complexes cannot pass the ER quality control. It is noted that rBAT R365W and M467T can form super-dimers to some extent but are probably less stable than the wild-type, due to their positions in the subdomain interfaces. b In the Golgi apparatus, the super-dimeric b0,+AT–rBAT undergoes full glycan maturation (mature glycans are depicted by longer branches). As rBAT R365W and M467T can form super-dimers, they get partially maturated. c Upon correct maturation, super-dimeric b0,+AT–rBAT will be trafficked to the apical membrane of epithelial cells. Microvilli consist of numerous membrane protrusions, consistent with the curved lipid bilayer of b0,+AT–rBAT. d Non-type I mutations (e.g., b0,+AT V170M) abolish transport activity.

Comment in

  • Uro-Science.
    Atala A. Atala A. J Urol. 2023 Jan;209(1):289-291. doi: 10.1097/JU.0000000000003033. Epub 2022 Oct 21. J Urol. 2023. PMID: 36268621 No abstract available.
  • Urolithiasis/Endourology.
    Assimos DG. Assimos DG. J Urol. 2023 May;209(5):1021-1023. doi: 10.1097/JU.0000000000003379. Epub 2023 Feb 22. J Urol. 2023. PMID: 37026651 No abstract available.

References

    1. Chillarón J, et al. Pathophysiology and treatment of cystinuria. Nat. Rev. Nephrol. 2010;6:424–434. doi: 10.1038/nrneph.2010.69. - DOI - PubMed
    1. Thomas K, Wong K, Withington J, Bultitude M, Doherty A. Cystinuria—a urologist’s perspective. Nat. Rev. Urol. 2014;11:270–277. doi: 10.1038/nrurol.2014.51. - DOI - PubMed
    1. Joly D, et al. Treatment of cystinuria. Pediatr. Nephrol. 1999;13:945–950. doi: 10.1007/s004670050736. - DOI - PubMed
    1. Zee T, et al. α-Lipoic acid treatment prevents cystine urolithiasis in a mouse model of cystinuria. Nat. Med. 2017;23:288–290. doi: 10.1038/nm.4280. - DOI - PMC - PubMed
    1. Calonge M, et al. Cystinuria caused by mutations in rBAT, a gene involved in the transport of cystine. Nat. Genet. 1994;6:420–425. doi: 10.1038/ng0494-420. - DOI - PubMed

Publication types

MeSH terms

Supplementary concepts

LinkOut - more resources