. 2022 May 16;13(1):2690.
doi: 10.1038/s41467-022-30416-2.

A conserved YAP/Notch/REST network controls the neuroendocrine cell fate in the lungs

Affiliations

A conserved YAP/Notch/REST network controls the neuroendocrine cell fate in the lungs

Yan Ting Shue et al. Nat Commun. .

Abstract

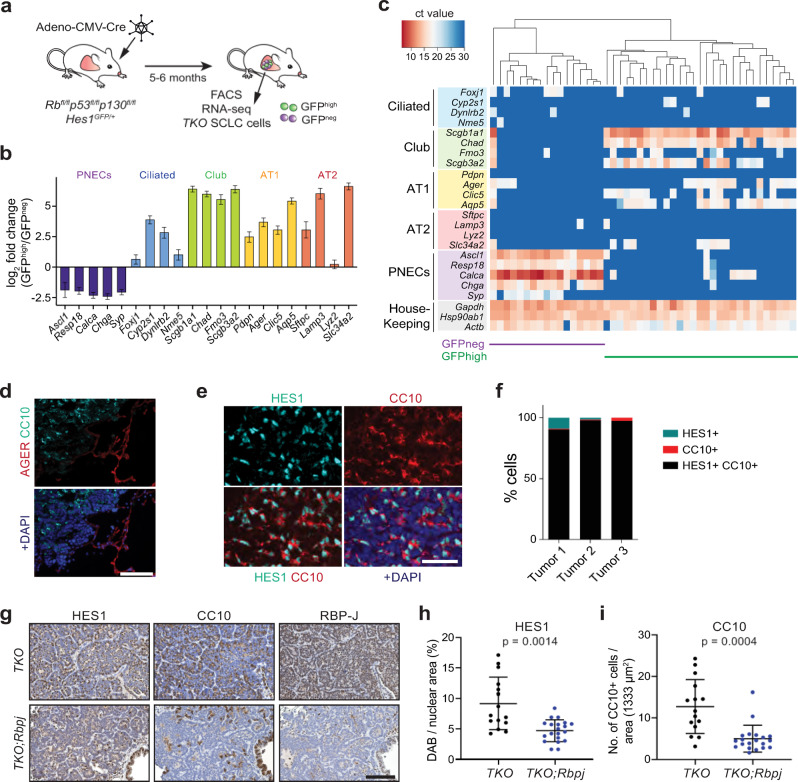
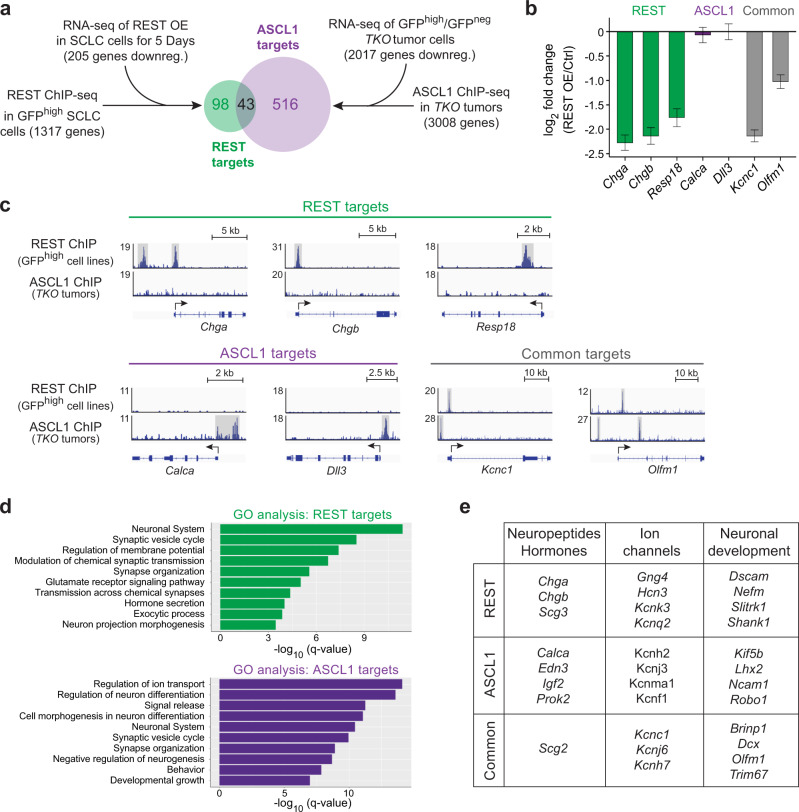
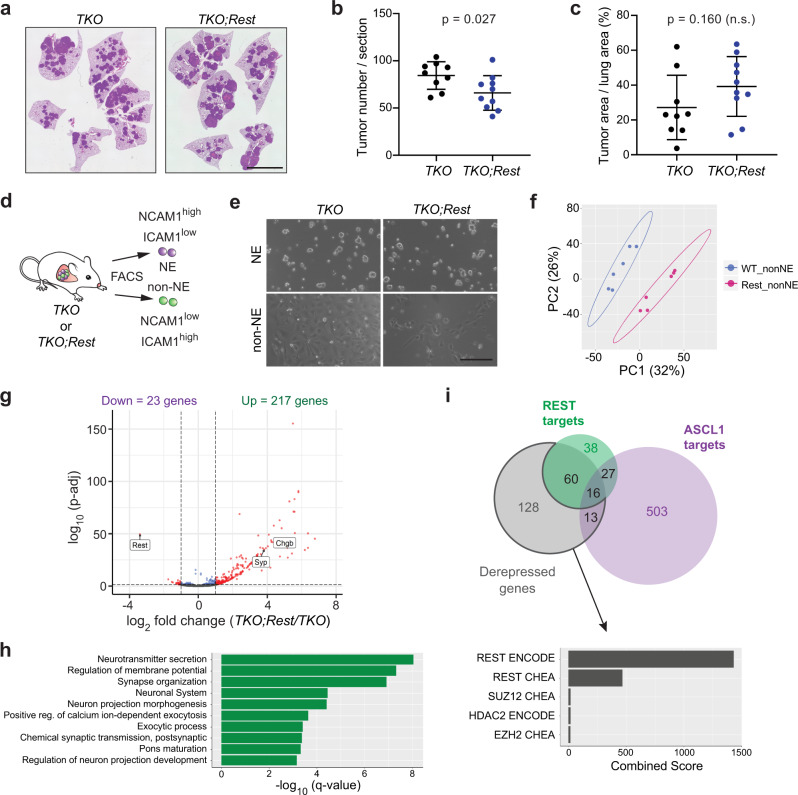
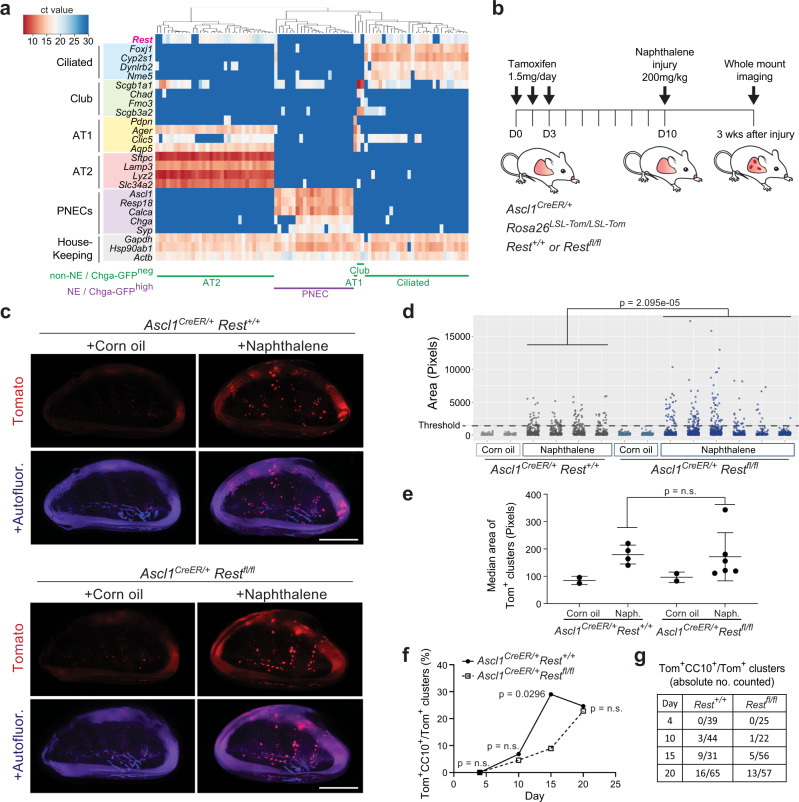
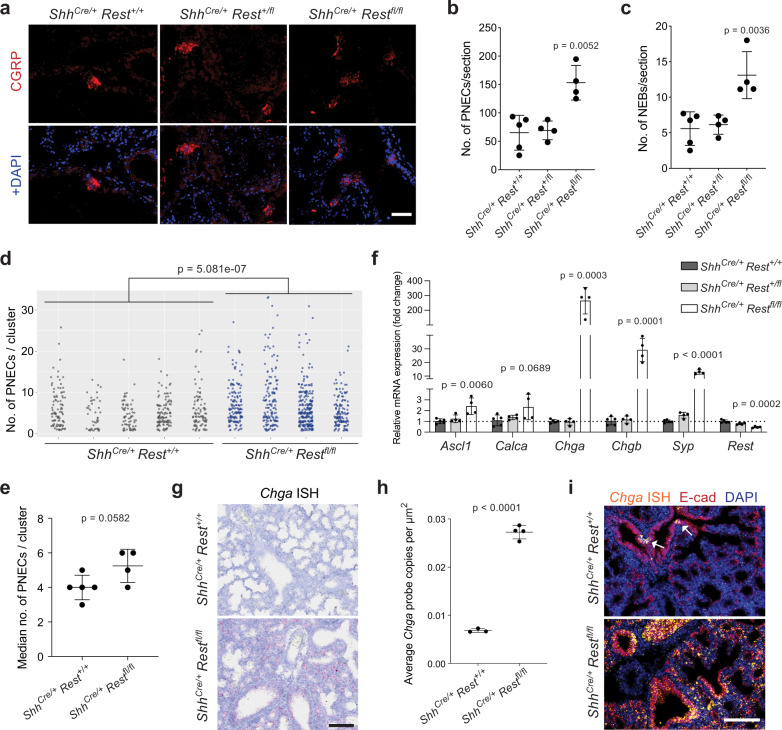
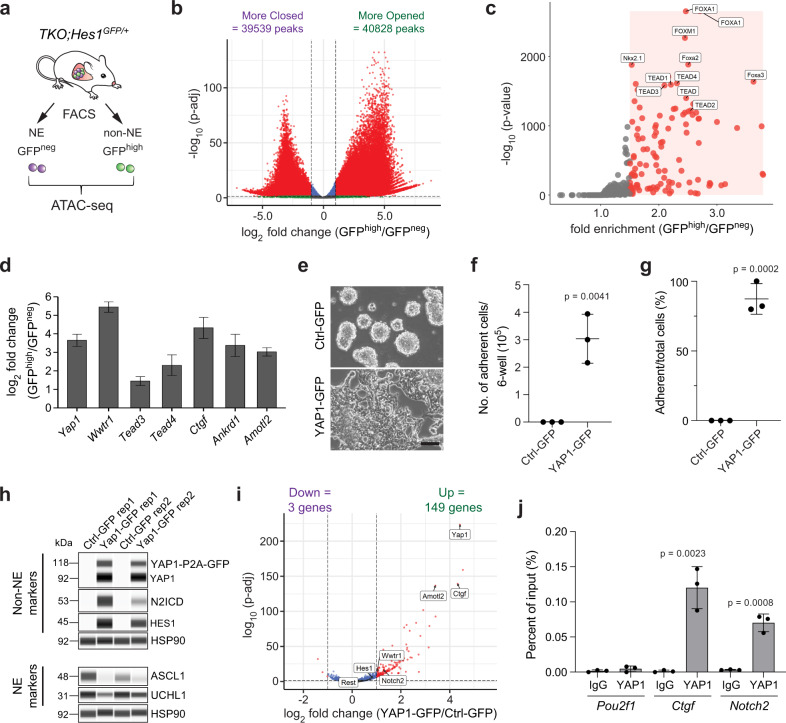
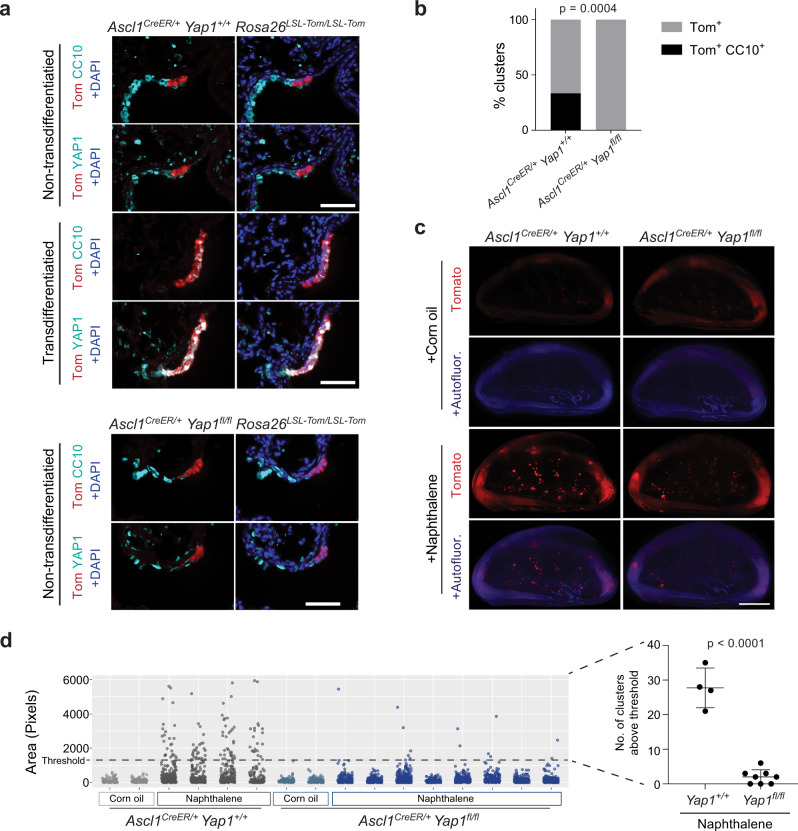
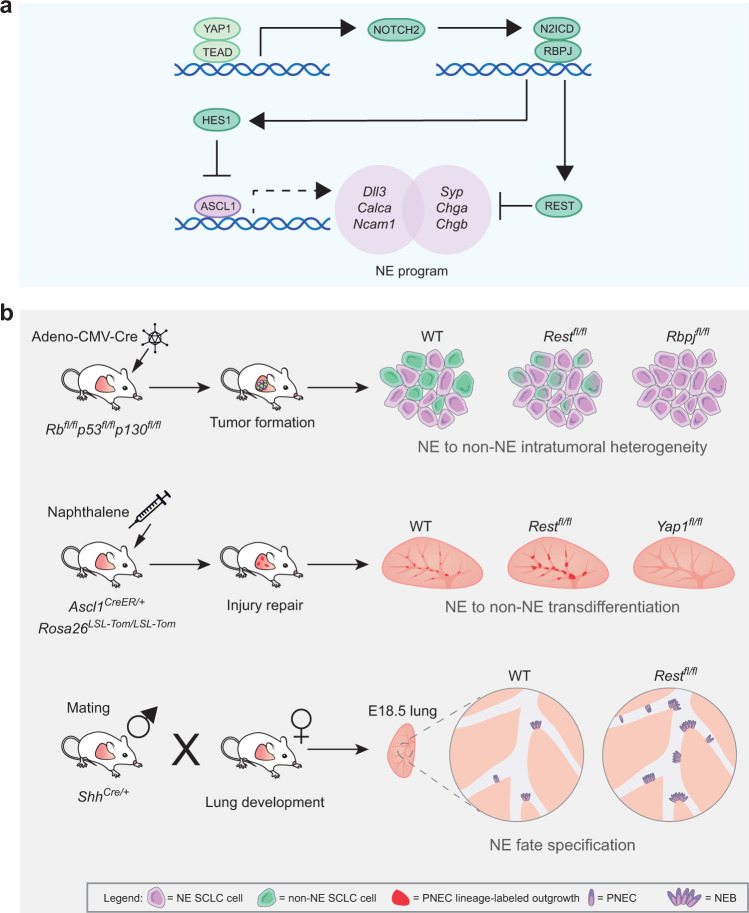
The Notch pathway is a conserved cell-cell communication pathway that controls cell fate decisions. Here we sought to determine how Notch pathway activation inhibits the neuroendocrine cell fate in the lungs, an archetypal process for cell fate decisions orchestrated by Notch signaling that has remained poorly understood at the molecular level. Using intratumoral heterogeneity in small-cell lung cancer as a tractable model system, we uncovered a role for the transcriptional regulators REST and YAP as promoters of the neuroendocrine to non-neuroendocrine transition. We further identified the specific neuroendocrine gene programs repressed by REST downstream of Notch in this process. Importantly, we validated the importance of REST and YAP in neuroendocrine to non-neuroendocrine cell fate switches in both developmental and tissue repair processes in the lungs. Altogether, these experiments identify conserved roles for REST and YAP in Notch-driven inhibition of the neuroendocrine cell fate in embryonic lungs, adult lungs, and lung cancer.


Conflict of interest statement

The authors declare no competing interests.

Figures

Fig. 1
Fig. 1. HES1-positive non-neuroendocrine cells in mouse SCLC tumors have features of club epithelial cells.
a Schematic representation of the Rbfl/fl;p53fl/fl;p130fl/fl;Hes1GFP/+ mouse model of SCLC (TKO;Hes1GFP/+) in which HES1+ non-neuroendocrine SCLC cells generated by Notch pathway activation can be visualized and isolated by GFPhigh expression from the Hes1 locus, along with GFP-negative (GFPneg) neuroendocrine SCLC cells. b Expression of classical markers of the indicated lung epithelial cell types from RNA-seq data in GFPhigh cells compared to GFPneg cells (n = 4). Error bars, log2 fold change estimate ± SE. c Single-cell RT-qPCR analysis (Fluidigm) of GFPhigh and GFPneg SCLC cells (n = 46) isolated from TKO;Hes1GFP/+ tumors for markers of lung epithelial cells. See Supplementary Fig. 1g for an independent experiment. In this sensitive assay, all GFPhigh cells express Scgb1a1, which codes for the club cell marker CC10. d Representative immunofluorescence images for AGER (red) and CC10 (cyan, encoded by Scgb1a1) on a mouse SCLC tumor section (n = 1 experiment, multiple tumors were stained). DAPI stains the DNA in blue. Scale bar, 100 μm. e Representative immunofluorescence images for HES1 (cyan) and CC10 (red) on a mouse SCLC tumor section (n = 2 independent experiments). DAPI stains the DNA in blue. Scale bar, 50 μm. f Quantification (%) of cells that are either HES1+, CC10+, or HES1+ CC10+ in n = 3 mouse tumors as in (e). g Representative immunohistochemistry images of HES1, CC10, and RBP-J staining (brown signal) in TKO and TKO;Rbpjfl/fl tumors (hematoxylin counterstain). Scale bar, 100 μm. h, i Quantification of HES1 staining (h) and CC10 staining (i) in tumor sections from (g) (n = 15 tumors from 3 mice for TKO and 20 tumors from 4 mice for TKO;Rbpjfl/fl). Unpaired t-test with Welch’s correction, data represented as mean ± s.d. See also Supplementary Figs. 1 and 2 and Supplementary Data 1 and 2. Source data are provided as a Source Data file.
Fig. 2
Fig. 2. REST and ASCL1 control largely non-overlapping programs in SCLC cells.
a Experimental workflow to identify REST and ASCL1 candidate target genes. GFPhigh cells are non-NE SCLC cells from TKO;Hes1GFP/+ tumors while GFPneg cells represent NE SCLC cells. The mouse SCLC cell line used for the RNA-seq of REST overexpression (OE) is the neuroendocrine KP1 cell line. b Expression of selected neuroendocrine and neuronal-related genes from RNA-seq data of 5-day REST overexpression (n = 3). Error bars, log2 fold change estimate ± SE. c ChIP-seq data showing REST and ASCL1 binding near/within their respective target genes in (b). d Gene ontology (GO) analysis of candidate REST and ASCL1 targets. Note the similar GO terms between the two factors. e Examples of REST, ASCL1 and shared target genes in different gene categories. See also Supplementary Figs. 3 and 4 and Supplementary Data 3–9.
Fig. 3
Fig. 3. Loss of REST prevents the repression of its neuroendocrine targets in SCLC cells.
ac Representative images of lung sections from TKO and TKO;Restfl/fl mice 5 months after Ad-CMV-Cre (TKO;Rest, quadruple mutant), stained with hematoxylin and eosin (H&E). Scale bar, 5 mm. Quantification of tumor numbers (b) and tumor area (c) (n = 9 mice for TKO and 10 mice for TKO;Restfl/fl). Error bar, mean ± s.d. d and e Schematic representation (d) and representative brightfield images (e) of neuroendocrine (NE) and non-NE cells sorted from TKO and TKO;Rest mutant tumors based on NCAM1 and ICAM1 expression. Scale bar, 200 μm. f Principal component analysis (PCA) of RNA-seq data comparing non-NE cell lines generated from TKO and TKO;Rest mutant tumors (n = 6 per genotype). WT wild-type for Rest; “Rest”, knockout for Rest. g Volcano plot of differentially expressed genes from RNA-seq data of TKO and TKO;Rest mutant non-NE cell lines. Rest and the classical neuroendocrine markers Syp/Chgb are highlighted (significant genes with more than 2-fold change and p-adj value < 0.05 are in red). Wald test with Benjamini–Hochberg correction. h Gene Ontology (GO) analysis of the upregulated genes in the TKO;Rest mutant non-NE cell lines. i Venn diagram showing the amount of overlap between derepressed genes of TKO;Rest mutant non-NE cell lines with REST and ASCL1 targets identified in Fig. 2. Bar graph showing top 5 candidate transcription factors from Enrichr analysis (ENCODE and ChEA Consensus TFs from ChIP-X) on the 141 derepressed genes that did not overlap with our REST targets. See also Supplementary Figs. 5 and 6 and Supplementary Data 10 and 11. Source data are provided as a Source Data file.
Fig. 4
Fig. 4. Loss of REST delays pulmonary neuroendocrine cell fate transition in response to naphthalene injury.
a Single-cell RT-qPCR analysis of Rest expression in pulmonary neuroendocrine cells (PNECs) and non-NE lung epithelial cells from normal lungs of two Chga-GFP adult mice (n = 87 cells). b Timeline of the PNEC lineage tracing and naphthalene-induced lung injury experiment. Tom, Tomato fluorescent reporter. c Whole-mount fluorescence images of left lung lobes 3 weeks after injury. Images representative of n = 2 independent experiments. Scale bar, 5 mm. d, e Quantification (d) of normal neuroepithelial bodies (NEBs) and PNEC outgrowths after injury as in (c) with each column representing a single mouse left lung lobe and each data point a tomato-positive cluster in that mouse. A Wilcoxon rank sum test, two-sided, was conducted on the combined PNEC outgrowths from all the mice in each respective group that are above the threshold size of the non-injured controls (n = 107 for Rest+/+, n = 146 for Restfl/fl). Median area (e) of all Tom+ clusters per mouse as in (d) (n = 2 mice for corn oil controls, 4 mice for naphthalene-treated Ascl1CreER/+;Rest+/+ and 6 mice for naphthalene-treated Ascl1CreER/+;Restfl/fl). Unpaired t-test, data represented as mean ± s.d. f, g Percentage (f) and absolute number counted (g) of Tom+CC10+ clusters over total number of Tom+ clusters at various timepoints after naphthalene injury (n = number of clusters as indicated in table (g) totaled from representative left lung lobe sections of 3–4 mice per timepoint). Fisher’s exact test, two-tailed. See also Supplementary Fig. 7. Source data are provided as a Source Data file.
Fig. 5
Fig. 5. REST is antagonistic to pulmonary neuroendocrine cells specification in normal lung development.
a Immunostaining for CGRP, a marker of pulmonary neuroendocrine cells (PNECs) on sections from E18.5 Shhcre/+;Rest+/+, Rest+/fl, and Restfl/fl lungs. DAPI stains DNA in blue. Scale bar, 50 μm. bd Quantification of the average number of CGRP+ PNECs (b) and neuroepithelial bodies (NEBs) (≥5 PNECs) (c) per lung section from each embryo (n = 5 embryos with 37 sections counted for Rest+/+ and 4 embryos with 30 sections counted for Rest+/fl and Restfl/fl). Unpaired t-test, data represented as mean ± s.d. In (d), a scatterplot of all solitary PNECs and clusters of each embryo (n = 438 for Rest+/+, 688 for Restfl/fl). Wilcoxon rank sum test, two-sided, on the combined data points of each genotype. e, Median number of PNECs per cluster for each embryo as in (d) (n = 5 embryos for Rest+/+ and 4 embryos for Restfl/fl). Unpaired t-test, data represented as mean ± s.d. f Relative mRNA expression levels of NE markers and Rest in E18.5 Shhcre/+;Rest+/+, Rest+/fl, and Restfl/fl lungs (n = 5 embryos for Rest+/+ and 4 embryos for Rest+/fl and Restfl/fl). Unpaired t-test, data represented as mean ± s.d. g Representative brightfield images of Chga RNAscope in situ hybridization (ISH, red signal) in E18.5 Shhcre/+;Rest+/+ and Restfl/fl lungs (hematoxylin counterstain). Scale bar, 50 μm. h Quantification of the average number of RNAscope signal per μm2 of lung section in (g) (n = 3 embryos for Rest+/+ and 4 embryos for Restfl/fl). Unpaired t-test, data represented as mean ± s.d. i, Representative images for Chga RNAscope ISH (orange) and E-cadherin immunofluorescence (red) in E18.5 Shhcre/+;Rest+/+ and Restfl/fl lungs. DAPI stains the DNA in blue. White arrows, NEBs. Scale bar, 100 μm. See also Supplementary Fig. 8. Source data are provided as a Source Data file.
Fig. 6
Fig. 6. YAP1 promotes the transdifferentiation of SCLC cells to a non-neuroendocrine fate.
a Schematic representation of neuroendocrine (NE) and non-NE SCLC cells isolated from the TKO;Hes1GFP/+ mouse model for ATAC-seq. b Volcano plot of differentially accessible peaks from the ATAC-seq data comparing non-NE SCLC cells to NE SCLC cells (significant peaks with more than 2-fold change and p-adj value < 0.001 are in red). Wald test with Benjamini–Hochberg correction. c Scatterplot showing the enriched motifs identified by HOMER analysis on the more open peaks in non-NE SCLC cells (significant motifs with more than 1.5-fold change and p-value < 0.001 are in red). d Expression of Hippo pathway members and targets from RNA-seq data in GFPhigh cells compared to GFPneg cells (n = 4). Error bars, log2 fold change estimate ± SE. eg, e Representative brightfield images of NE mouse KP1 SCLC cells 14 days after Ctrl-GFP (control) or YAP1-GFP overexpression. Scale bar, 100 μm. Quantification of the number of adherent cells counted per well of a 6-well plate (f) and the percentage of cells that became adherent (g) as in (e) (n = 3 independent experiments). Unpaired t-test, data represented as mean ± s.d. h Immunoassay of non-NE and NE markers in KP1 cells after overexpression of either Ctrl-GFP or YAP1-GFP (4 weeks). Bands of two molecular weights are detected with the antibody against YAP1 due to some incomplete cleavage of P2A. Samples from n = 2 independent experiments. i Volcano plot of differentially expressed genes from RNA-seq data of 5 days overexpression of YAP1 in KP1 cells. Notch2, Hes1, Rest and Hippo pathway members are highlighted (significant genes with more than 2-fold change and p-adj value < 0.05 are in red). Wald test with Benjamini–Hochberg correction. j ChIP-qPCR analysis of YAP1 binding at the promoters of Pou2f1 (negative ctrl), Ctgf (positive ctrl) and Notch2 in independently generated GFPhigh cell lines from TKO;Hes1GFP/+ mouse SCLC tumors (n = 3). Unpaired t-test, data represented as mean ± s.d. See also Supplementary Fig. 9 and Supplementary Data 12 and 13. Source data are provided as a Source Data file.
Fig. 7
Fig. 7. YAP1 is required for the transdifferentiation of pulmonary neuroendocrine cells after naphthalene injury.
a Representative immunofluorescence images for Tomato expression (red) and either CC10 or YAP1 (cyan) on consecutive sections from a Ascl1CreER/+;Rosa26LSL-Tom/LSL-Tom;Yap1+/+ or Yap1fl/fl mouse 3 weeks after naphthalene-induced lung injury and tamoxifen injection (as in Fig. 4b). DAPI stains DNA in blue in the images on the right. Scale bar, 50 μm. b Quantification (%) of clusters that are Tom+ or Tom+, CC10+ after injury as in (a) (n = 27 clusters for Yap1+/+ and 32 clusters for Yap1fl/fl counted from 3 mice per genotype). Fisher’s exact test, two-tailed. c Whole mount fluorescence images of left lung lobes 3 weeks after injury. Images representative of n = 2 independent experiments. Scale bar, 5 mm. d Scatterplot of normal NEBs and PNEC outgrowths after injury as in (c) with each column in the scatterplot representing a single mouse and each data point a tomato-positive cluster in that mouse (n = 2 mice for corn oil controls, 4 mice for naphthalene-treated Yap1+/+ and 8 mice for naphthalene-treated Yap1fl/fl). Unpaired t-test was conducted on the number of clusters from each mouse in naphthalene-treated groups that are above the threshold size of the non-injured controls (n = 4 mice for Yap1+/+, n = 8 mice for Yap1fl/fl), data represented as mean ± s.d. See also Supplementary Fig. 10. Source data are provided as a Source Data file.
Fig. 8
Fig. 8. A conserved YAP/Notch/REST network controls the neuroendocrine cell fate in the lungs.
a Schematics of the molecular pathway governing the activation/repression of the neuroendocrine programs. Active YAP1 upregulates the expression of NOTCH2, which in turn increases the expression of REST and HES1. HES1 represses the transcription of Ascl1, indirectly repressing the genes under ASCL1 transcriptional control, while REST directly represses the transcription of a distinct part of the neuroendocrine program. b Schematics of the in vivo experiments testing the effect of the loss of Rest/Rbpj/Yap1 on intratumoral heterogeneity, transdifferentiation during injury repair, and neuroendocrine fate specification during lung development. In the tumor model, loss of Rest prevents full transition to the non-neuroendocrine fate in contrast to Rbpj, which completely blocks the transition. In the injury model, Rest deletion delays terminal transdifferentiation resulting in a longer proliferation phase and larger outgrowths. Yap1 deletion blocks the ability of PNECs to respond to the injury, leading to the reduction in outgrowths/transdifferentiation. In the development model, the absence of REST promotes the neuroendocrine fate, causing an increase in the number of pulmonary neuroendocrine cells (PNECs) and neuroepithelial bodies (NEBs) in the lung.

References

    1. Henrique, D. & Schweisguth, F. Mechanisms of Notch signaling: a simple logic deployed in time and space. Development146, dev172148 (2019). - PubMed
    1. Louvi, A. & Artavanis-Tsakonas, S. Notch and disease: a growing field. Semin. Cell Dev. Biol. 23, 473–480 (2012). - PMC - PubMed
    1. Ntziachristos P, Lim JS, Sage J, Aifantis I. From fly wings to targeted cancer therapies: a centennial for notch signaling. Cancer Cell. 2014;25:318–334. doi: 10.1016/j.ccr.2014.02.018. - DOI - PMC - PubMed
    1. Penton AL, Leonard LD, Spinner NB. Notch signaling in human development and disease. Semin. Cell Dev. Biol. 2012;23:450–457. doi: 10.1016/j.semcdb.2012.01.010. - DOI - PMC - PubMed
    1. Siebel C, Lendahl U. Notch signaling in development, tissue homeostasis, and disease. Physiol. Rev. 2017;97:1235–1294. doi: 10.1152/physrev.00005.2017. - DOI - PubMed

Publication types

Substances