. 2022 May 16;12(1):8082.
doi: 10.1038/s41598-022-12179-4.

RT-qPCR-based tests for SARS-CoV-2 detection in pooled saliva samples for massive population screening to monitor epidemics

Affiliations

RT-qPCR-based tests for SARS-CoV-2 detection in pooled saliva samples for massive population screening to monitor epidemics

Michał Różański et al. Sci Rep. .

Abstract

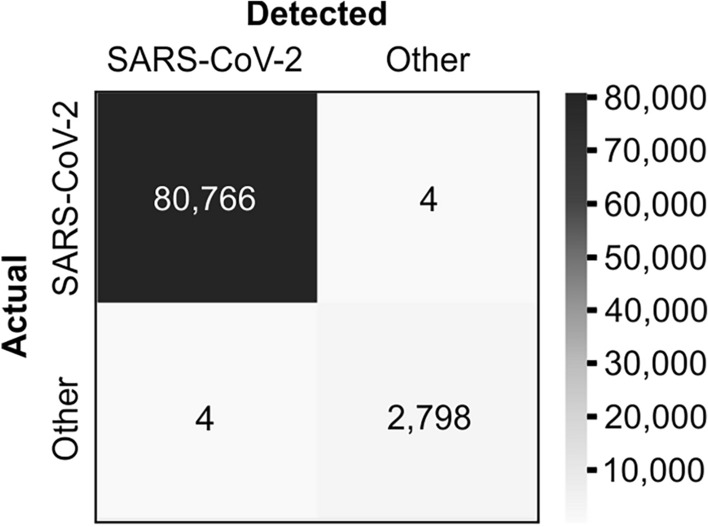
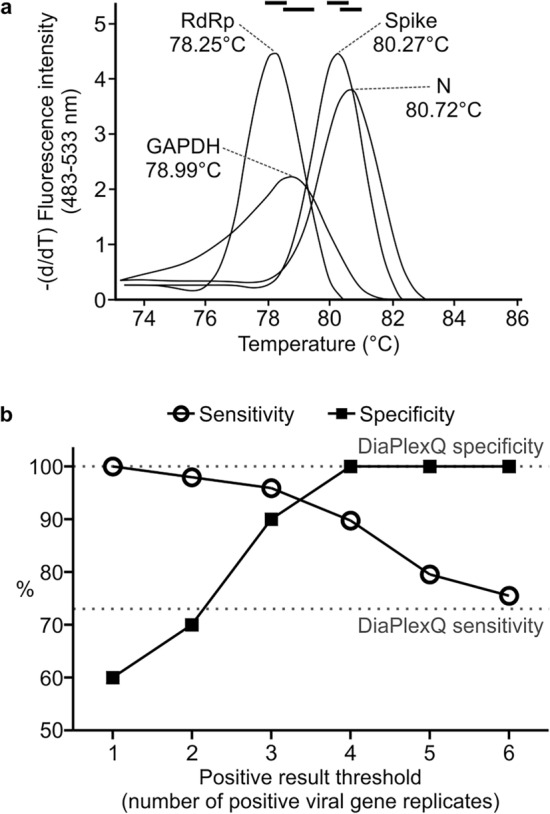
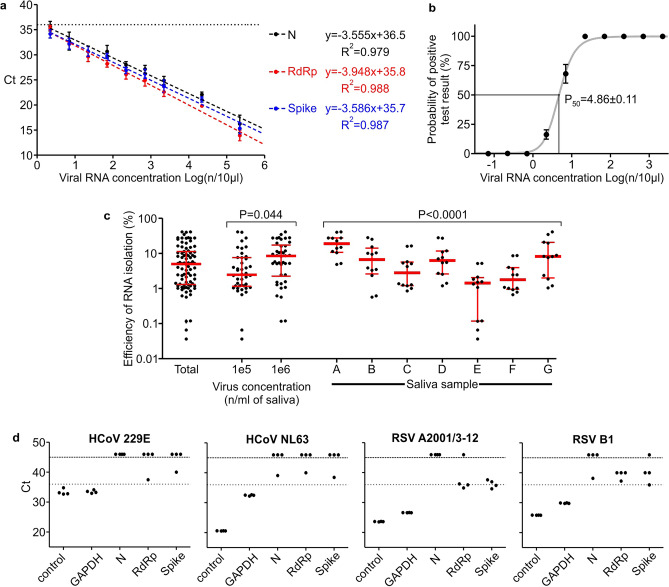
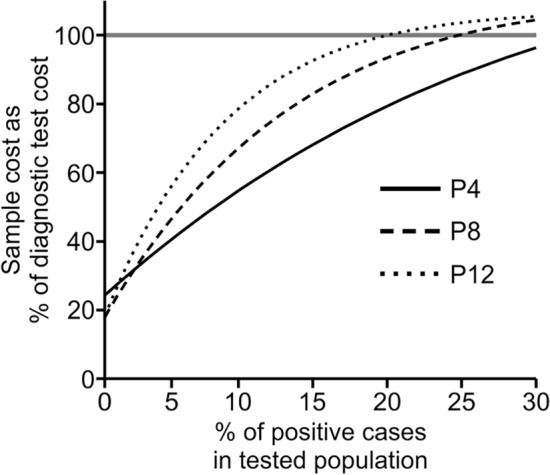
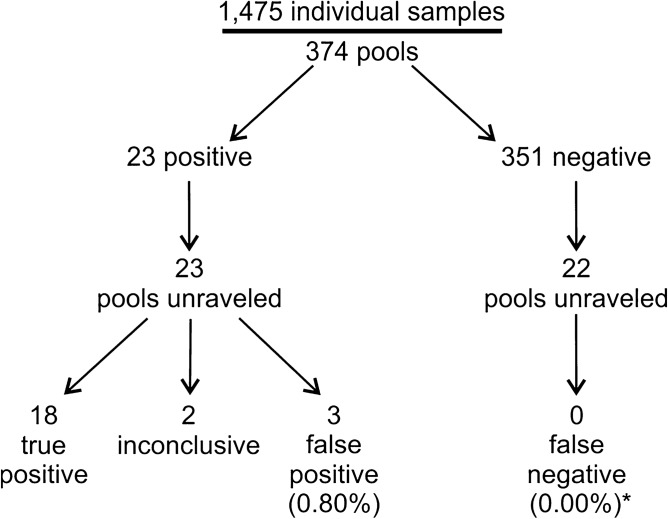
Swab, RT-qPCR tests remain the gold standard of diagnostics of SARS-CoV-2 infections. These tests are costly and have limited throughput. We developed a 3-gene, seminested RT-qPCR test with SYBR green-based detection designed to be oversensitive rather than overspecific for high-throughput diagnostics of populations. This two-tier approach depends on decentralized self-collection of saliva samples, pooling, 1st-tier testing with highly sensitive screening test and subsequent 2nd-tier testing of individual samples from positive pools with the IVD test. The screening test was able to detect five copies of the viral genome in 10 µl of isolated RNA with 50% probability and 18.8 copies with 95% probability and reached Ct values that were highly linearly RNA concentration-dependent. In the side-by-side comparison, the screening test attained slightly better results than the commercially available IVD-certified RT-qPCR diagnostic test DiaPlexQ (100% specificity and 89.8% sensitivity vs. 100% and 73.5%, respectively). Testing of 1475 individual clinical samples pooled in 374 pools of four revealed 0.8% false positive pools and no false negative pools. In weekly prophylactic testing of 113 people within 6 months, a two-tier testing approach enabled the detection of 18 infected individuals, including several asymptomatic individuals, with substantially lower cost than individual RT-PCR testing.


Conflict of interest statement

Jarosław Dastych is the CEO of Proteon Pharmaceuticals S.A., which offers the presented method as a commercial service. The other authors declare no competing interests.

Figures

Figure 1
Figure 1
Specificity of primer pairs used in screening test. Bioinformatic confusion matrix of chosen primer pair sequences vs. SARS-CoV-2 genomes and other Coronaviridae genomes.
Figure 2
Figure 2
Criteria of the test result assignment. (a) Derivatives of the representative melting curves of the tested genes in the screening test and mean Tm values. Black bars on top: temperature intervals within which the measured Tm value is considered specific for each gene. (b) Sensitivity and specificity of the seminested SARS-CoV-2 screening test depending on the positive result criterion. The percentage of true positive samples (n = 49) and true negative samples (n = 20) which were qualified correctly depending on the number of positive replicates of viral genes (in total of 6) in the screening test that was chosen as a threshold. Dotted lines: respective parameters, achieved by validated diagnostic test.
Figure 3
Figure 3
Quantitative performance of the screening test. (a) RNA-based Ct calibration curves for individual genes. Mean ± SD, n = 6. Dashed lines: linear regression curves fitted to data. The calculated curve equations and coefficients of determination are listed on the right side. Linear fitting P < 0.0001 for each gene. Dotted horizontal line: threshold Ct value for specific amplification. (b) Probability of obtaining positive results of the screening test depending on viral RNA concentration in a sample. Black points/whiskers: 95% confidence intervals with the center of each interval marked. Gray line: four parameter logistic curve fitted to data. P50 value presented as the mean ± SEM. (c) Efficiency of RNA isolation: number of copies calculated from Ct calibration curve divided by number of viral particles added to saliva samples. Each point represents efficiency calculated independently from a single viral gene replicate. Red lines/whiskers: median and interquartile range. Data points presented as total are also analyzed by groups, depending on virus concentration or saliva sample used as a carrier for isolation. The significance of differences between groups was calculated with ANOVA. No post hoc tests were performed. (d) Experimental verification of cross-reactivity with selected respiratory viruses. Ct values for individual genes obtained by qPCR in a seminested screening test using RNA samples of chosen non-SARS-CoV-2 respiratory viruses; control: primer pair specific to each virus. Upper dashed line: last cycle of the reaction; points above indicate samples with no detectable amplification. Lower dotted line: chosen threshold for specific amplification; points above are considered nonspecific by default.
Figure 4
Figure 4
Economics of screening test. Comparative costs of testing using epidemic pooling tests and individual diagnostic tests employing a one-step, multiplex RT-qPCR SARS-CoV-2 commercial kit. Data are normalized against the cost of individual testing using commercial diagnostic tests (100%, horizontal line) and for both methods include the cost of reagents, disposable, PPE, labor, laboratory equipment and overheads. P4, P8, P12: pooling factors (number of individual samples within a pool).
Figure 5
Figure 5
Results of routine use of the screening test; asterisk: false negative ratio calculated only from unraveled negative pools (which include 88 individual samples).

Similar articles

Cited by

References

    1. WHO. COVID-19 Weekly Epidemiological Update. https://www.who.int/publications/m/item/weekly-epidemiological-update-on.... Access 20 Apr 2021 (2021).
    1. WHO. COVID-19 Weekly Epidemiological Update. https://www.who.int/publications/m/item/weekly-epidemiological-update-on.... Access 21 Mar 2022 (2022).
    1. Poland GA, Ovsyannikova IG, Kennedy RB. SARS-CoV-2 immunity: Review and applications to phase 3 vaccine candidates. Lancet. 2020;396:1595–1606. doi: 10.1016/S0140-6736(20)32137-1. - DOI - PMC - PubMed
    1. Shang W, Yang Y, Rao Y, Rao X. The outbreak of SARS-CoV-2 pneumonia calls for viral vaccines. npj Vaccines. 2020;5:1–3. doi: 10.1038/s41541-020-0170-0. - DOI - PMC - PubMed
    1. Rahbari R, Moradi N, Abdi M. rRT-PCR for SARS-CoV-2: Analytical considerations. Clin. Chim. Acta. 2021;516:1–7. doi: 10.1016/j.cca.2021.01.011. - DOI - PMC - PubMed

Publication types