

Label-free discrimination of tumorigenesis stages using in vitro prostate cancer bone metastasis model by Raman imaging
- PMID: 35577856
- PMCID: PMC9110417
- DOI: 10.1038/s41598-022-11800-w
Label-free discrimination of tumorigenesis stages using in vitro prostate cancer bone metastasis model by Raman imaging
Abstract
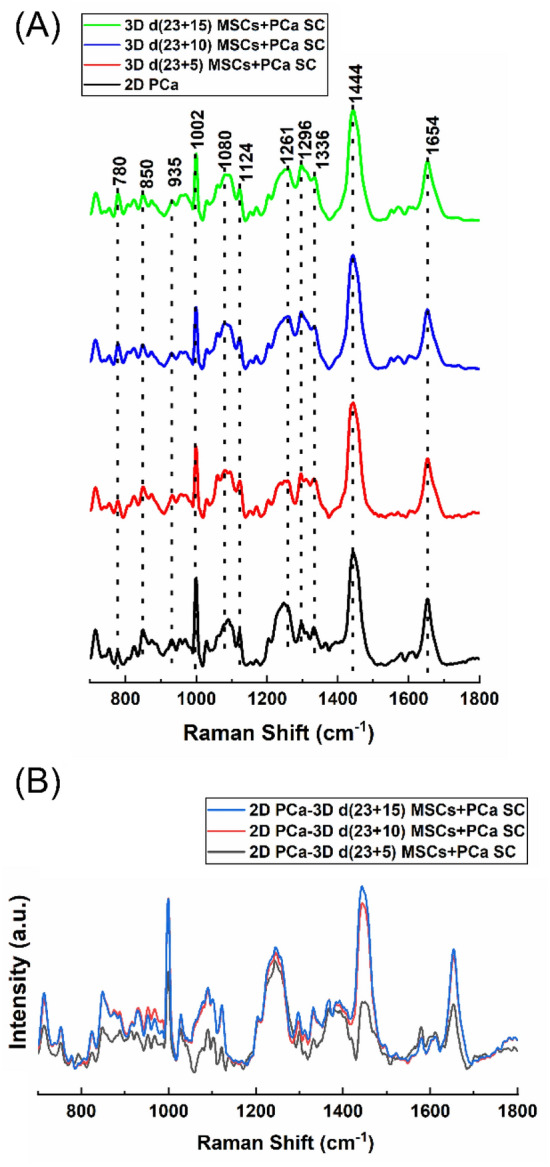
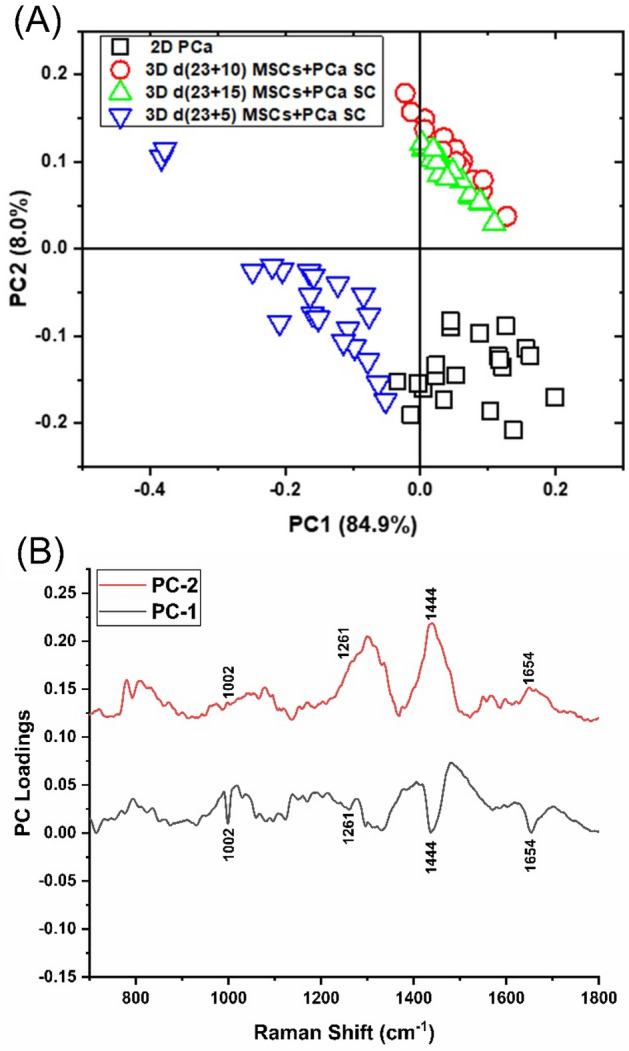
Metastatic prostate cancer colonizes the bone to pave the way for bone metastasis, leading to skeletal complications associated with poor prognosis and morbidity. This study demonstrates the feasibility of Raman imaging to differentiate between cancer cells at different stages of tumorigenesis using a nanoclay-based three-dimensional (3D) bone mimetic in vitro model that mimics prostate cancer bone metastasis. A comprehensive study comparing the classification of as received prostate cancer cells in a two-dimensional (2D) model and cancer cells in a 3D bone mimetic environment was performed over various time intervals using principal component analysis (PCA). Our results showed distinctive spectral differences in Raman imaging between prostate cancer cells and the cells cultured in 3D bone mimetic scaffolds, particularly at 1002, 1261, 1444, and 1654 cm-1, which primarily contain proteins and lipids signals. Raman maps capture sub-cellular responses with the progression of tumor cells into metastasis. Raman feature extraction via cluster analysis allows for the identification of specific cellular constituents in the images. For the first time, this work demonstrates a promising potential of Raman imaging, PCA, and cluster analysis to discriminate between cancer cells at different stages of metastatic tumorigenesis.
© 2022. The Author(s).
Conflict of interest statement
The authors declare no competing interests.
Figures


Similar articles
-
In vitro design of mesenchymal to epithelial transition of prostate cancer metastasis using 3D nanoclay bone-mimetic scaffolds.J Tissue Eng Regen Med. 2018 Mar;12(3):727-737. doi: 10.1002/term.2492. Epub 2017 Oct 4. J Tissue Eng Regen Med. 2018. PMID: 28603879
-
More advantages in detecting bone and soft tissue metastases from prostate cancer using 18F-PSMA PET/CT.Hell J Nucl Med. 2019 Jan-Apr;22(1):6-9. doi: 10.1967/s002449910952. Epub 2019 Mar 7. Hell J Nucl Med. 2019. PMID: 30843003
-
Paracrine interactions between LNCaP prostate cancer cells and bioengineered bone in 3D in vitro culture reflect molecular changes during bone metastasis.Bone. 2014 Jun;63:121-31. doi: 10.1016/j.bone.2014.02.001. Epub 2014 Feb 12. Bone. 2014. PMID: 24530694
-
Bone metabolism and new targets for intervention.Curr Urol Rep. 2007 May;8(3):233-8. doi: 10.1007/s11934-007-0011-y. Curr Urol Rep. 2007. PMID: 17459273 Review.
-
Molecular insights into prostate cancer progression: the missing link of tumor microenvironment.J Urol. 2005 Jan;173(1):10-20. doi: 10.1097/01.ju.0000141582.15218.10. J Urol. 2005. PMID: 15592017 Review.
Cited by
-
Label-Free Raman Spectroscopy for Assessing Purity and Maturation of hiPSC-Derived Cardiac Tissue.Anal Chem. 2024 Oct 1;96(39):15765-15772. doi: 10.1021/acs.analchem.4c03871. Epub 2024 Sep 18. Anal Chem. 2024. PMID: 39291743 Free PMC article.
-
Advancements and prospects of Raman spectroscopy in urological tumors: a bibliometric analysis.Lasers Med Sci. 2023 Oct 4;38(1):230. doi: 10.1007/s10103-023-03897-w. Lasers Med Sci. 2023. PMID: 37792103 Review.
-
Practices, Potential, and Perspectives for Detecting Predisease Using Raman Spectroscopy.Int J Mol Sci. 2023 Jul 29;24(15):12170. doi: 10.3390/ijms241512170. Int J Mol Sci. 2023. PMID: 37569541 Free PMC article. Review.
References
-
- Noone AM, et al. SEER Cancer Statistics Review, 1975–2015. National Cancer Institute; 2018.
-
- Kneipp K, et al. Single molecule detection using surface-enhanced Raman scattering (SERS) Phys. Rev. Lett. 1997;78:1667. doi: 10.1103/PhysRevLett.78.1667. - DOI
-
- Das RS, Agrawal YK. Raman spectroscopy: recent advancements, techniques and applications. Vib. Spectrosc. 2011;57:163–176. doi: 10.1016/j.vibspec.2011.08.003. - DOI
Publication types
MeSH terms
Grants and funding
LinkOut - more resources
Full Text Sources
Medical
