. 2022 May 16;12(1):8019.
doi: 10.1038/s41598-022-12112-9.

Muscle contractions and pain sensation accompanying high-frequency electroporation pulses

Affiliations

Muscle contractions and pain sensation accompanying high-frequency electroporation pulses

Aleksandra Cvetkoska et al. Sci Rep. .

Abstract

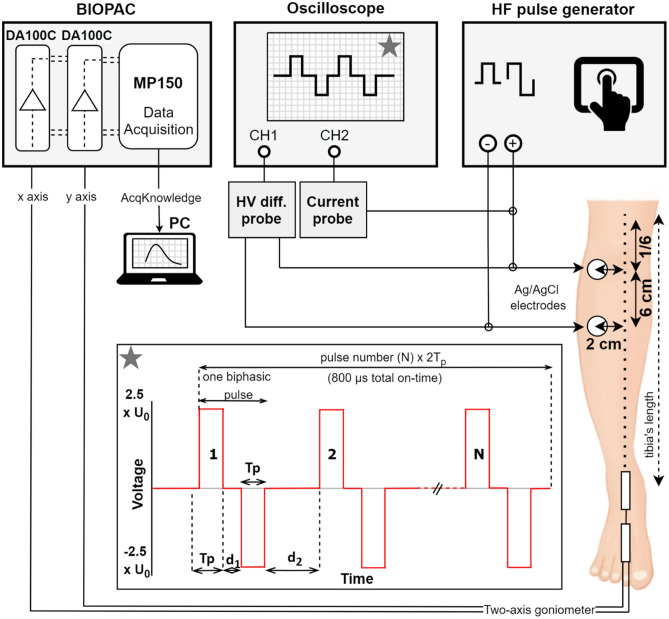
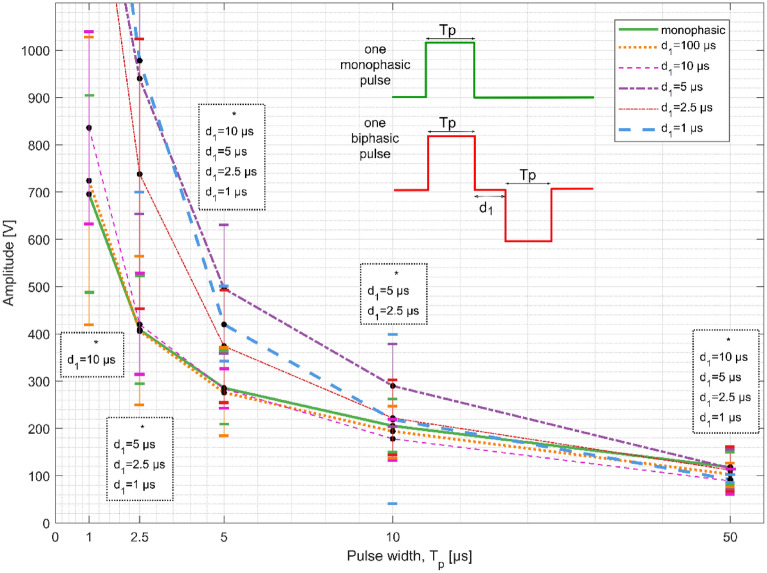
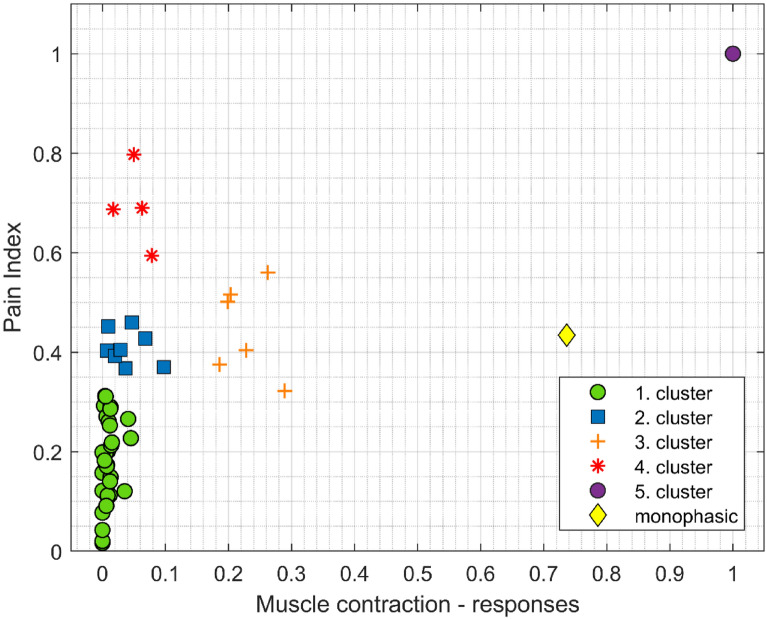
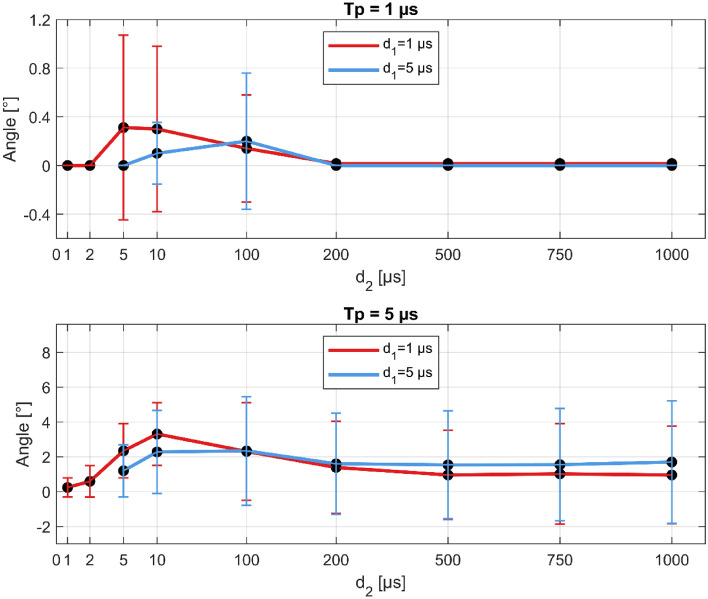
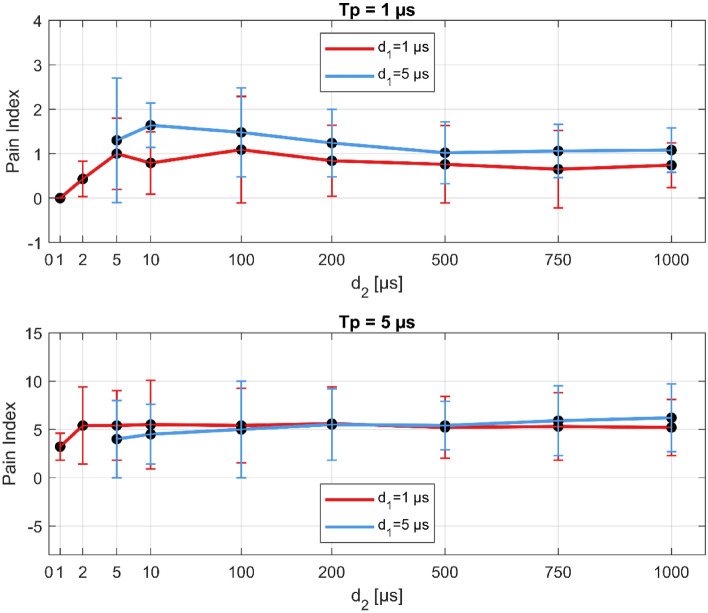
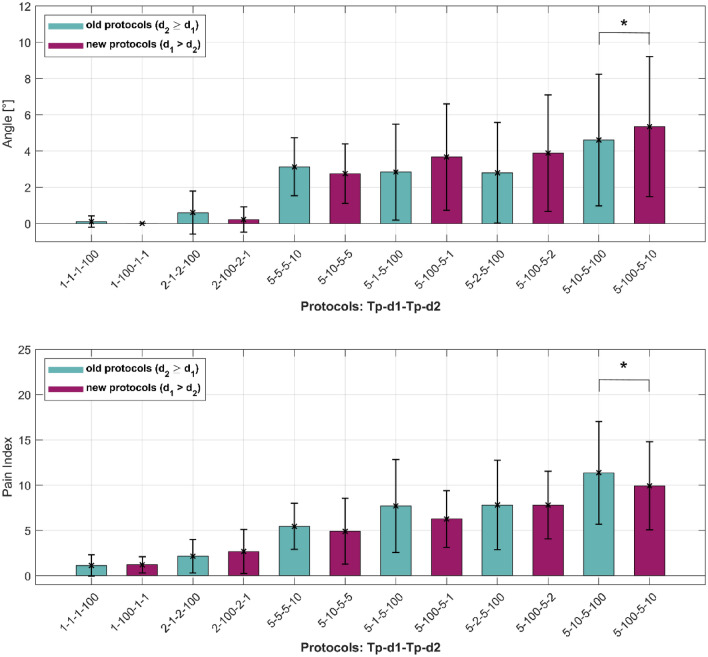
To minimize neuromuscular electrical stimulation during electroporation-based treatments, the replacement of long monophasic pulses with bursts of biphasic high-frequency pulses in the range of microseconds was suggested in order to reduce muscle contraction and pain sensation due to pulse application. This treatment modality appeared under the term high-frequency electroporation (HF-EP), which can be potentially used for some clinical applications of electroporation such as electrochemotherapy, gene electrotransfer, and tissue ablation. In cardiac tissue ablation, which utilizes irreversible electroporation, the treatment is being established as Pulsed Field Ablation. While the reduction of muscle contractions was confirmed in multiple in vivo studies, the reduction of pain sensation in humans was not confirmed yet, nor was the relationship between muscle contraction and pain sensation investigated. This is the first study in humans examining pain sensation using biphasic high-frequency electroporation pulses. Twenty-five healthy individuals were subjected to electrical stimulation of the tibialis anterior muscle with biphasic high-frequency pulses in the range of few microseconds and both, symmetric and asymmetric interphase and interpulse delays. Our results confirm that biphasic high-frequency pulses with a pulse width of 1 or 2 µs reduce muscle contraction and pain sensation as opposed to currently used longer monophasic pulses. In addition, interphase and interpulse delays play a significant role in reducing the muscle contraction and/or pain sensation. The study shows that the range of the optimal pulse parameters may be increased depending on the prerequisites of the therapy. However, further evaluation of the biphasic pulse protocols presented herein is necessary to confirm the efficiency of the newly proposed HF-EP.


Conflict of interest statement

The authors declare no competing interests.

Figures

Figure 1
Figure 1
Experimental setup and electrodes/goniometer placement. Stimulation pulses were delivered via electrodes connected to the HF pulse generator. The electrodes (marked with circles) were placed on the right leg: the upper electrode was placed on 1/6th of the tibia’s length, the lower electrode was placed 6 cm lower. Both electrodes were placed 2 cm right lateral to the bone (left in the figure). The output pulses were monitored on an oscilloscope using high-voltage (HV) differential and current probe. Asterisk: applied pulses—biphasic pulses with 800 μs total on-time. Tp-pulse width (equal for positive and negative phase), d1-interphase delay, d2-interpulse delay, N-number of pulses. The response from the ankle (muscle contraction) was acquired with twin-axis goniometer connected to the Biopac unit. The data was analyzed on a personal computer (PC) using the AcqKnowledge software. DA100C-amplifier, MP150-data acquisition system.
Figure 2
Figure 2
Threshold amplitude as a function of the pulse width for single monophasic (solid green curve) and biphasic pulses (Strength–Duration curves). Biphasic pulses are shown for each interphase delay from 1 µs to 100 µs. The results are shown as mean amplitude of the individuals (black dots) ± standard error (vertical bars). The boxes with asterisks (*) and interphase delays show statistically significant differences between the monophasic pulse and marked interphase delay (biphasic pulse) for each pulse width tested (statistically higher mean values for the biphasic pulses for all pulse widths tested except for Tp = 50 µs). Note that for pulse width of 1 µs, paired t-test was performed only for d1 = 10 µs and 100 µs, as the threshold amplitude was higher than 1000 V for the rest of the interphase delays.
Figure 3
Figure 3
Clustering based on a hierarchical cluster tree (dendrogram). Each mark represents one pulse protocol: x—muscle contraction response, y—pain index. The data shown is normalized based on the purple cluster (Tp = 5 µs, d1 = 100 µs, d2 = 100 µs). Note that the yellow diamond represents the amplitude determining (reference) protocol (8 monophasic pulses × 100 µs, 5 kHz) with 2.5 lower amplitude.
Figure 4
Figure 4
Longer interpulse delays reduce muscle contraction (response angle). Upper figure: 400 × 1 µs pulses, lower figure: 80 × 5 µs pulses. Note different ordinate scales (higher angles for Tp = 5 µs). The results are shown as the mean (black dots) ± standard error (vertical bars). Tp-pulse width, d1-interphase delay, d2-interpulse delay.
Figure 5
Figure 5
Longer interpulse delays slightly increase the pain index for longer pulse widths (lower figure). Upper figure: 400 × 1 µs pulses, lower figure: 80 × 5 µs pulses. Note different ordinate scales (higher pain indexes for Tp = 5 µs). The results are shown as the mean (black dots) ± standard error (vertical bars). Tp-pulse width, d1-interphase delay, d2-interpulse delay.
Figure 6
Figure 6
Interchanged interphase (d1) and interpulse delays (d2). Each bar represents one pulse protocol (Tp-d1-Tp-d2). Turquoise bars are already established biphasic pulse protocols (d2 ≥ d1), purple bars are the biphasic pulse protocols generated when d1 and d2 were interchanged (d1 > d2). The results are shown as the mean value (bar’s height) ± standard error (black vertical bars). The asterisks (*) show statistically significant differences between the pulse protocols (P < 0.05).
Figure 7
Figure 7
Sum of descriptors mean intensity for three chosen descriptors of both type of nerve fibers: A-delta (red bars) and C-fibers (blue bars). The data is shown as the average value (bar’s height) ± standard error (black vertical bars) for all biphasic pulse protocols included in a particular cluster. The asterisks (*) show statistically significant difference between the nerve fibers in the cluster (P < 0.05). Note that the purple cluster is only one pulse protocol cluster, thus the standard error is zero.

Similar articles

Cited by

References

    1. Kotnik T, Rems L, Tarek M, Miklavcic D. Membrane electroporation and electropermeabilization: Mechanisms and models. Annu. Rev. Biophys. 2019;48:63–91. doi: 10.1146/annurev-biophys-052118-115451. - DOI - PubMed
    1. Rubinsky B. Irreversible electroporation in medicine. Technol. Cancer Res. Treat. 2007;6:255–259. doi: 10.1177/153303460700600401. - DOI - PubMed
    1. Aycock KN, Davalos RV. Irreversible electroporation: Background, theory, and review of recent developments in clinical oncology. Bioelectricity. 2019;1:214–234. doi: 10.1089/bioe.2019.0029. - DOI - PMC - PubMed
    1. Batista NT, Polajžer T, Miklavčič D. Cell death due to electroporation–a review. Bioelectrochemistry. 2021;141:1150. - PubMed
    1. Yarmush ML, Golberg A, Serša G, Kotnik T, Miklavčič D. Electroporation-based technologies for medicine: Principles, applications, and challenges. Annu. Rev. Biomed. Eng. 2014;16:295–320. doi: 10.1146/annurev-bioeng-071813-104622. - DOI - PubMed

Publication types