

Zebrafish caudal fin as a model to investigate the role of probiotics in bone regeneration
- PMID: 35577882
- PMCID: PMC9110718
- DOI: 10.1038/s41598-022-12138-z
Zebrafish caudal fin as a model to investigate the role of probiotics in bone regeneration
Abstract
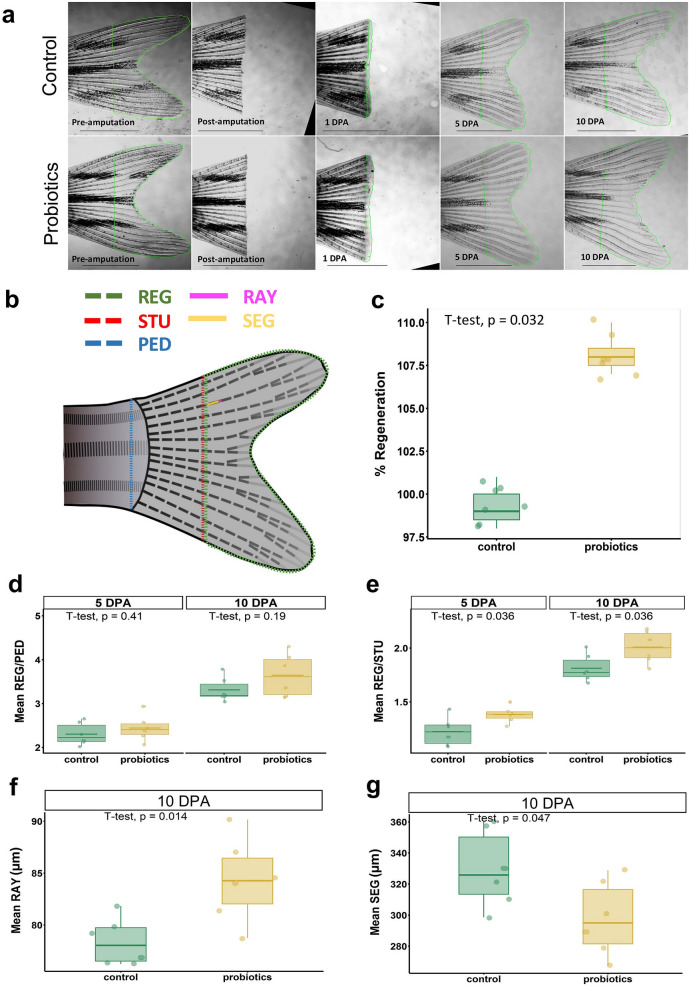
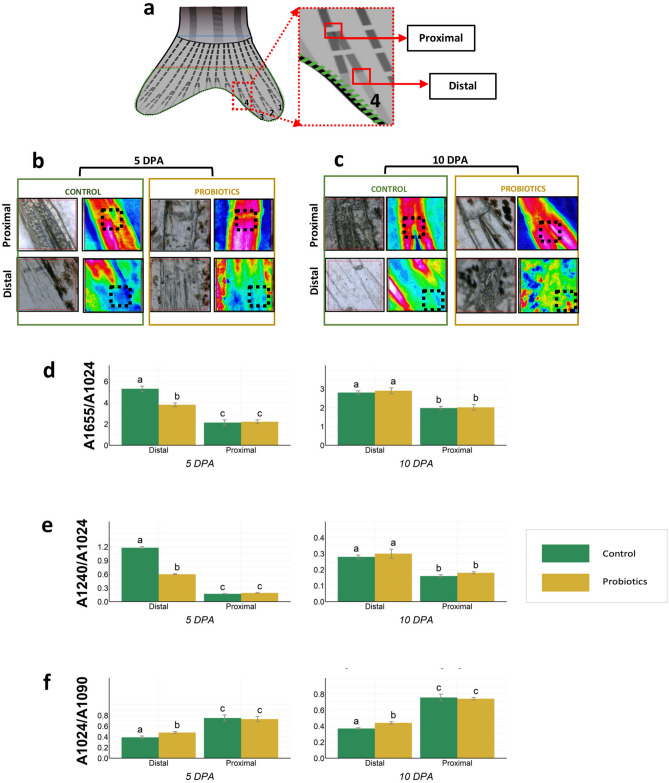
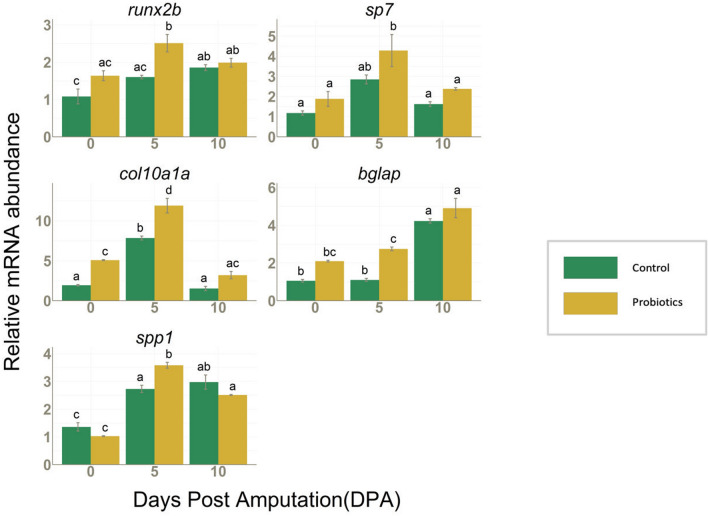
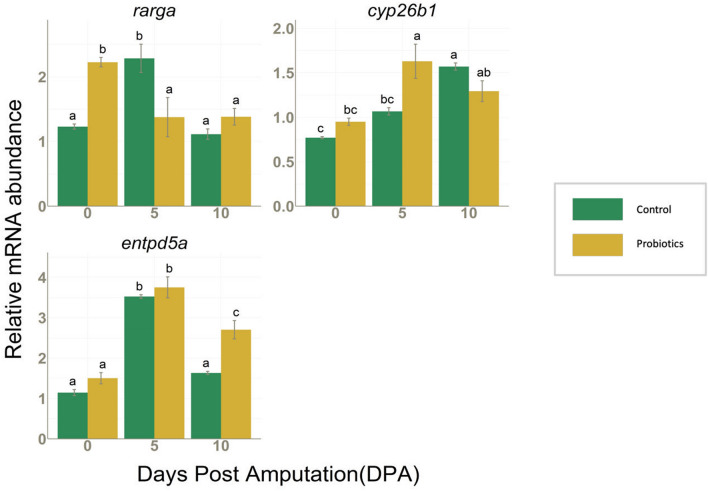
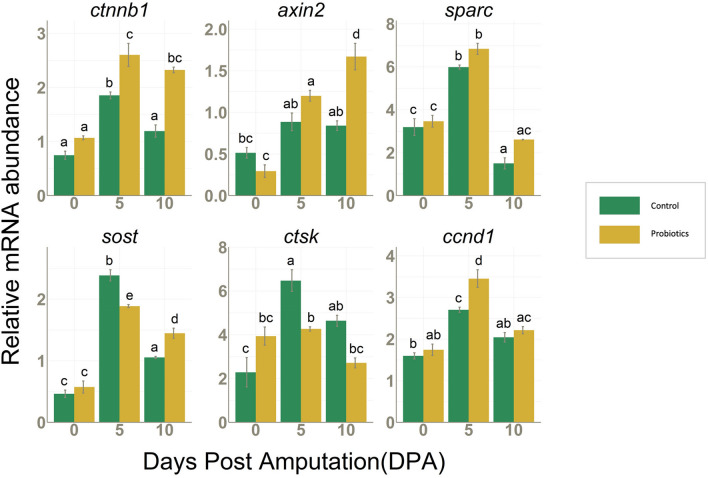
Probiotics are live microorganisms that confer several beneficial effects to the host, including enhancement of bone mineralization. However, probiotic action on bone regeneration is not well studied and therefore we analysed various effects of probiotic treatment on the caudal fin regeneration of zebrafish. Morphological analysis revealed an increased regenerated area with shorter and thicker lepidotrichia segments after probiotic treatment. Fourier transform infrared spectroscopy imaging analysis highlighted the distribution of phosphate groups in the regenerated fins and probiotic group showed higher amounts of well-crystallized hydroxyapatite. At the midpoint (5 days post amputation) of regeneration, probiotics were able to modulate various stages of osteoblast differentiation as confirmed by the upregulation of some key marker genes such as runx2b, sp7, col10a1a, spp1 and bglap, besides suppressing osteoclast activity as evidenced from the downregulation of ctsk. Probiotics also caused an enhanced cell cycle by regulating the expression of genes involved in Retinoic acid (rarga, cyp26b1) and Wnt/β-catenin (ctnnb1, ccnd1, axin2, sost) signaling pathways, and also modulated phosphate homeostasis by increasing the entpd5a levels. These findings provide new outlooks for the use of probiotics as a prophylactic treatment in accelerating bone regeneration and improving skeletal health in both aquaculture and biomedical fields.
© 2022. The Author(s).
Conflict of interest statement
The authors declare no competing interests.
Figures
Similar articles
-
Osteoblast de- and redifferentiation are controlled by a dynamic response to retinoic acid during zebrafish fin regeneration.Development. 2015 Sep 1;142(17):2894-903. doi: 10.1242/dev.120204. Epub 2015 Aug 7. Development. 2015. PMID: 26253409
-
The Regulatory Role of miRNAs in Zebrafish Fin Regeneration.Int J Mol Sci. 2024 Sep 30;25(19):10542. doi: 10.3390/ijms251910542. Int J Mol Sci. 2024. PMID: 39408869 Free PMC article.
-
The regenerative capacity of the zebrafish caudal fin is not affected by repeated amputations.PLoS One. 2011;6(7):e22820. doi: 10.1371/journal.pone.0022820. Epub 2011 Jul 28. PLoS One. 2011. PMID: 21829525 Free PMC article.
-
Signaling networks organizing regenerative growth of the zebrafish fin.Trends Genet. 2015 Jun;31(6):336-43. doi: 10.1016/j.tig.2015.03.012. Epub 2015 Apr 27. Trends Genet. 2015. PMID: 25929514 Review.
-
Zebrafish (Danio rerio) as a Model for Understanding the Process of Caudal Fin Regeneration.Zebrafish. 2020 Dec;17(6):359-372. doi: 10.1089/zeb.2020.1926. Epub 2020 Dec 1. Zebrafish. 2020. PMID: 33259770 Review.
Cited by
-
First In Vivo Insights on the Effects of Tempol-Methoxycinnamate, a New UV Filter, as Alternative to Octyl Methoxycinnamate, on Zebrafish Early Development.Int J Mol Sci. 2023 Apr 5;24(7):6767. doi: 10.3390/ijms24076767. Int J Mol Sci. 2023. PMID: 37047738 Free PMC article.
-
Sustainable Ornamental Fish Aquaculture: The Implication of Microbial Feed Additives.Animals (Basel). 2023 May 9;13(10):1583. doi: 10.3390/ani13101583. Animals (Basel). 2023. PMID: 37238012 Free PMC article. Review.
-
Bacillus subtilis Modulated the Expression of Osteogenic Markers in a Human Osteoblast Cell Line.Cells. 2023 Jan 19;12(3):364. doi: 10.3390/cells12030364. Cells. 2023. PMID: 36766709 Free PMC article.
-
The Potential Value of Probiotics after Dental Implant Placement.Microorganisms. 2023 Jul 20;11(7):1845. doi: 10.3390/microorganisms11071845. Microorganisms. 2023. PMID: 37513016 Free PMC article. Review.
-
Deciphering molecular heterogeneity and dynamics of human hippocampal neural stem cells at different ages and injury states.Elife. 2024 Apr 12;12:RP89507. doi: 10.7554/eLife.89507. Elife. 2024. PMID: 38607670 Free PMC article.
References
-
- Abdelqader A, Irshaid R, Al-Fataftah A-R. Effects of dietary probiotic inclusion on performance, eggshell quality, cecal microflora composition, and tibia traits of laying hens in the late phase of production. Trop. Anim. Health. Prod. 2013;45:1017–1024. doi: 10.1007/s11250-012-0326-7. - DOI - PubMed
Publication types
MeSH terms
Substances
Grants and funding
LinkOut - more resources
Full Text Sources
Molecular Biology Databases
Research Materials
Miscellaneous
