. 2022 May 16;12(1):8020.
doi: 10.1038/s41598-022-11620-y.

Inducing respiratory complex I impairment elicits an increase in PGC1α in ovarian cancer

Affiliations

Inducing respiratory complex I impairment elicits an increase in PGC1α in ovarian cancer

Monica De Luise et al. Sci Rep. .

Abstract

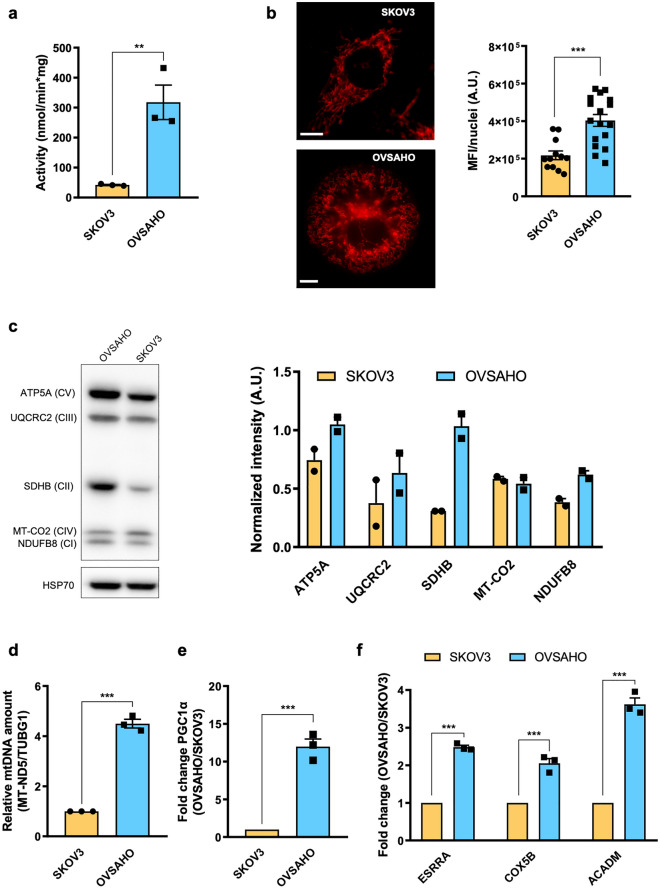
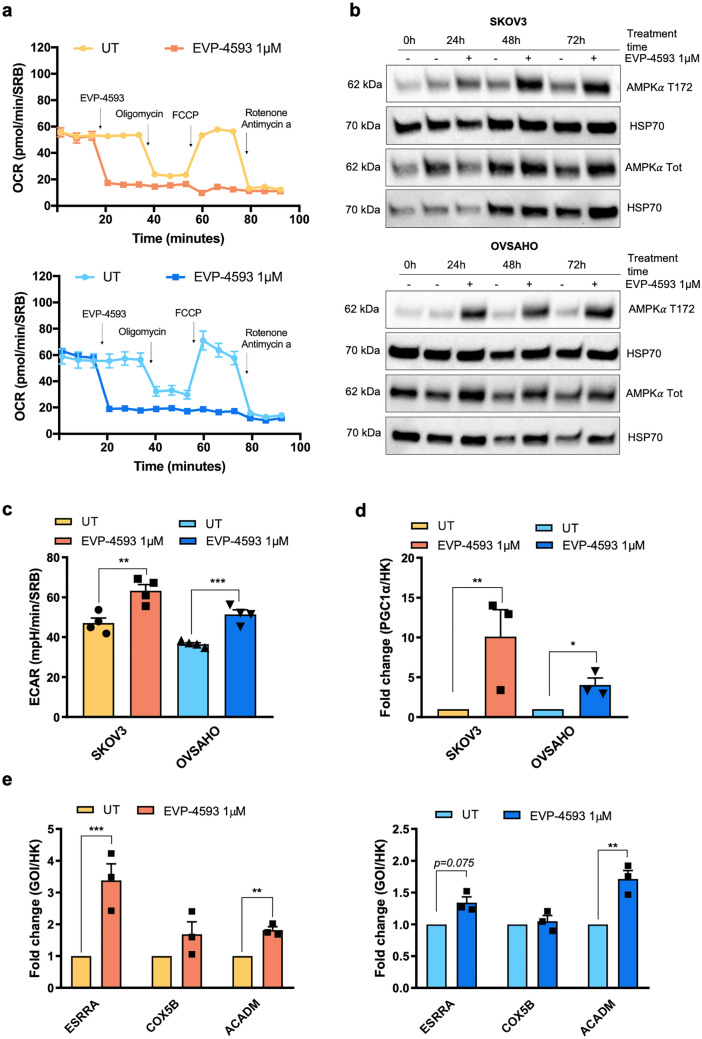
Anticancer strategies aimed at inhibiting Complex I of the mitochondrial respiratory chain are increasingly being attempted in solid tumors, as functional oxidative phosphorylation is vital for cancer cells. Using ovarian cancer as a model, we show that a compensatory response to an energy crisis induced by Complex I genetic ablation or pharmacological inhibition is an increase in the mitochondrial biogenesis master regulator PGC1α, a pleiotropic coactivator of transcription regulating diverse biological processes within the cell. We associate this compensatory response to the increase in PGC1α target gene expression, setting the basis for the comprehension of the molecular pathways triggered by Complex I inhibition that may need attention as drawbacks before these approaches are implemented in ovarian cancer care.


Conflict of interest statement

The authors declare no competing interests.

Figures

Figure 1
Figure 1
Bioenergetic characterization of high- and low-OXPHOS OC cells. (a) Oxygen consumption rate (OCR) profile of SKOV3 (n = 4) and OVSAHO (n = 3) cells determined upon injection of 1 µM oligomycin, 0.5 µM FCCP, 1 µM rotenone and 1 µM antimycin A in Seahorse XFe medium. FCCP concentration was previously determined by titration. Data (mean ± SEM) are normalized on SRB absorbance. (b) Basal respiration, (c) maximal OCR and (d) spare respiratory capacity of SKOV3 (n = 4) and OVSAHO (n = 3) cells. (e) Extracellular acidification rate (ECAR) measured under basal conditions. Data (mean ± SEM) are normalized on SRB absorbance. (f) Total ATP and (g) proportion of mitochondrial ATP (mitoATP) vs glycolytic ATP (glycoATP) production rate in SKOV3 (n = 4) and OVSAHO (n = 3) cells measured using Seahorse. Data (mean ± SEM) are normalized to SRB absorbance and the mito/glycoATP ratio is expressed as a percentage of total ATP. (h) Spectrophotometric measurement of respiratory complexes activity in SKOV3 (n = 3) and OVSAHO (n = 3) cells. Data (mean ± SEM) are normalized on protein content.
Figure 2
Figure 2
Differential mitochondrial abundance and PGC1⍺ expression in high- and low-OXPHOS OC cells. (a) Spectrophotometric measurement of citrate synthase (CS) activity in SKOV3 (n = 3) and OVSAHO (n = 3) cells. Data (mean ± SEM) are normalized on protein content. (b) Mitochondrial network evaluated by MitoTracker Red staining in SKOV3 and OVSAHO cells. Representative images are shown. Scale bar represents 10 µm. Mean Fluorescence Intensity (MFI) data (mean ± SEM) were normalized on nuclei number. Original figures are presented in Supplementary Fig. 2a. (c) Western blotting analysis of five OXPHOS complex subunits (one for each complex) in SKOV3 (n = 2) and OVSAHO (n = 2) cells. HSP70 was used as loading control. Band intensity was quantified by densitometry. Unnecessary lanes were cropped, and full-length blots are presented in Supplementary Fig. 2b. (d) Relative mtDNA amount evaluated by qPCR in SKOV3 (n = 3) and OVSAHO (n = 3) cells. ΔCT = CT (SKOV3)-CT (OVSAHO). Data (mean ± SEM) are expressed as fold change. Relative amount of mitochondrial MT-ND5 was normalized to TUBG1. (e) Gene expression of total PGC1α evaluated by qRT–PCR in SKOV3 (n = 3) and OVSAHO (n = 3) cells. ΔCT = CT (SKOV3)-CT (OVSAHO). Data were normalized to the quantity of retrotranscribed total mRNA. (f) Gene expression of total ESRRA, COX5B and MCAD in SKOV3 and OVSAHO cells (n = 3). Data are expressed as fold change and represented as the mean ± SEM. GOI (gene of interest); relative expression levels of GOI were normalized to ACTB expression for ESRRA and MCAD and GUSB for COX5B.
Figure 3
Figure 3
PGC1α expression increases in CI-null OC cell lines upon glucose restriction. (a) NDUFS3 western blotting analysis of mitochondrial-enriched fractions from SKOV3+/+, SKOV3−/−, OVSAHO+/+ and OVSAHO−/− cell lines separated by SDS–PAGE. HSP60 was used as loading control. Unnecessary lanes were cropped. Full-length blots are presented in Supplementary Fig. 3a,b (b) CI in-gel activity (CI-IGA) of mitochondrial enriched fractions from SKOV3+/+, SKOV3−/−, OVSAHO+/+ and OVSAHO−/− samples solubilized with DDM and separated by BN-PAGE. Unnecessary lanes were cropped. Full-length gels are presented in Supplementary Fig. 3c. (c) Oxygen consumption rate (OCR) profile of SKOV3+/+ (n = 4), SKOV3−/− (n = 4), OVSAHO+/+ (n = 3) and OVSAHO−/− (n = 3) cells determined upon injection of 1 µM oligomycin, 0.5 µM FCCP, 1 µM rotenone and 1 µM antimycin A in specific Seahorse XFe medium. FCCP concentration was determined by titration. Data (mean ± SEM) are normalized on SRB absorbance. (d) Extracellular acidification rate (ECAR) measured under basal conditions of SKOV3+/+ (n = 4), SKOV3−/− (n = 4), OVSAHO+/+ (n = 3) and OVSAHO−/− (n = 3) cells. Data (mean ± SEM) are normalized on SRB absorbance. (e) PGC1α expression in SKOV3+/+ (n = 3), SKOV3−/− (n = 3), OVSAHO+/+ (n = 3) and OVSAHO−/− (n = 3) cells grown in 25 mM (HG) or 5 mM (LG) glucose for 24 h. Data are expressed as fold change and normalized to relative PGC1α levels in NDUFS3+/+ models grown in HG. (f) Western blotting analysis of phosphorylated (T172) and total AMPKα levels on SKOV3+/+, SKOV3−/−, OVSAHO+/+ and OVSAHO−/− cellular lysates under 25 mM (HG) and 5 mM (LG) glucose growth conditions. HSP70 was used as loading control. The dotted line indicates non-contiguous lanes deriving from the same gel and exposure. Full-length blots are presented in Supplementary Fig. 4a,b. The intensity of each band was quantified by densitometry and data (mean ± SEM) were expressed as fold of phosphorylated (T172) to total AMPKα (Supplementary Fig. 1a). (g) Gene expression of total ESRRA, COX5B and ACADM evaluated by qRT–PCR in SKOV3 and OVSAHO cells grown in LG for 24 h (n = 3). Data are expressed as fold change and represented as the mean ± SEM. GOI (gene of interest); HK (housekeeping gene); relative expression levels of GOIs are calculated on ACTB expression for ESRRA and ACADM and GUSB for COX5B. (h) Relative mtDNA amount evaluated by qPCR in SKOV3+/+, SKOV3−/−, OVSAHO+/+ and OVSAHO−/− cells grown in HG or LG for 24 h (n = 3). ΔCT = CT (LG)-CT (HG). Data (mean ± SEM) are expressed as fold change. Relative amount of mitochondrial MT-ND5 was normalized to TUBG1.
Figure 4
Figure 4
CI inhibition recapitulates the compensatory PGC1α upregulation under energetic crisis found in CI-null models. (a) Oxygen consumption rate (OCR) profile of SKOV3 (n = 2) cells determined upon injection of 1 µM EVP-4593, 1 µM oligomycin, 0.5 µM FCCP, 1 µM rotenone and 1 µM antimycin A in 5 mM glucose (LG) Seahorse XFe medium. FCCP concentration was determined by titration. Untreated (UT) samples received the injection of EVP-4593 solvent DMSO. Data (mean ± SEM) are normalized on SRB absorbance. (b) Western blotting analysis of phosphorylated (T172) and total AMPKα levels in lysates from SKOV3 and OVSAHO cells untreated and treated with 1 µM EVP-4593 at different time points and cultured in LG. HSP70 was used as loading control. Full-length blots are presented in Supplementary Fig. 5a,b. Densitometric analysis is shown in Supplementary Fig. 1c. (c) Extracellular acidification rate (ECAR) measured in LG and upon treatment with 1 µM EVP-4593 in SKOV3 and OVSAHO cells (n = 4). Data (mean ± SEM) are normalized on SRB absorbance. (d) Gene expression of total PGC1α in SKOV3 and OVSAHO cells treated with 1 µM EVP-4593 (n = 3) cultured in LG. (e) Gene expression of ESRRA, COX5B and ACADM in SKOV3 and OVSAHO cells after treatment with 1 µM EVP-4593 (n = 3). Cells were cultured in LG. Data are expressed as fold change and represented as the mean ± SEM. GOI (gene of interest); HK (housekeeping gene); relative expression levels of GOIs are calculated on ACTB expression for ESRRA and ACADM and GUSB for COX5B.

References

    1. Ashton TM, McKenna WG, Kunz-Schughart LA, Higgins GS. Oxidative phosphorylation as an emerging target in cancer therapy. Clin. Cancer Res. 2018;24:2482–2490. doi: 10.1158/1078-0432.CCR-17-3070. - DOI - PubMed
    1. Liu Y, Shi Y. Mitochondria as a target in cancer treatment. Med. Commun. 2020;1:129–139. - PMC - PubMed
    1. Vaupel P, Multhoff G. Revisiting the Warburg effect: Historical dogma versus current understanding. J. Physiol. 2021;599:1745–1757. doi: 10.1113/JP278810. - DOI - PubMed
    1. Brown JR, Chan DK, Shank JJ, Griffith KA, Fan H, Szulawski R, Yang K, Reynolds RK, Johnston C, McLean K, Uppal S, Liu JR, Cabrera L, Taylor SE, Orr BC, Modugno F, Mehta P, Bregenzer M, Mehta G, Shen H, Coffman L, Buckanovich RJ. Phase II clinical trial of metformin as a cancer stem cell-targeting agent in ovarian cancer. JCI Insight. 2020;5:e133247. doi: 10.1172/jci.insight.133247. - DOI - PMC - PubMed
    1. Molina JR, Sun Y, Protopopova M, Gera S, Bandi M, Bristow C, McAfoos T, Morlacchi P, Ackroyd J, Agip A-NA, Al-Atrash G, Asara J, Bardenhagen J, Carrillo CC, Carroll C, Chang E, Ciurea S, Cross JB, Czako B, Deem A, Daver N, de Groot JF, Dong J-W, Feng N, Gao G, Gay J, Do MG, Greer J, Giuliani V, Han J, Han L, Henry VK, Hirst J, Huang S, Jiang Y, Kang Z, Khor T, Konoplev S, Lin Y-H, Liu G, Lodi A, Lofton T, Ma H, Mahendra M, Matre P, Mullinax R, Peoples M, Petrocchi A, Rodriguez-Canale J, Serreli R, Shi T, Smith M, Tabe Y, Theroff J, Tiziani S, Xu Q, Zhang Q, Muller F, DePinho RA, Toniatti C, Draetta GF, Heffernan TP, Konopleva M, Jones P, Di Francesco ME, Marszalek JR. An inhibitor of oxidative phosphorylation exploits cancer vulnerability. Nature Medicine. 2018;24(7):1036–1046. doi: 10.1038/s41591-018-0052-4. - DOI - PubMed

Publication types

MeSH terms

Substances