. 2022 May;19(5):567-575.
doi: 10.1038/s41592-022-01459-6. Epub 2022 May 16.

Alignment and integration of spatial transcriptomics data

Affiliations

Alignment and integration of spatial transcriptomics data

Ron Zeira et al. Nat Methods. 2022 May.

Abstract

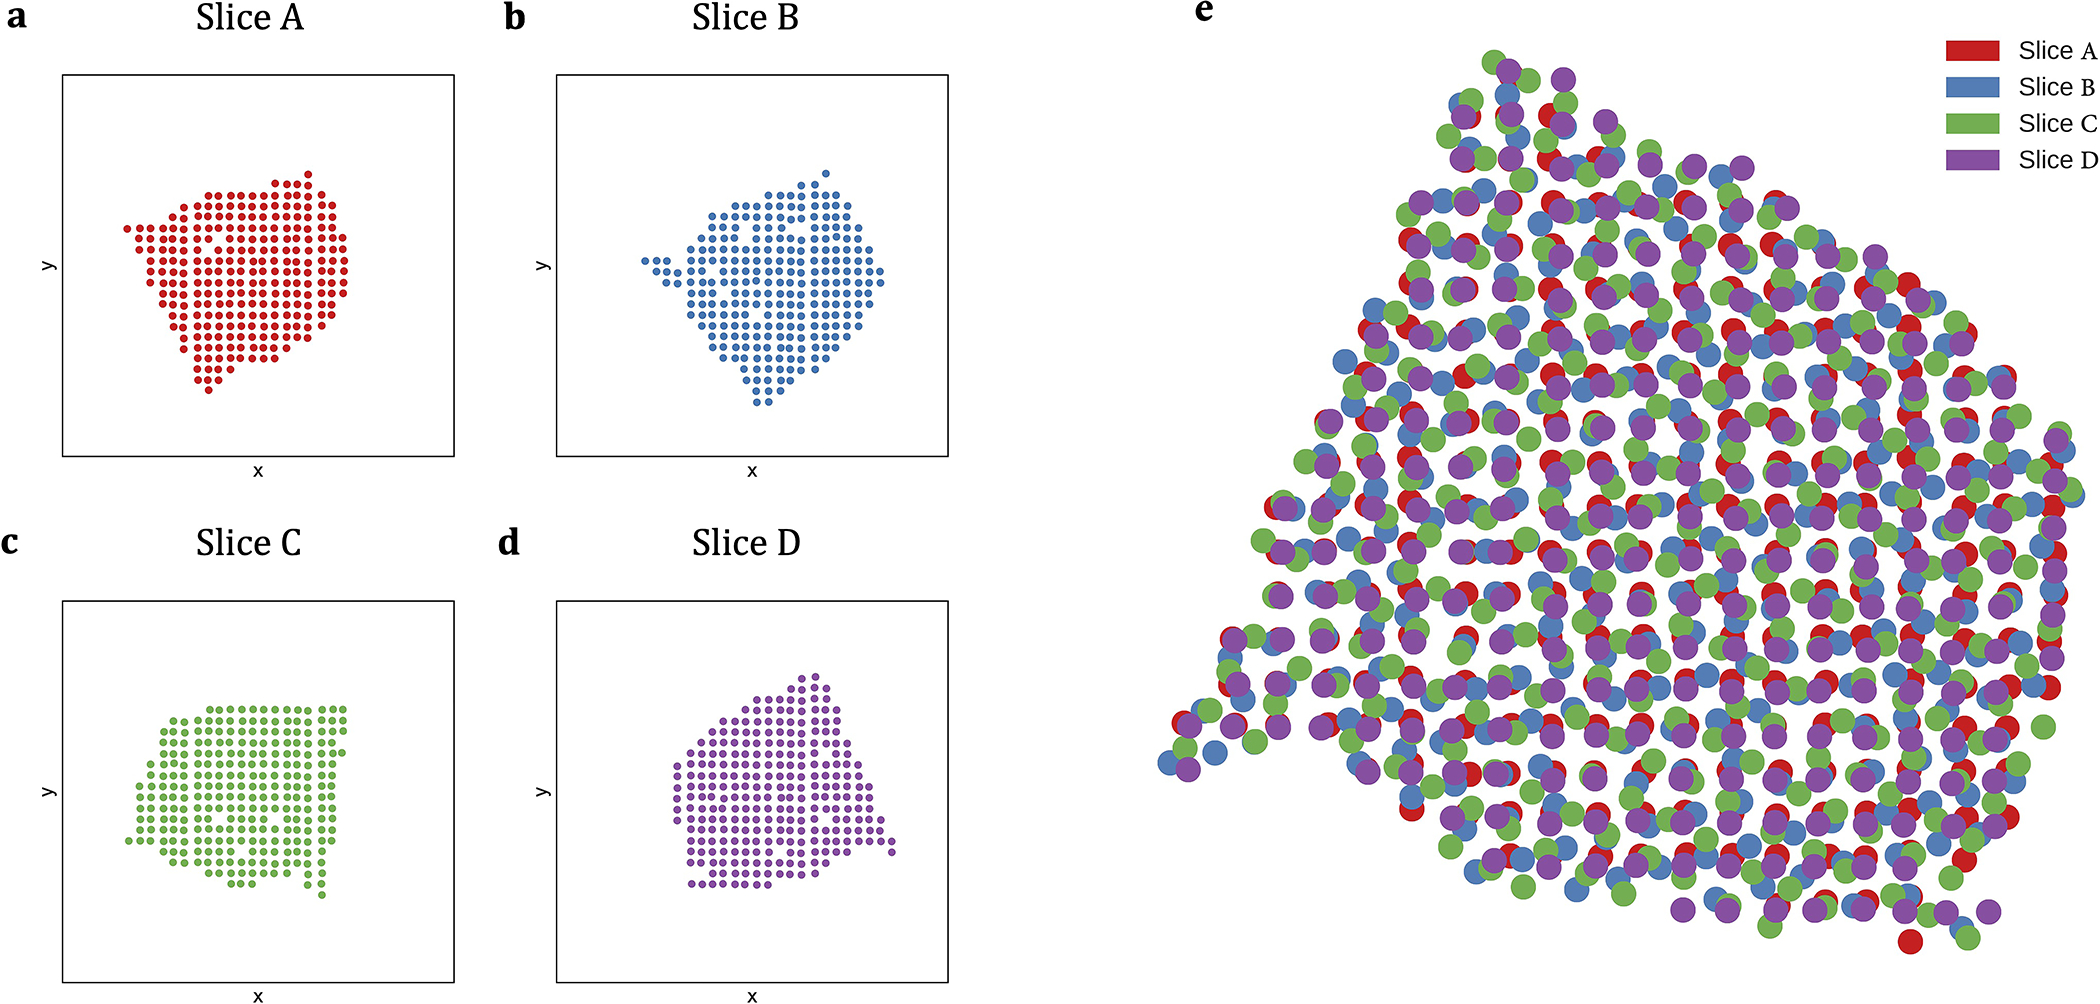
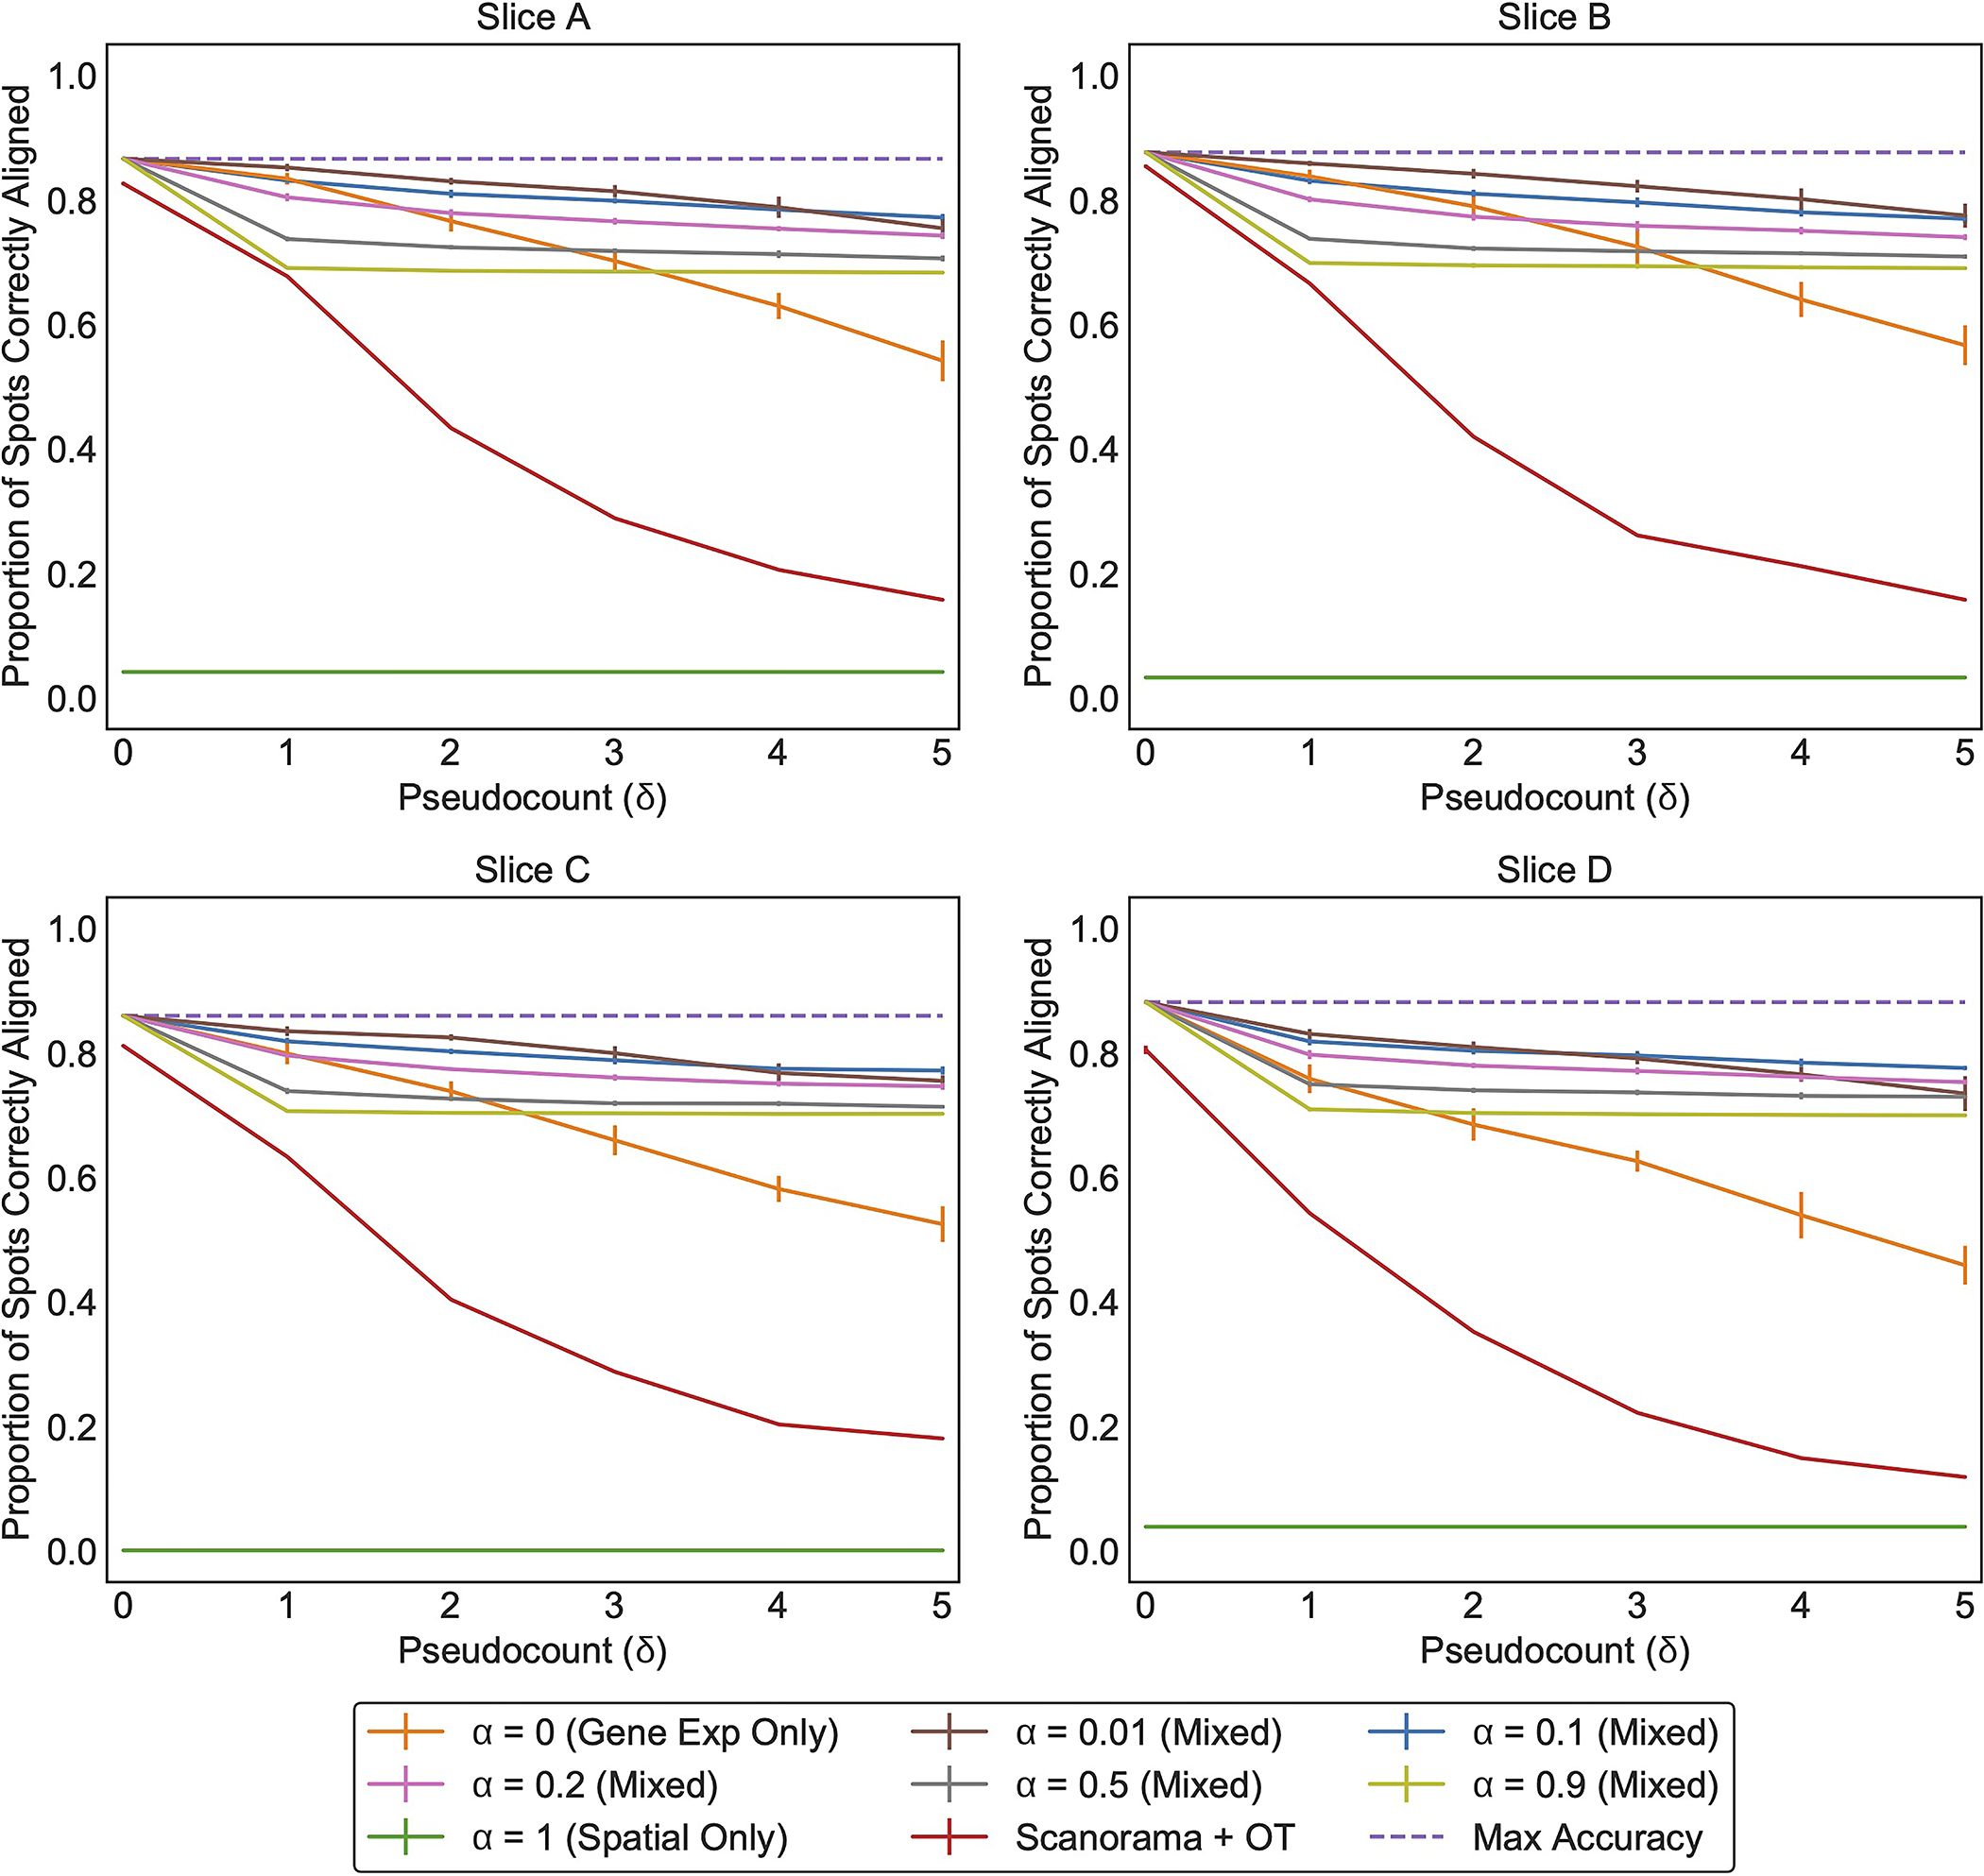
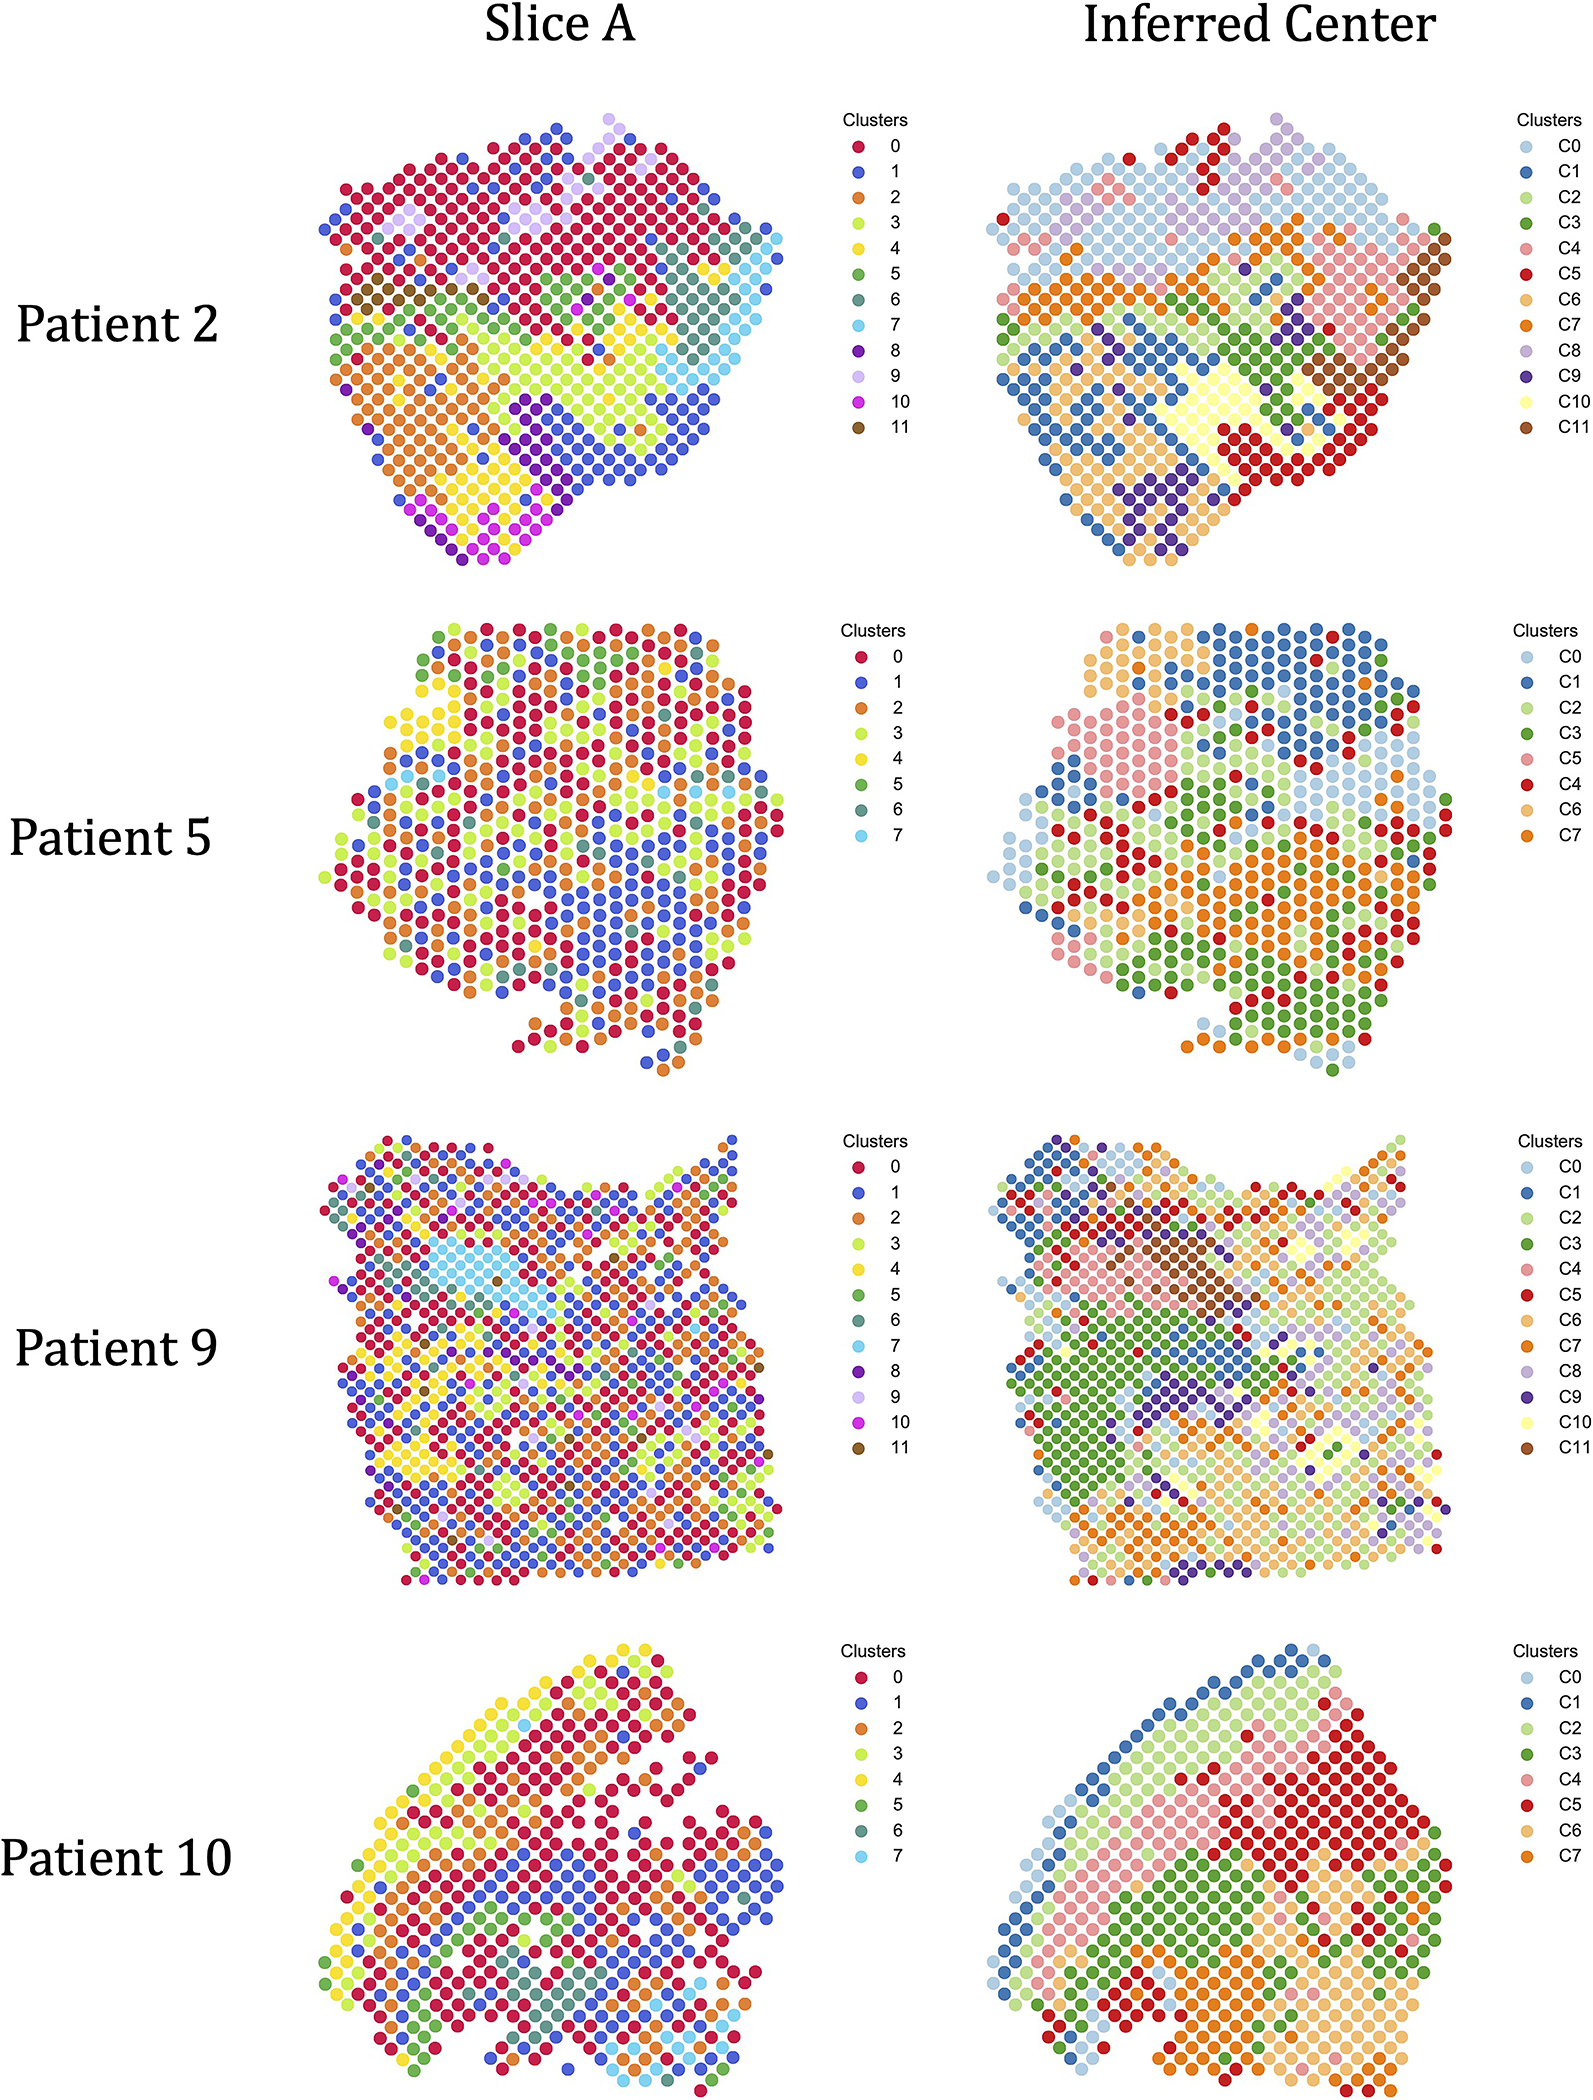
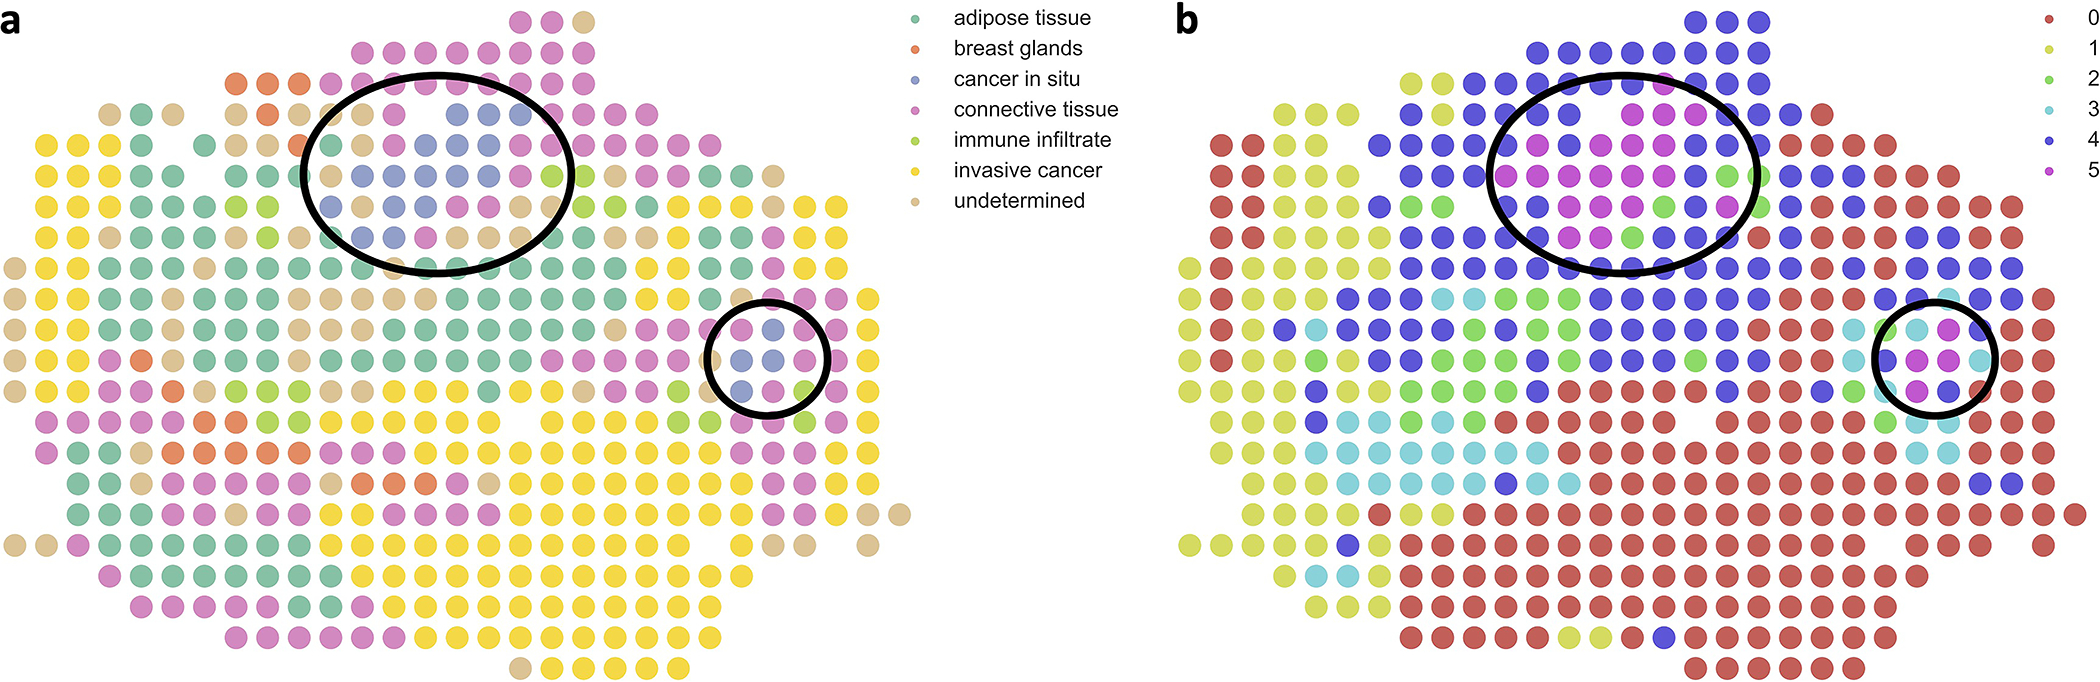
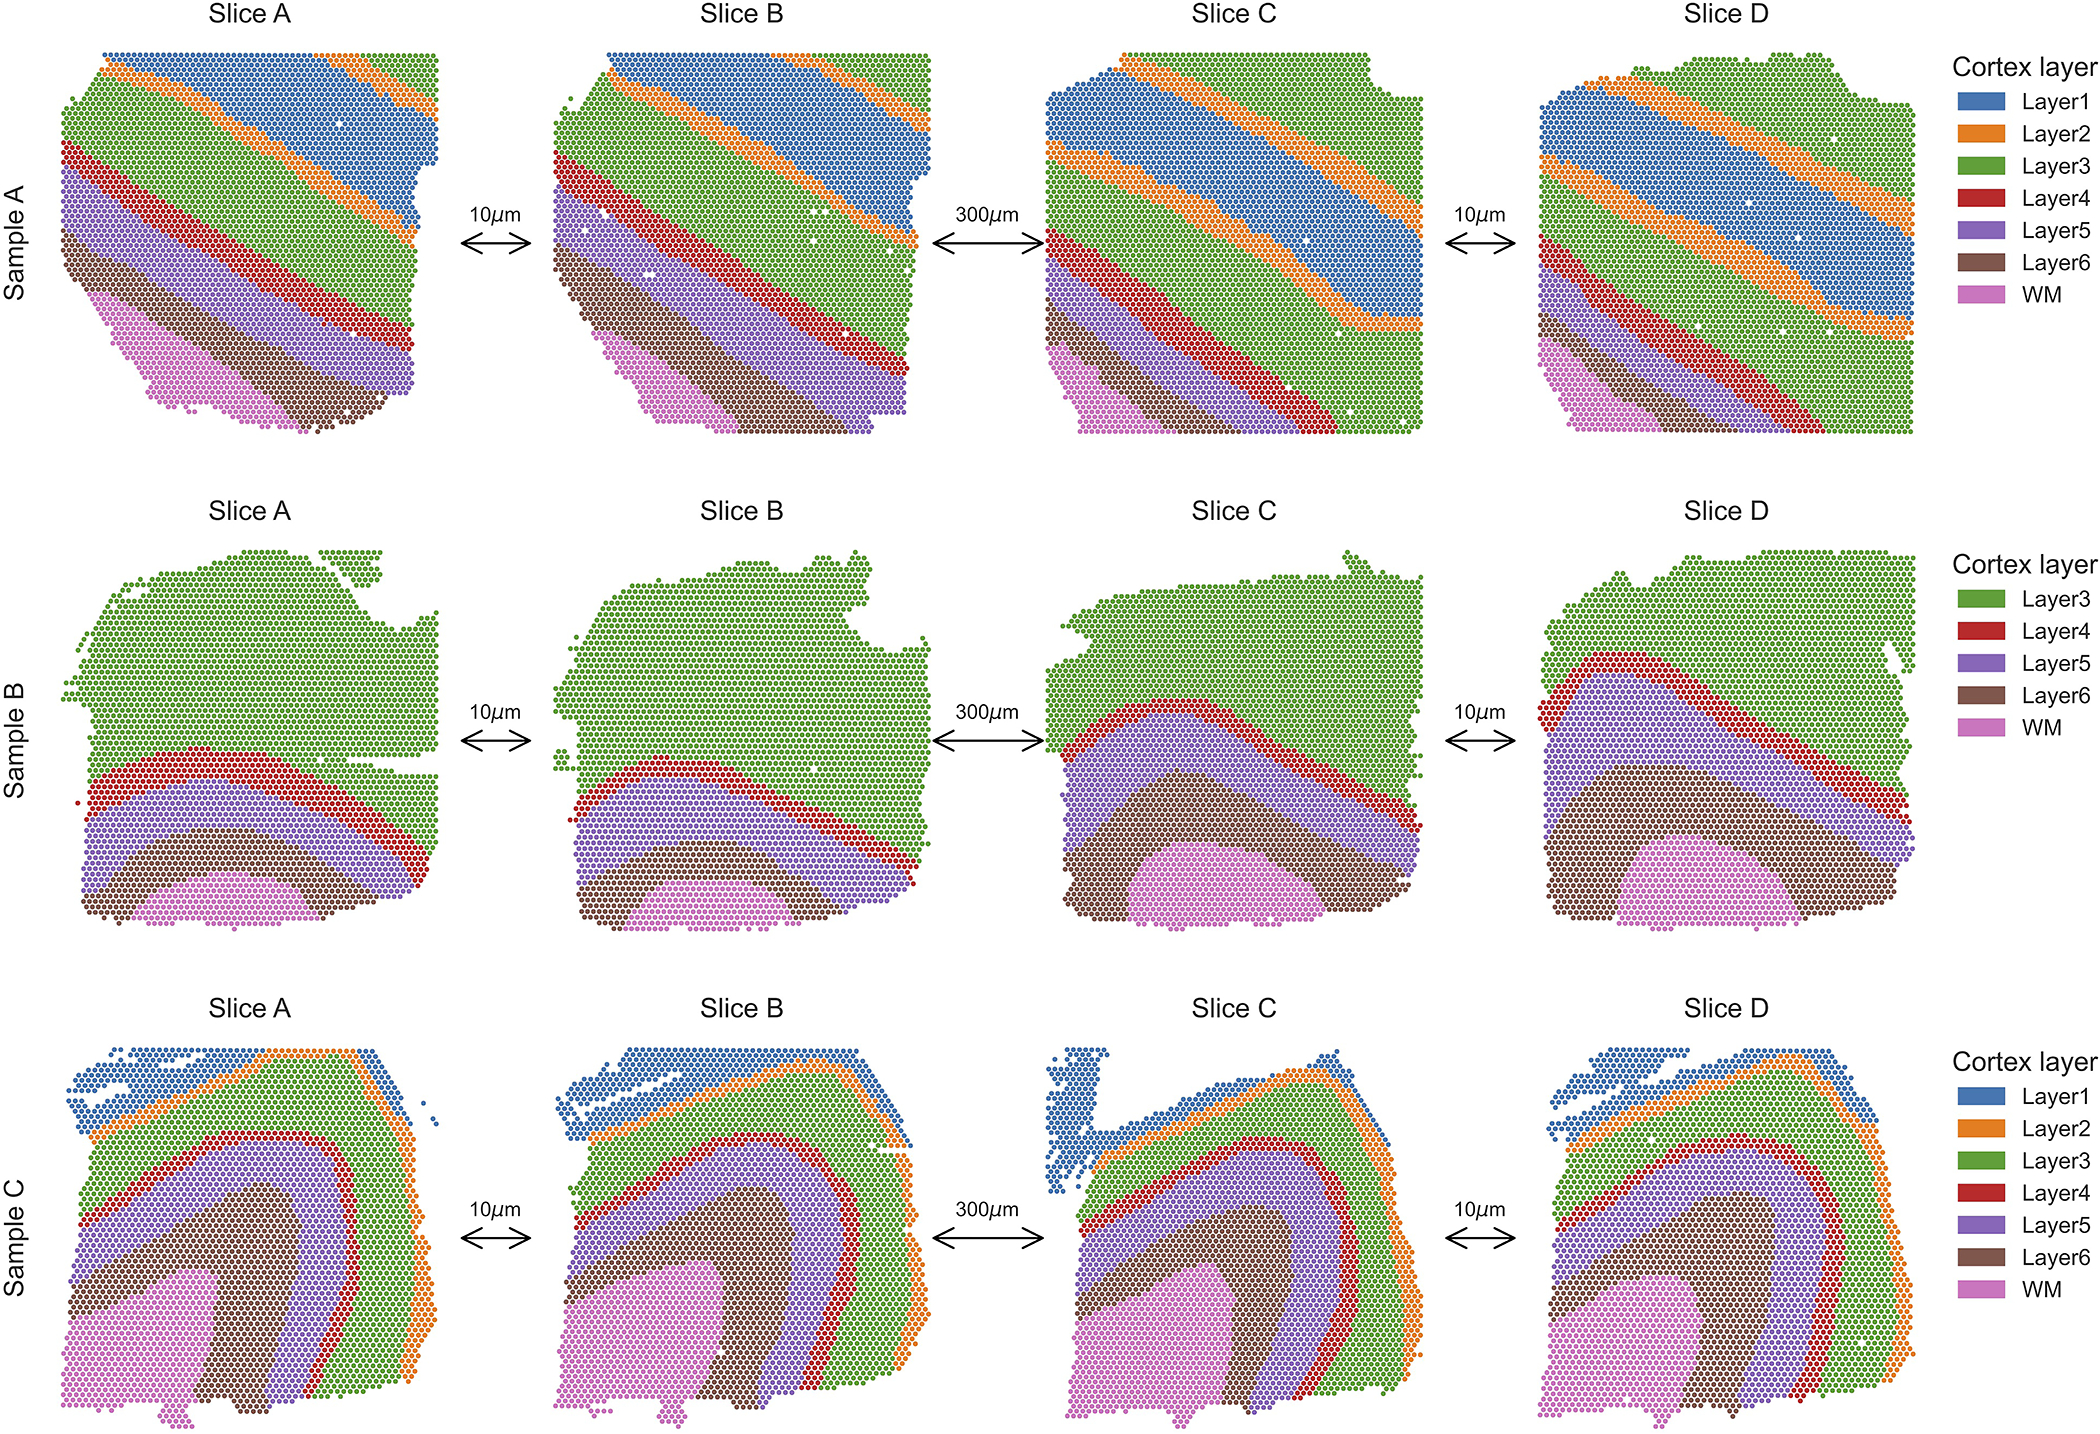
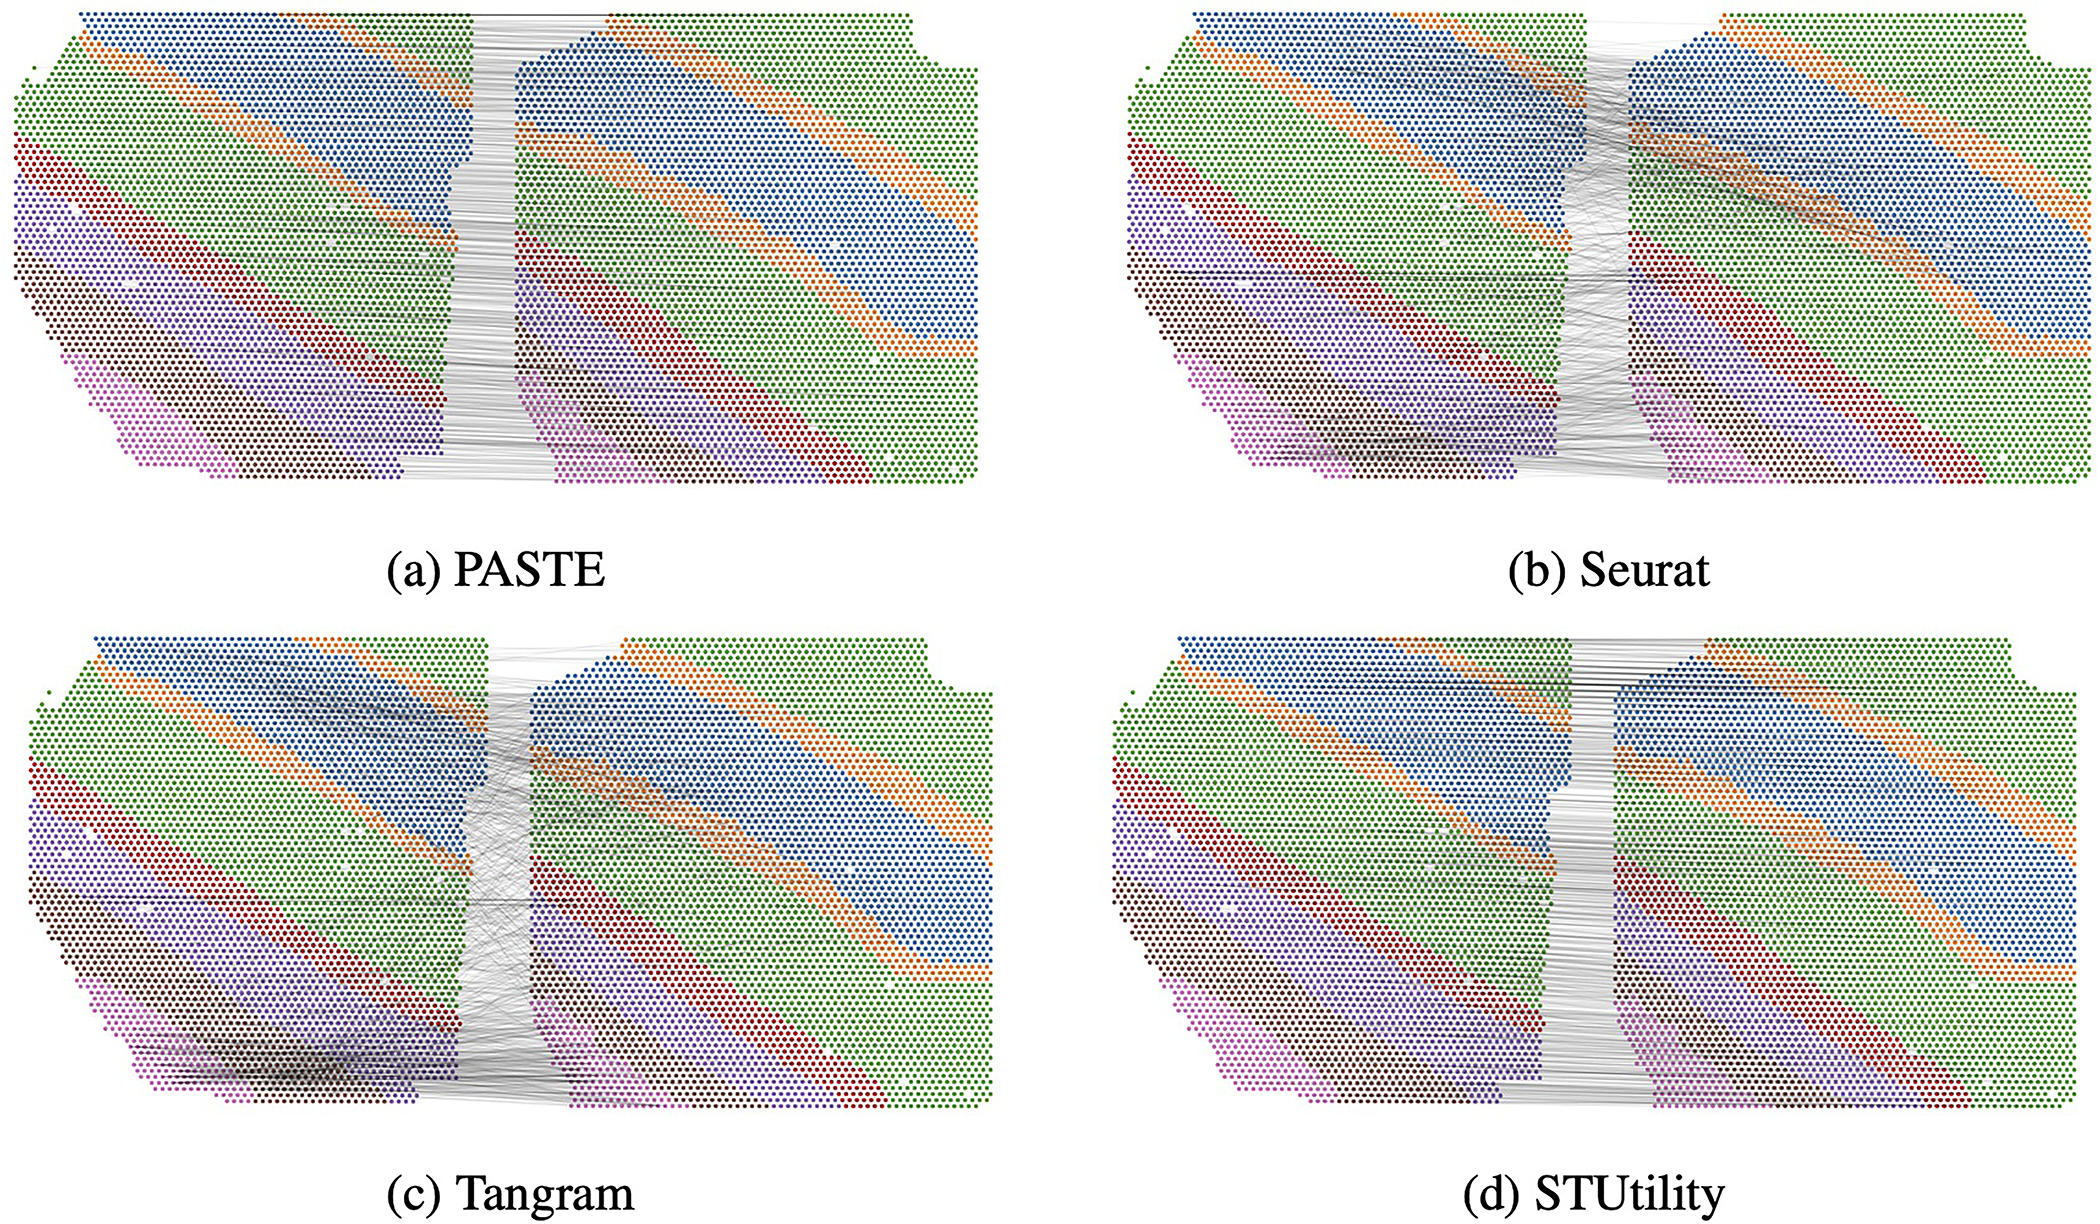
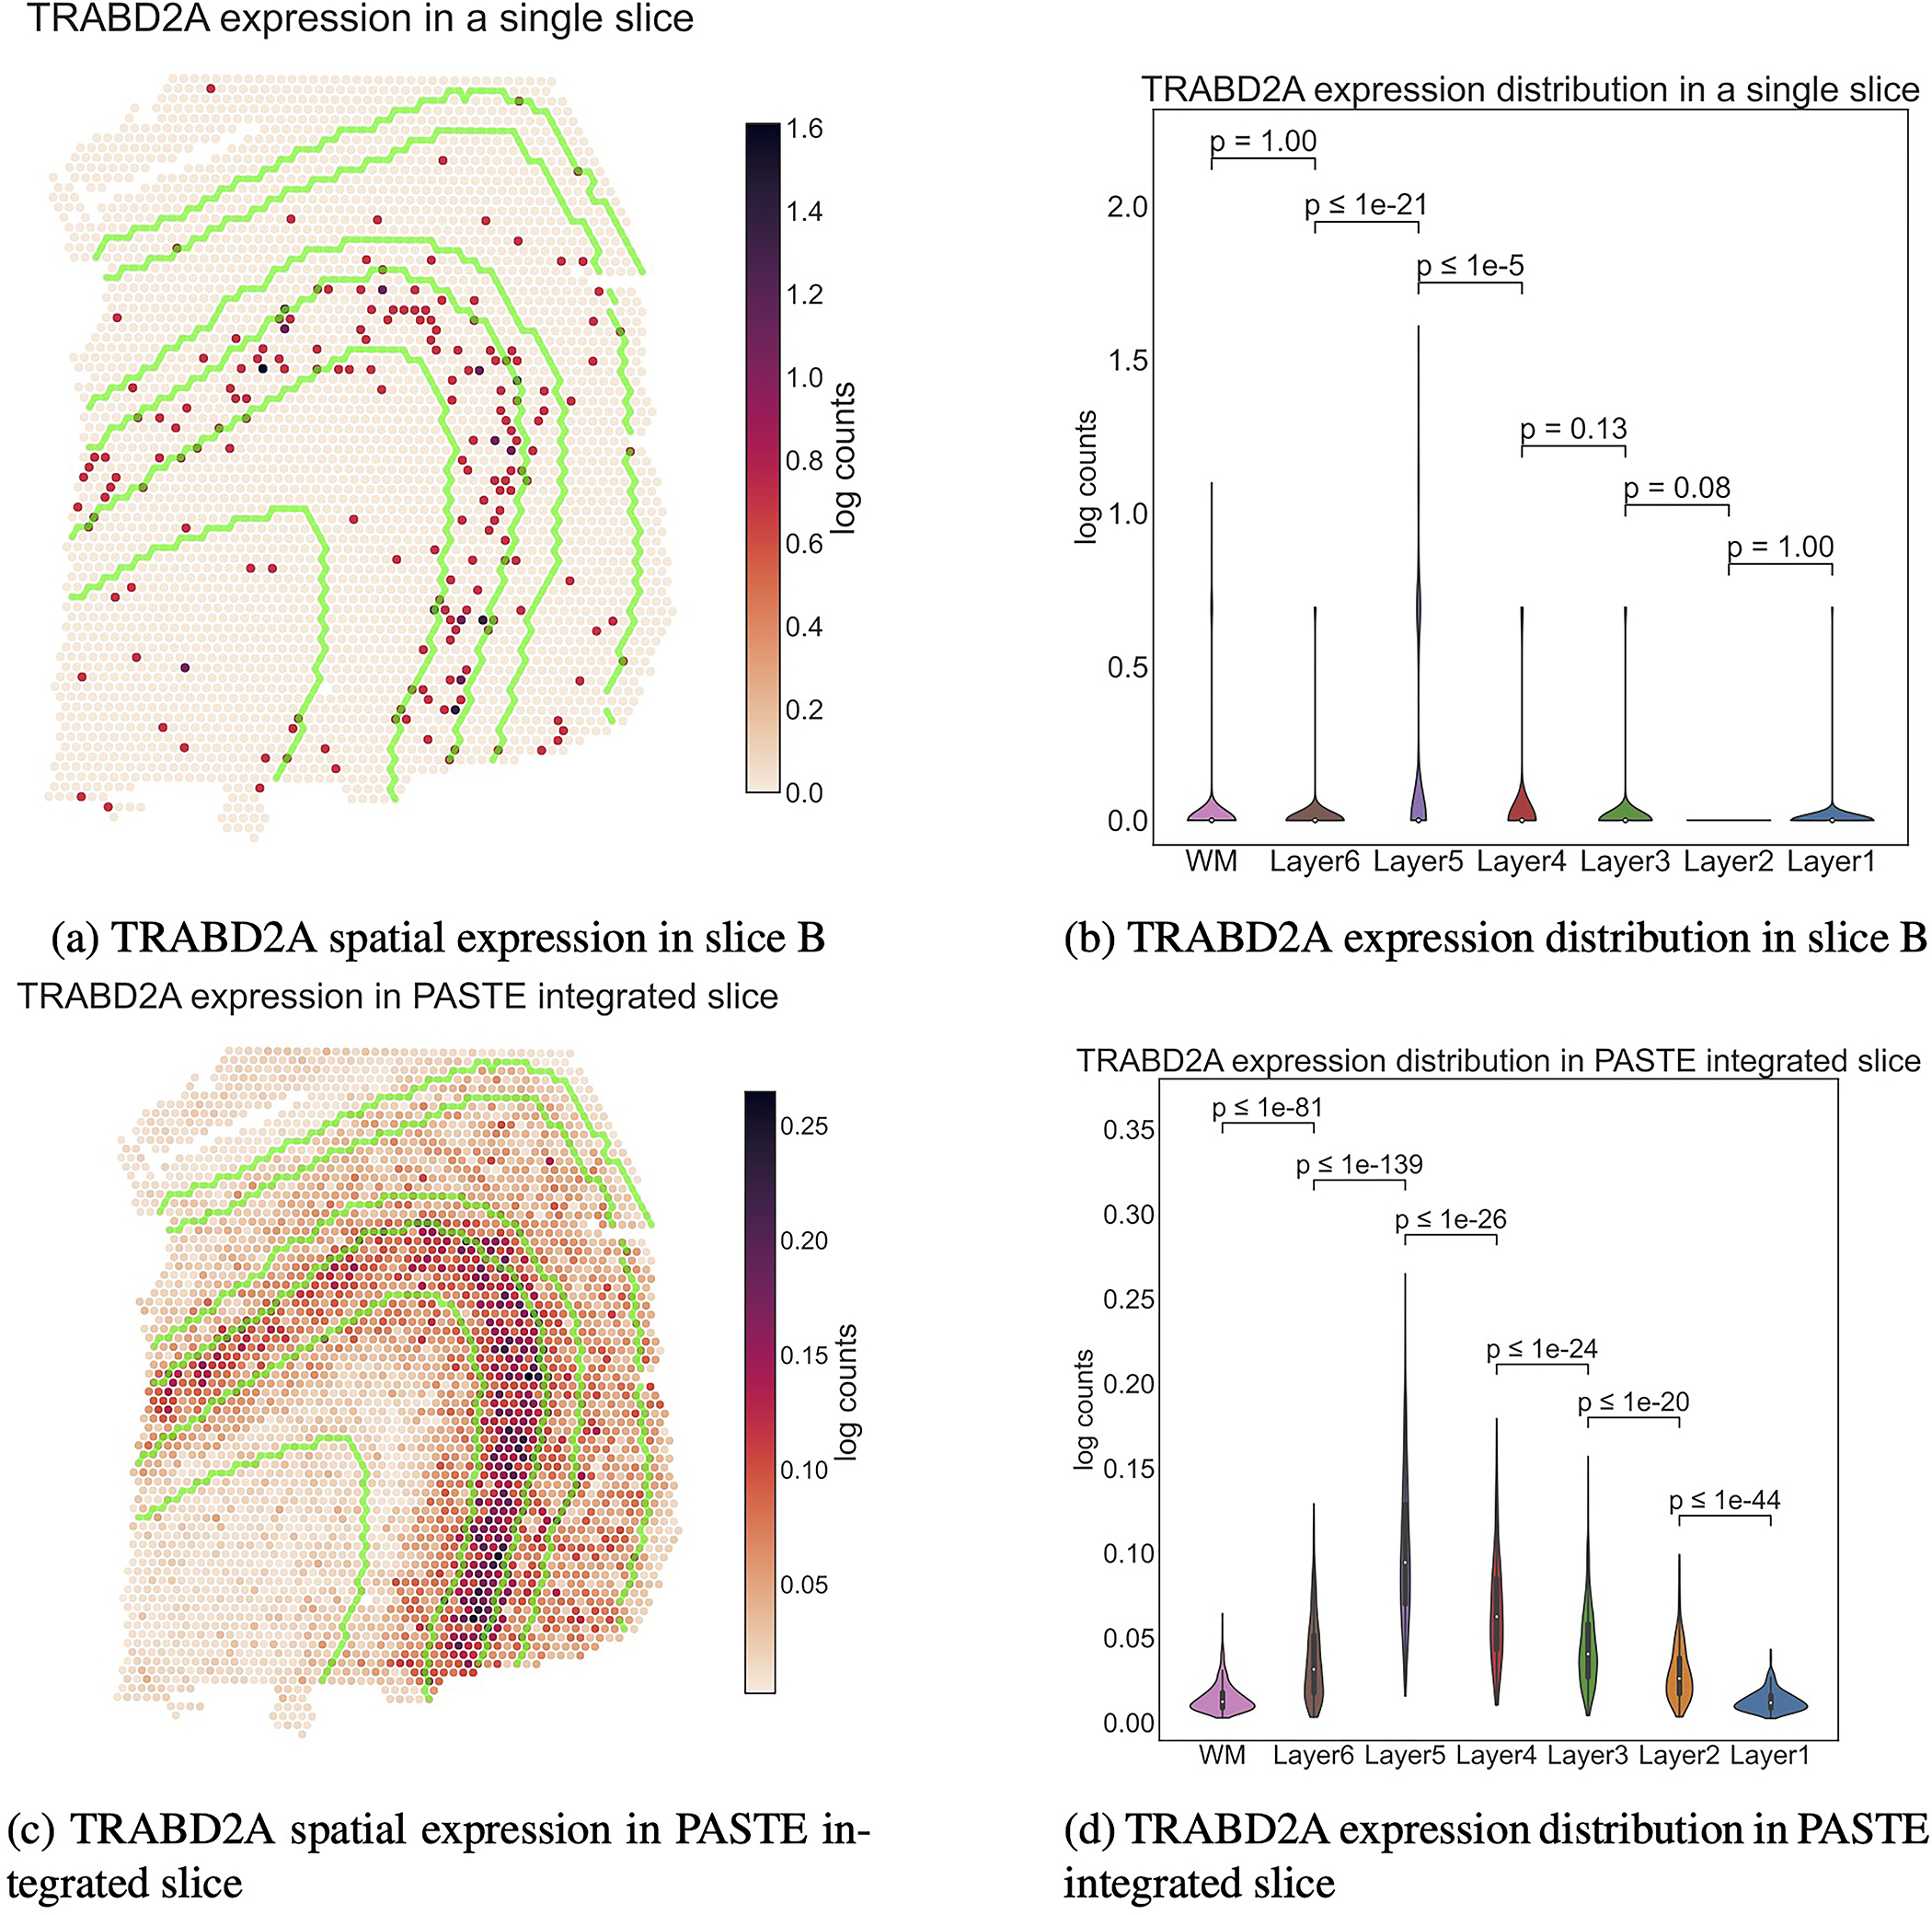
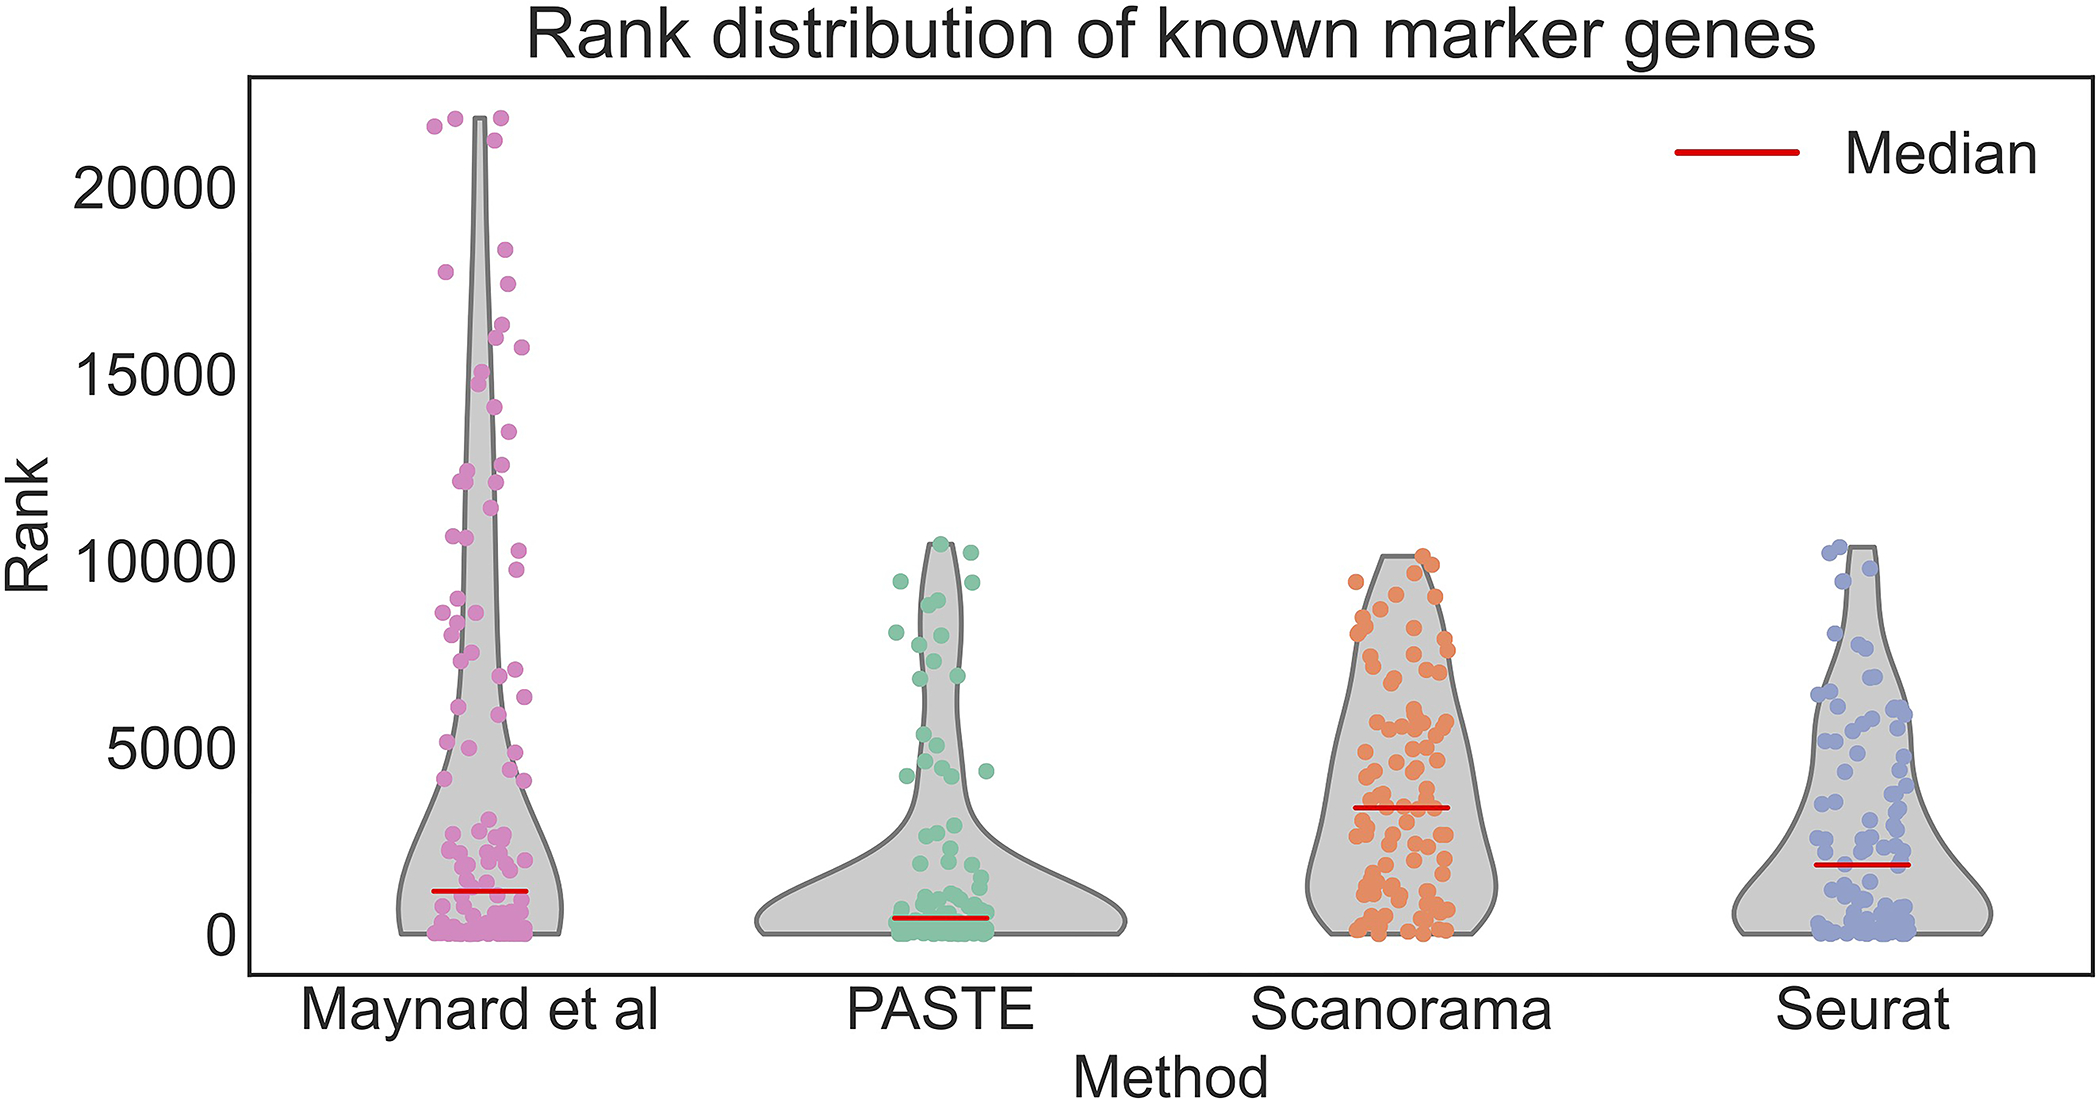
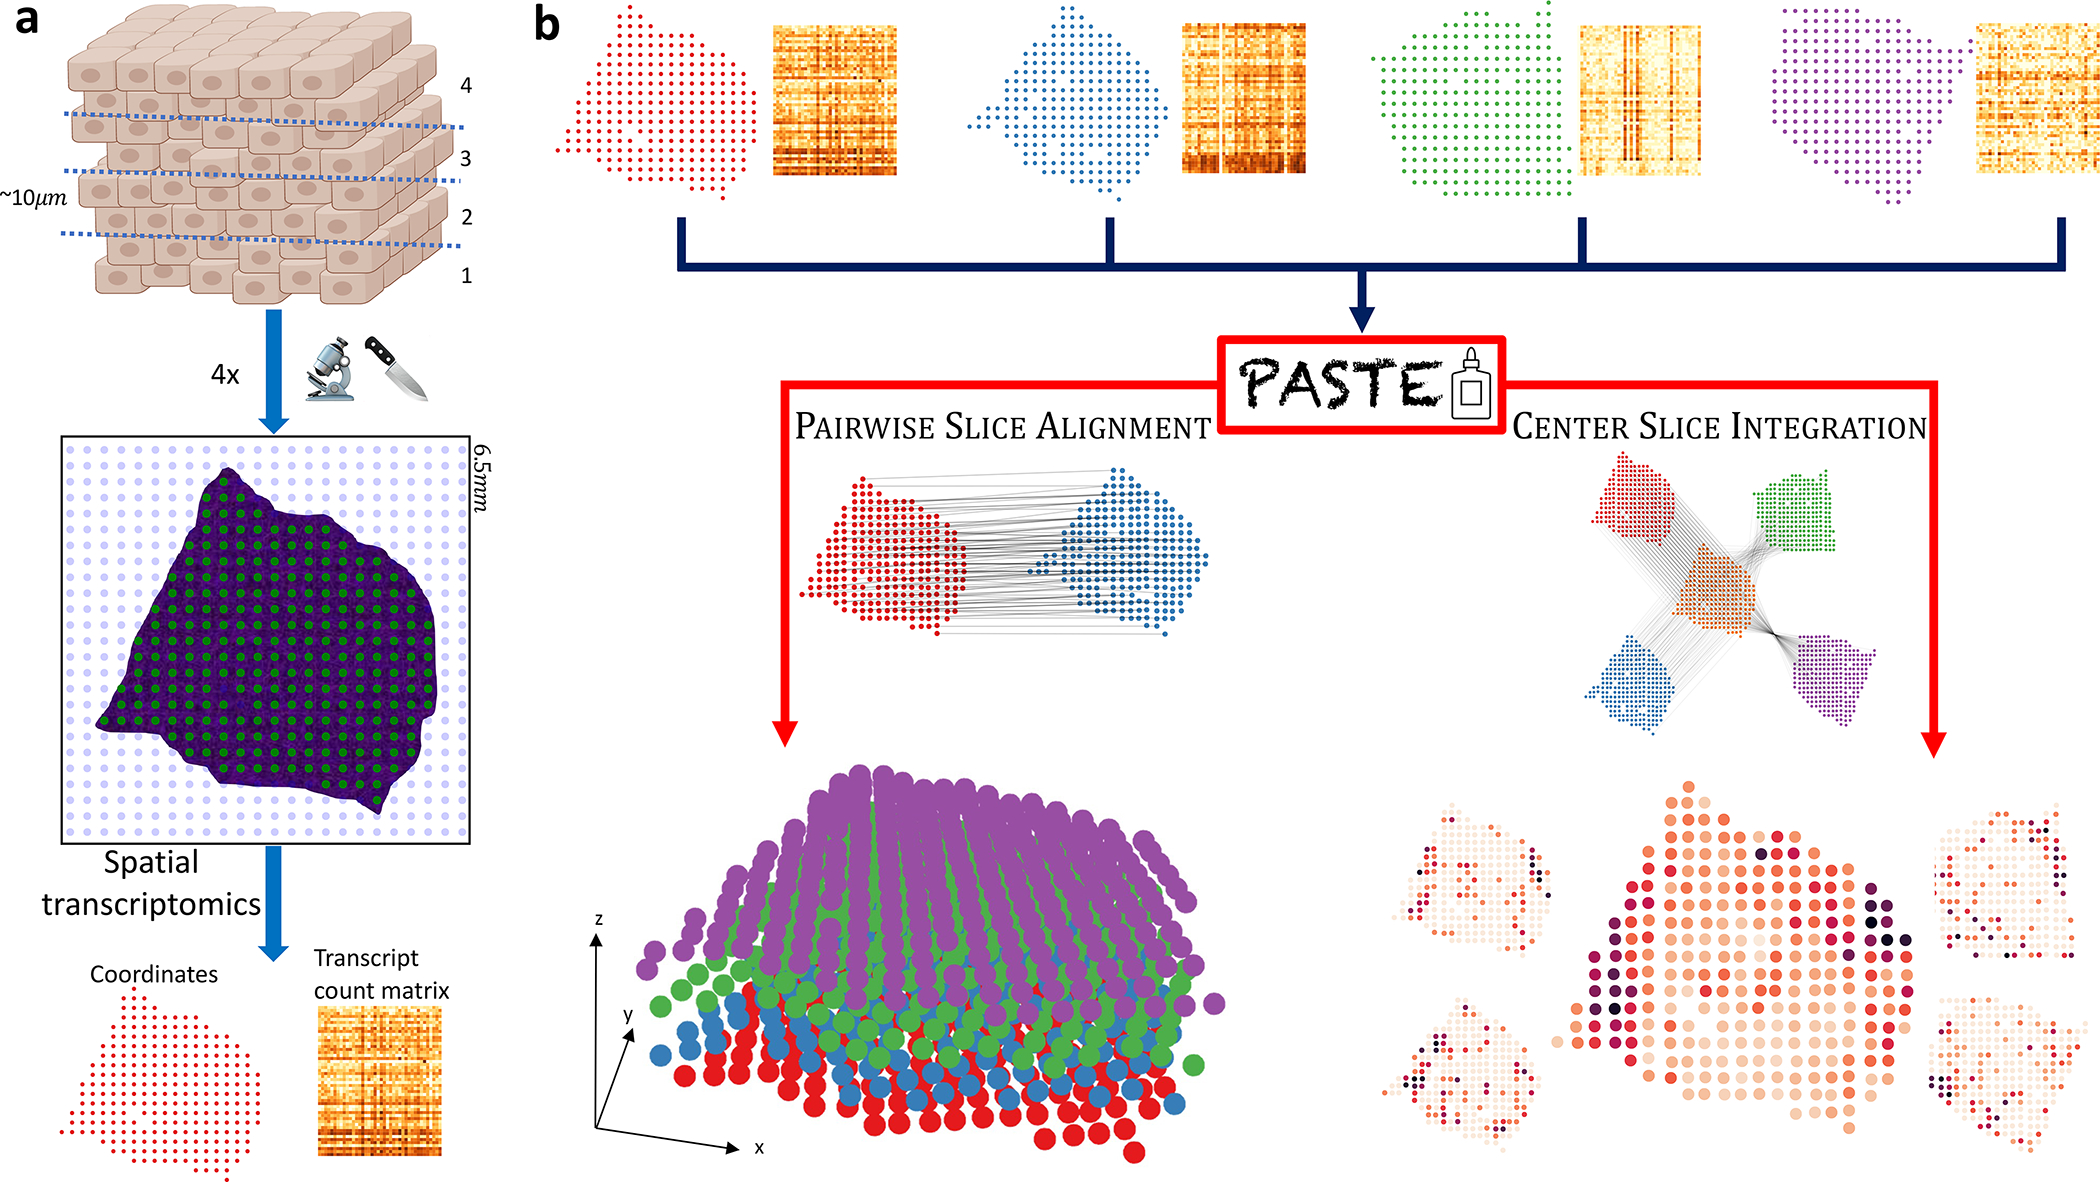
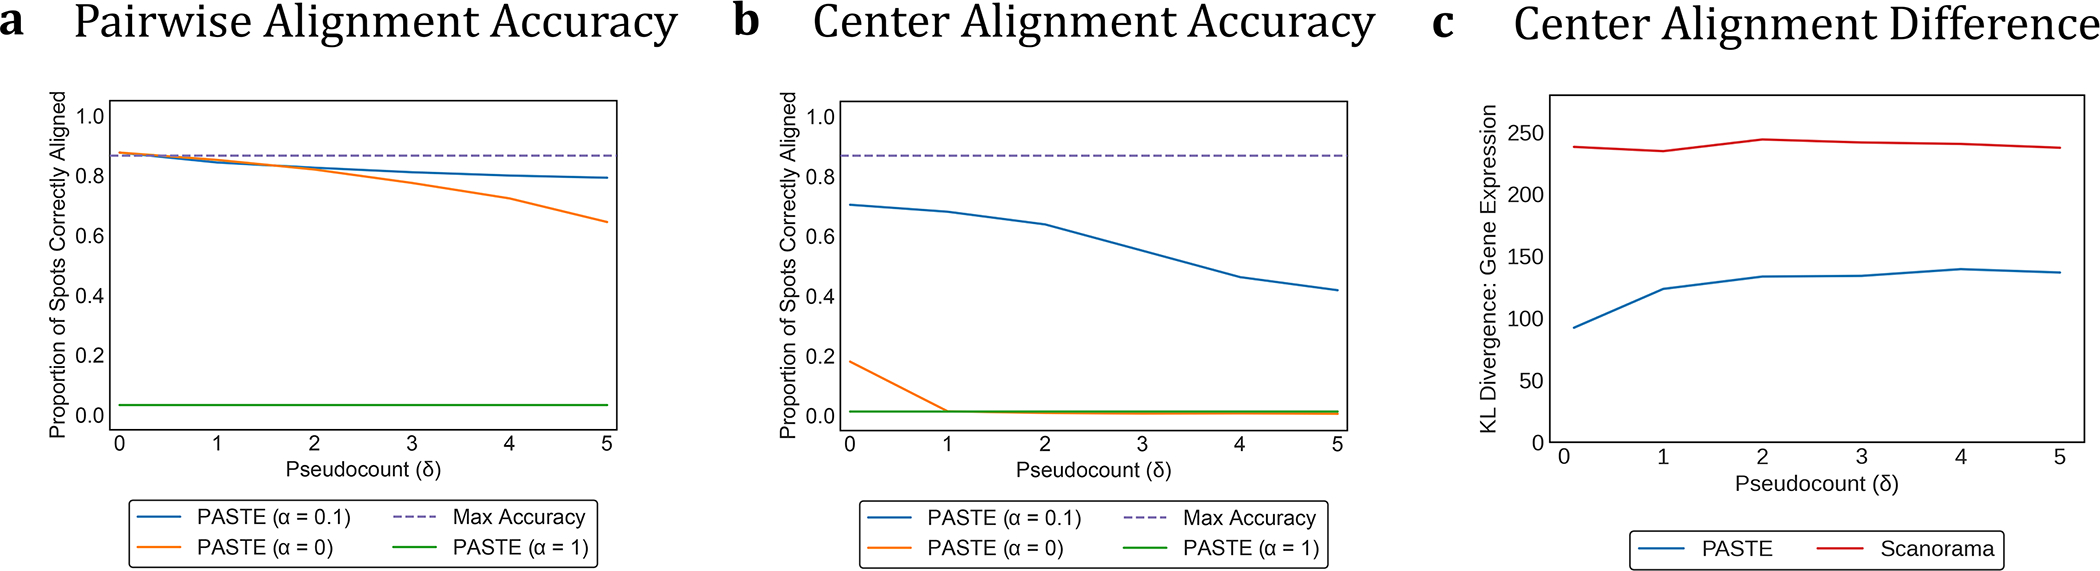
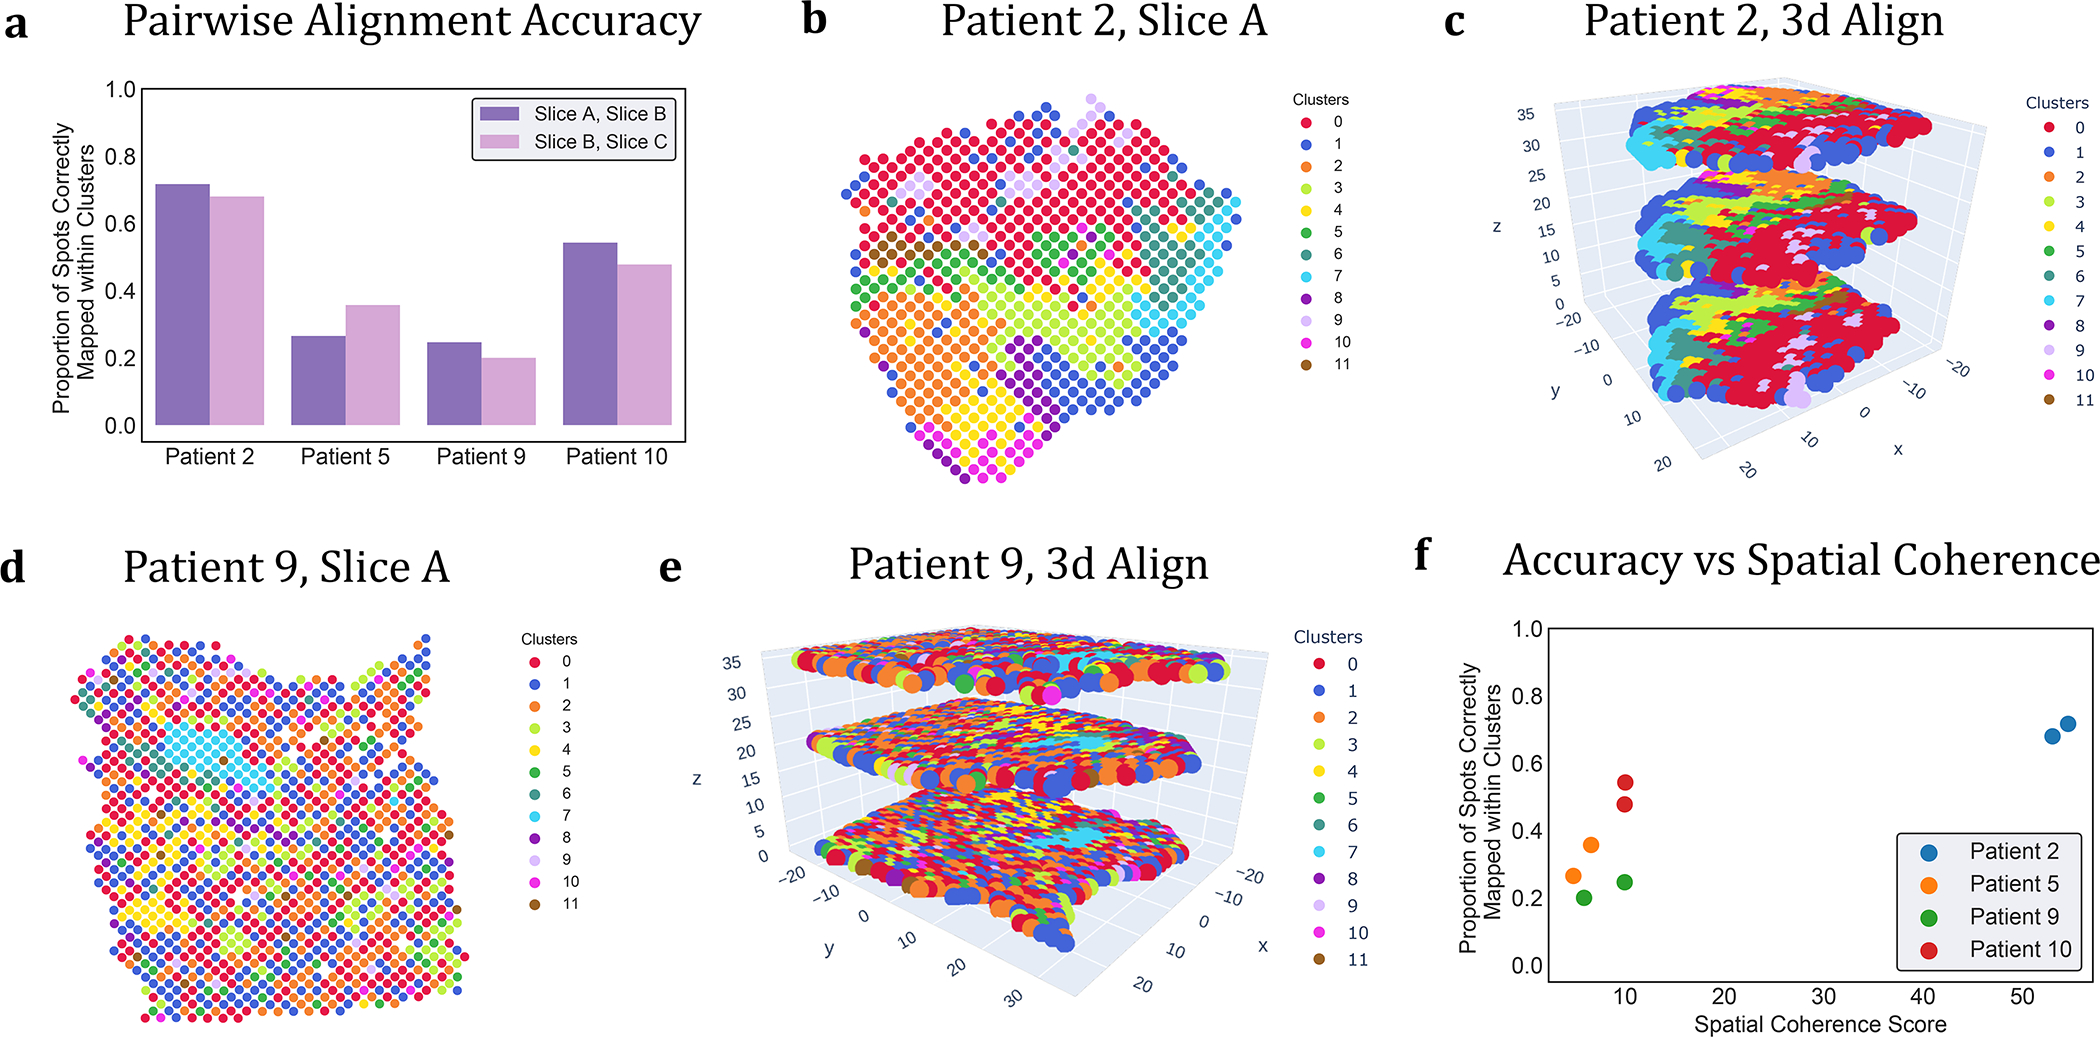
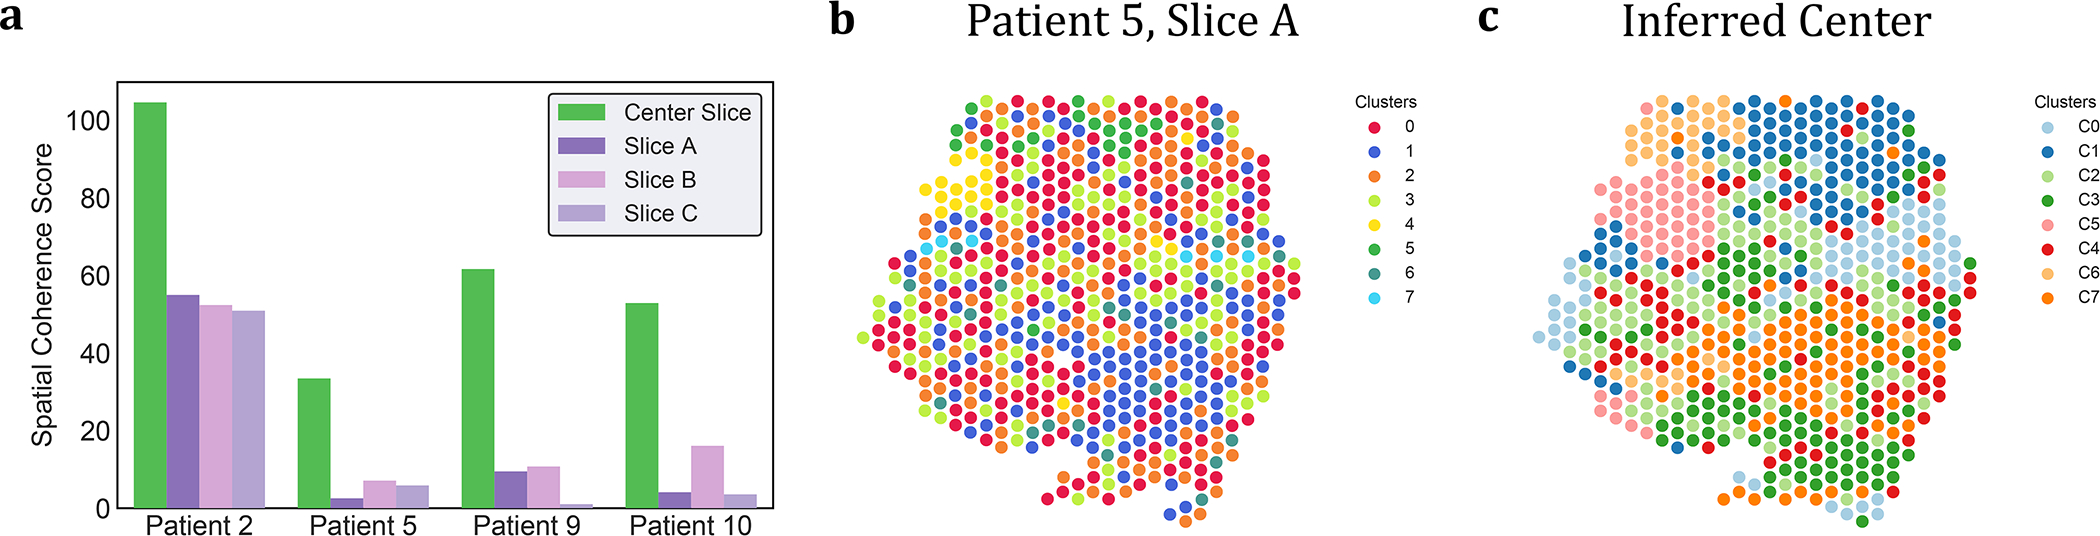
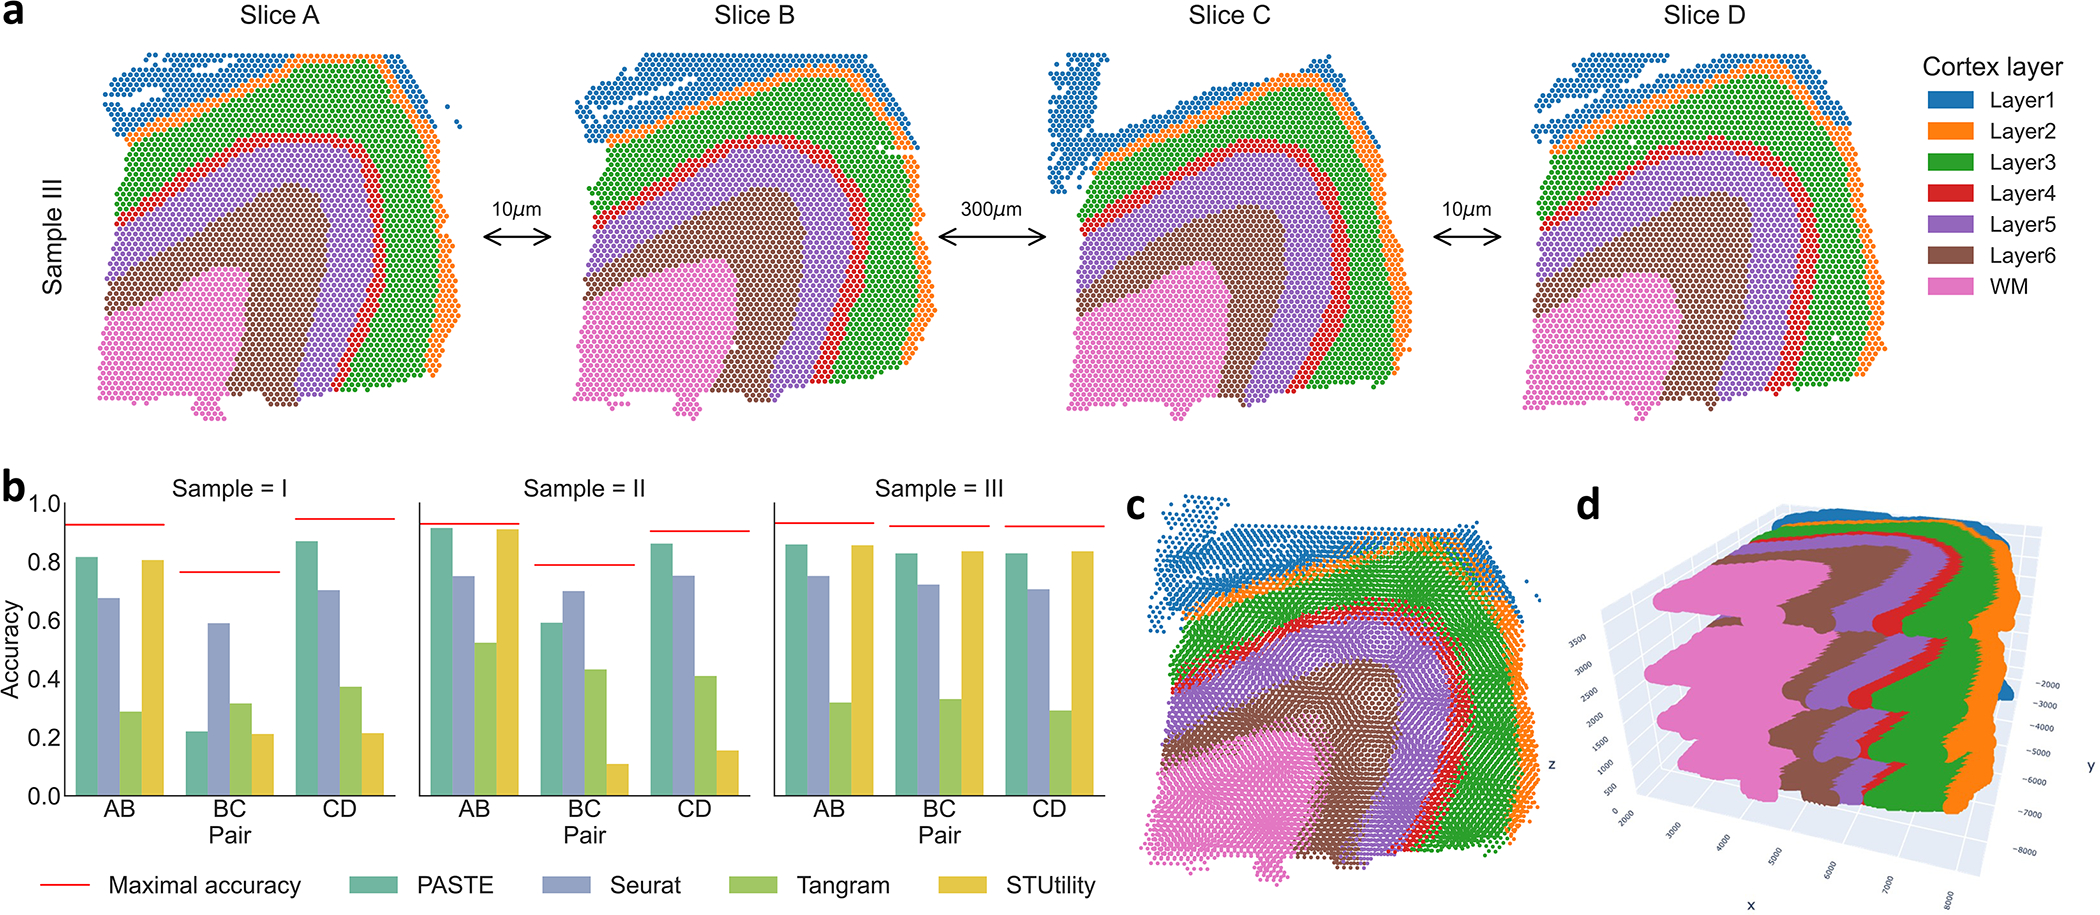
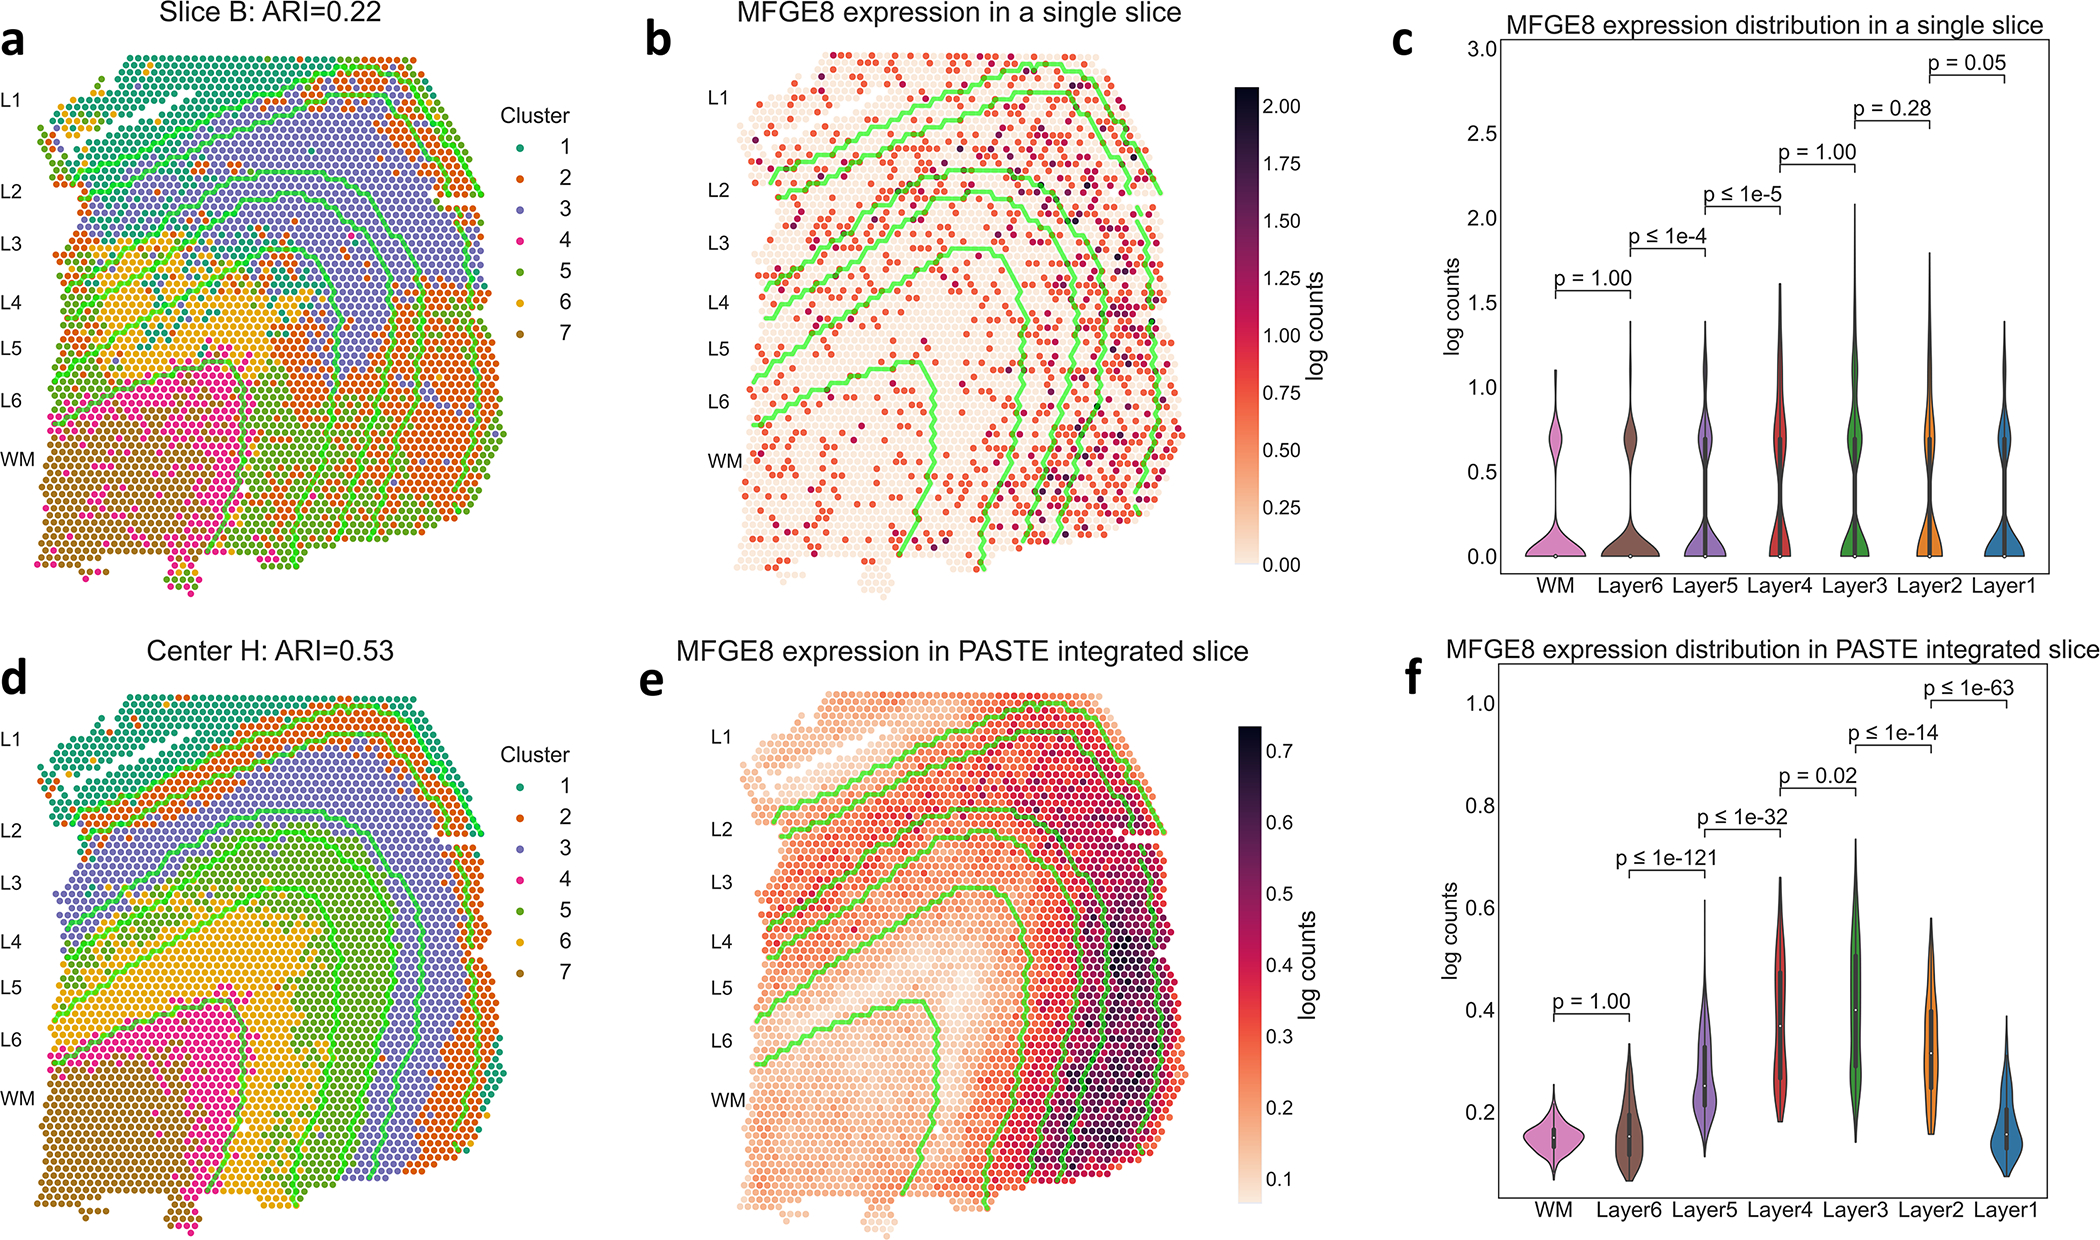
Spatial transcriptomics (ST) measures mRNA expression across thousands of spots from a tissue slice while recording the two-dimensional (2D) coordinates of each spot. We introduce probabilistic alignment of ST experiments (PASTE), a method to align and integrate ST data from multiple adjacent tissue slices. PASTE computes pairwise alignments of slices using an optimal transport formulation that models both transcriptional similarity and physical distances between spots. PASTE further combines pairwise alignments to construct a stacked 3D alignment of a tissue. Alternatively, PASTE can integrate multiple ST slices into a single consensus slice. We show that PASTE accurately aligns spots across adjacent slices in both simulated and real ST data, demonstrating the advantages of using both transcriptional similarity and spatial information. We further show that the PASTE integrated slice improves the identification of cell types and differentially expressed genes compared with existing approaches that either analyze single ST slices or ignore spatial information.


Conflict of interest statement

6 Competing Interests

B.J.R. is a cofounder of, and consultant to, Medley Genomics. The other authors declare no competing interests.

Figures

Extended Data Fig. 1
Extended Data Fig. 1. Spatial organization of breast cancer ST slices
(a-d) Spatial organization of the four breast cancer ST slices from [35]. Each slice in this dataset consists of 251–264 spots and 7453–7998 genes. (e) Spatial coordinates of the four breast cancer ST slices from [35] after pairwise alignment via PASTE.
Extended Data Fig. 2
Extended Data Fig. 2. PASTE results on simulated data generated from each of the indicated breast cancer slices [35]
Each line (color) corresponds to running PASTE with a specific value for alpha. Error bars represent the standard deviation across 10 simulated instances.
Extended Data Fig. 3
Extended Data Fig. 3. Comparison of published clusters and clusters obtained by PASTE on ST data from SCC patients 2, 5, 9, and 10 in [21]
(Left) The published cluster labels from [21] of spots in slice A from each of the four patients. (Right) $k$-means clustering of inferred center slice from PASTE.
Extended Data Fig. 4
Extended Data Fig. 4. PASTE integration of Her2 breast cancer patient G from Andersson et al
(a) Pathological annotations and (b) clustering results from PASTE integrated slice for a slice of breast cancer patient G from Andersson et al. Black circles indicate small region of spots of in situ cancer which are also clustered together in the PASTE integrated slice
Extended Data Fig. 5
Extended Data Fig. 5. Dorsolateral prefrontal cortex ST data from [31]
Each of the three samples is composed of four ST slices. The first two slices and last two slices are 10$\mu m$ apart while the middle pair of slices is taken 300$\mu m$ apart. Spots are colored by the six neocortical layers or the white matter according to the annotation of [31]
Extended Data Fig. 6
Extended Data Fig. 6. Pairwise alignment of slices B and C from DLPFC Sample I
Pairwise alignment using (a) PASTE, (b) Seurat, (c) Tangram and (d) STUtility. Gray lines connect the 1000 spot pairs with highest alignment values from each method. PASTE and STUtility alignments are more consistent with spatial organization of slices than Seurat and Tangram alignments.
Extended Data Fig. 7
Extended Data Fig. 7. Alignment accuracy of adjacent DLPFC slices using PASTE with different expression costs
PASTE with: (Default) All genes and KL divergence, (Lib-Log-Norm) All genes with library size normalization and log transformation and Euclidean distance, (HVG) Same as Lib-Log-Norm but restricted to top 2000 highly variable genes.
Extended Data Fig. 8
Extended Data Fig. 8. TRABD2A expression in a single slice and PASTE integrated slice
The boundaries between the layers are marked in green in a and c. WM and Layers 6 to 1 have 625, 614, 621, 247, 924, 224 and 380 spots respectively. Inner boxplots show the 25\%, 50\% and 75\% quantiles of the distributions. $p$-values (rounded to the closest power of $10$) for the difference in distribution (two-sided Mann-Whitney U test) between adjacent layers are indicated. TRABD2A was validated using smFISH in [31] as a layer 5 marker gene.
Extended Data Fig. 9
Extended Data Fig. 9. Ranking of known layer-specific marker genes by differential expression analysis
Gene ranking using: the pseudo-bulk approach of Maynard et al., PASTE center slice integration, Scanorama, and Seurat. Red lines indicate median rank of marker genes which are 1147 for Maynard et al, 427 for PASTE, 3380.5 for Scanorama, and 1852 for Seurat. Rank 1 is the highest rank.
Figure 1:
Figure 1:. Alignment and integration of spatial transcriptomics slices with PASTE.
(a) Each slice generated for an ST experiment is placed on a 2D grid of barcoded spots, and mRNA expression of each spot is measured along with the spatial coordinates of each spot. Only a fraction of spots (green) contain tissue cells, with other spots (blue) not covered by a tissue. This results in a transcript count matrix for the tissue spots together with their spatial coordinates. (b) PASTE takes as input multiple ST slices consisting of spot expression matrices and spot spatial locations. In PAIRWISE SLICE ALIGNMENT mode, PASTE finds an optimal mapping between spots in one slice and spots in another slice while preserving the gene expression and the spatial distances of mapped spots. These mappings can then be used to reconstruct a stacked 3D alignment of the tissue by stacking slices on top of each other. In CENTER SLICE INTEGRATION mode, PASTE infers a “center” slice consisting of a low rank expression matrix and a collection of mappings from the spots of the center slice to the spots of each input slice. The inferred center slice generally has lower sparsity and lower variance than the individual ST slices.
Figure 2:
Figure 2:. PASTE results on simulated ST slices from a breast cancer ST slice from [35].
(a) Average percentage of spots correctly aligned by PASTE in PAIRWISE SLICE ALIGNMENT mode using α = 0 (gene expression data only), α = 1 (spatial information only), and α = 0.1 (both) as a function of the added pseudocount δ. The dotted line represents the maximum possible accuracy. (b) Average percentage of spots correctly aligned by PASTE in CENTER SLICE INTEGRATION mode between the original center slice and the simulated slices. (c) Difference between the gene expression matrix of the true center slice and the gene expression matrix inferred by PASTE and by Scanorama.
Figure 3:
Figure 3:. PASTE Pairwise Slice Alignment of squamous cell carcinoma (SCC) [21].
(a) Percentage of aligned spots from PASTE pairwise alignments of adjacent slices that have the same published cluster label from [21]. (b) Published cluster labels of spots in slice A of patient 2 have moderate spatial coherence. (c) Stacked 3D alignment of SCC tumor from patient 2 produced by PASTE using pairwise alignments of adjacent slices. Slices are colored according to published cluster labels. (d) Published cluster labels of spots in slice A of patient 9 have lower spatial coherence. (e) Stacked 3D alignment of SCC tumor from patient 9. (f) Percentage of aligned spots with same cluster label is larger for slices with higher spatial coherence score.
Figure 4:
Figure 4:. PASTE Center Slice Integration of SCC tumor [21] into a center slice.
(a) Spatial coherence scores for the clusters obtained from the center slice inferred by PASTE (green) and for the published clusters from [21] on the individual slices from each patient (purple and pink). (b) Published cluster labels of spots in slice A of patient 5. (c) Cluster labels C1, . . . , C7 of spots obtained from PASTE’s inferred center slice for patient 5.
Figure 5:
Figure 5:. PASTE pairwise alignment and stacked 3D alignment of DLPFC sample III.
(a) One sample of DLPFC with four slices labeled A,B,C and D, with spots colored according to the manual annotations from [31]. The first pair (AB) and last pair (CD) of slices are adjacent (10μm) while the middle pair (BC) are further apart (300μm). Spots in each slice are colored according to the the annotation from [31] that classifies spots into six neocortical layers and white matter. (b) Accuracy of pairwise alignment of consecutive DLPFC slices (labeled AB, BC, and CD) for PASTE, Seurat, Tangram and STUtility. Accuracy is computed from the published annotation of each spot. Red line marks the maximal possible accuracy given the number of spots in each layer in the two slices. (c) Stacking four ST slices of DLPFC sample III using coordinates from PASTE pairwise alignments. (d) Stacked 3D alignment of the four tissue slices of DLPFC sample III after alignment with PASTE. The z-axis is not to scale.
Figure 6:
Figure 6:. PASTE center alignment of DLPFC sample III improves identification of layers and differentially expressed genes.
(a) Clustering of spots by gene expression in a single slice B shows low agreement (ARI = 0.22) with published layer labels, whose boundaries are marked by green curves. (b) Expression of the layer 3 marker gene MFGE8 in slice B. (c) Distribution of MFGE8 expression in annotated layers of slice B. WM and Layers 6 to 1 have 625, 614, 621, 247, 924, 224 and 380 spots respectively. Inner boxplots show the 25%, 50% and 75% quantiles of the distributions. p-values (rounded to the closest power of 10) for the difference in distribution (two-sided Mann-Whitney U test) between adjacent layers are indicated. (d) Clustering of spots using the low dimensional representation of the integrated center slice by PASTE shows better agreement (ARI = 0.53) with published layer labels. (e) Expression of the layer 3 marker gene MFGE8 in PASTE integrated center slice. (f) Distribution of MFGE8 expression in center slice, with p-values as described in (c).

Comment in

References

    1. 10x Genomics. Visium spatial gene expression: Map the whole transcriptome within the tissue context, 2019. Accessed: October 2020.
    1. Tarmo Äijö Silas Maniatis, Vickovic Sanja, Kang Kristy, Cuevas Miguel, Braine Catherine, Phatnani Hemali, Lundeberg Joakim, and Bonneau Richard. Splotch: Robust estimation of aligned spatial temporal gene expression data. bioRxiv, 2019.
    1. Andersson Alma, Larsson Ludvig, Stenbeck Linnea, Salmén Fredrik, Ehinger Anna, Wu Sunny Z., Al-Eryani Ghamdan, Roden Daniel, Swarbrick Alex, Borg Åke, Frisén Jonas, Engblom Camilla, and Lundeberg Joakim. Spatial deconvolution of her2-positive breast cancer delineates tumor-associated cell type interactions. Nature Communications, 12(1):6012, 2021. - PMC - PubMed
    1. Arnol Damien, Schapiro Denis, Bodenmiller Bernd, Saez-Rodriguez Julio, and Stegle Oliver. Modeling cell-cell interactions from spatial molecular data with spatial variance component analysis. Cell Reports, 29(1):202–211, 2019. - PMC - PubMed
    1. Asp Michaela, Salmén Fredrik, Ståhl Patrik L, Vickovic Sanja, Felldin Ulrika, Löfling Marie, Navarro José Fernandez, Maaskola Jonas, Eriksson Maria J, Persson Bengt, et al. Spatial detection of fetal marker genes expressed at low level in adult human heart tissue. Scientific reports, 7(1):1–10, 2017. - PMC - PubMed

Methods References

    1. Andersson Alma, Larsson Ludvig, Stenbeck Linnea, Salmén Fredrik, Ehinger Anna, Wu Sunny Z., Al-Eryani Ghamdan, Roden Daniel, Swarbrick Alex, Borg Åke, Frisén Jonas, Engblom Camilla, and Lundeberg Joakim. Spatial deconvolution of her2-positive breast cancer delineates tumor-associated cell type interactions. Nature Communications, 12(1):6012, 2021. - PMC - PubMed
    1. Bergenstråhle Joseph, Larsson Ludvig, and Lundeberg Joakim. Seamless integration of image and molecular analysis for spatial transcriptomics workflows. BMC Genomics, 21(1):482, 2020. - PMC - PubMed
    1. Berglund Emelie, Maaskola Jonas, Schultz Niklas, Friedrich Stefanie, Marklund Maja, Joseph Bergenstråhle, Tarish Firas, Tanoglidi Anna, Vickovic Sanja, Larsson Ludvig, Salmén Fredrik, Ogris Christoph, Wallenborg Karolina, Lagergren Jens, Ståhl Patrik, Sonnhammer Erik, Helleday Thomas, and Lundeberg Joakim. Spatial maps of prostate cancer transcriptomes reveal an unexplored landscape of heterogeneity. Nature Communications, 9(1):2419, 2018. - PMC - PubMed
    1. Biancalani Tommaso, Scalia Gabriele, Buffoni Lorenzo, Avasthi Raghav, Lu Ziqing, Sanger Aman, Tokcan Neriman, Vanderburg Charles R., Segerstolpe Åsa, Zhang Meng, Avraham-Davidi Inbal, Vickovic Sanja, Nitzan Mor, Ma Sai, Subramanian Ayshwarya, Lipinski Michal, Buenrostro Jason, Brown Nik Bear, Fanelli Duccio, Zhuang Xiaowei, Macosko Evan Z., and Regev Aviv. Deep learning and alignment of spatially resolved single-cell transcriptomes with tangram. Nature Methods, 2021. - PMC - PubMed
    1. Chen Mengjie and Zhou Xiang. Viper: variability-preserving imputation for accurate gene expression recovery in single-cell rna sequencing studies. Genome Biology, 19(1):196, 2018. - PMC - PubMed

Publication types