. 2022 Aug;18(8):821-830.
doi: 10.1038/s41589-022-01024-4. Epub 2022 May 16.

PRMT inhibition induces a viral mimicry response in triple-negative breast cancer

Affiliations

PRMT inhibition induces a viral mimicry response in triple-negative breast cancer

Qin Wu et al. Nat Chem Biol. 2022 Aug.

Abstract

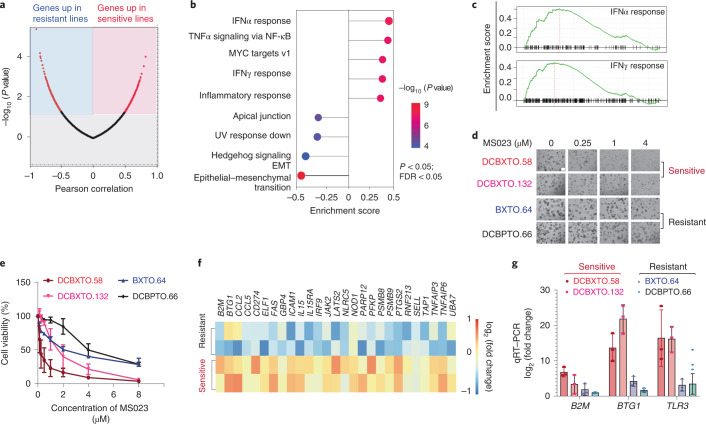
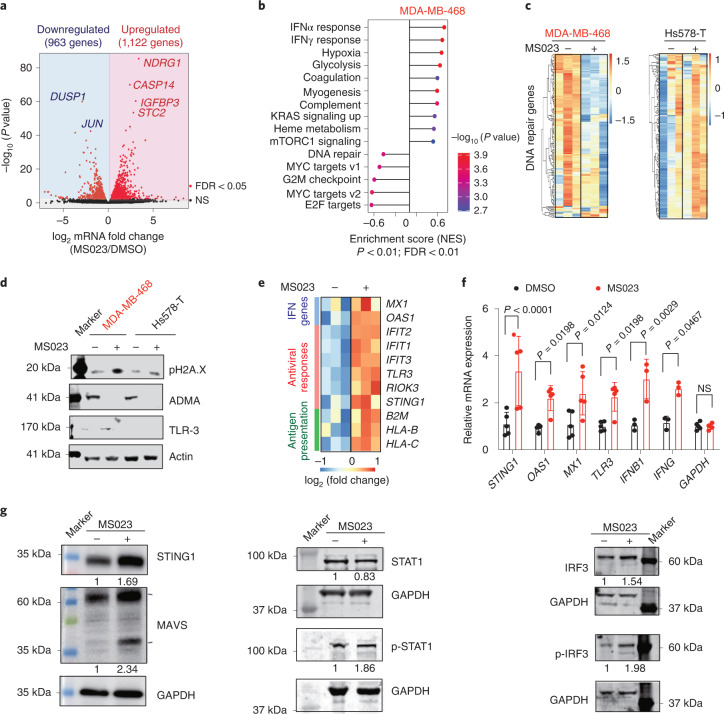
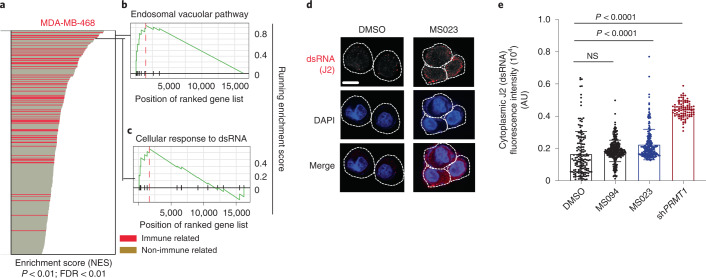
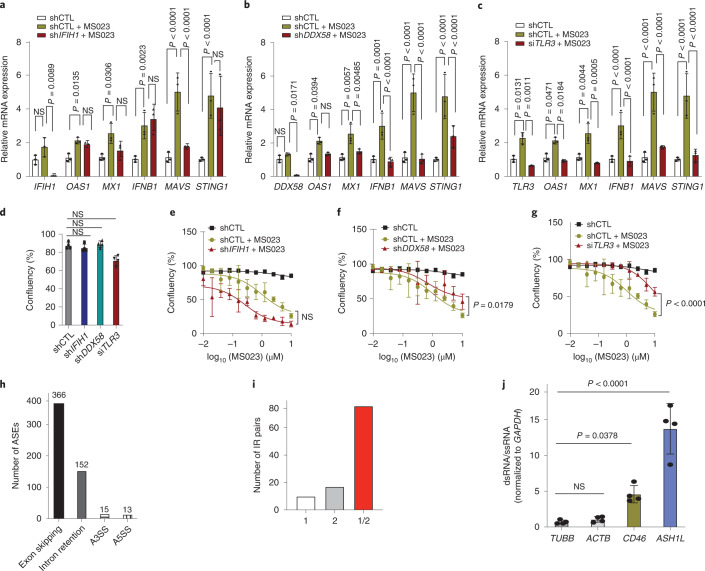
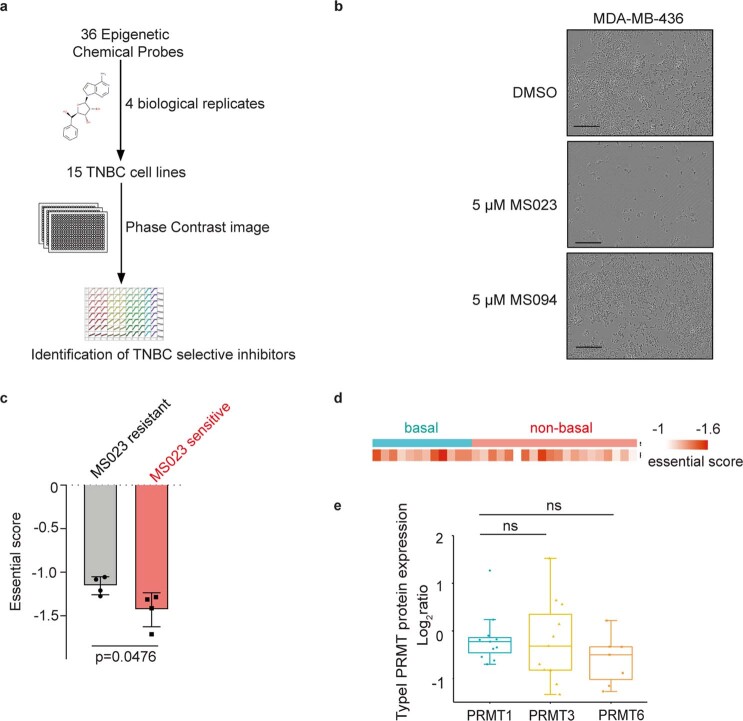
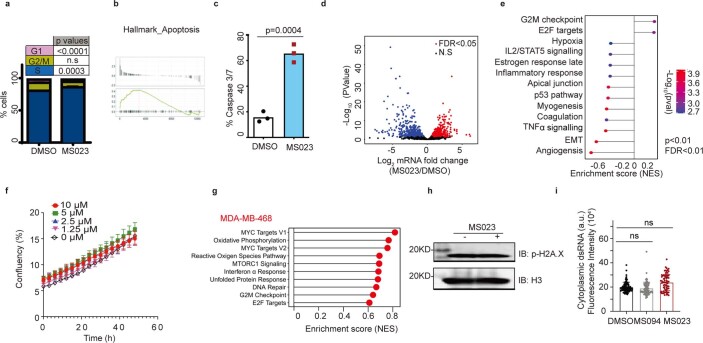
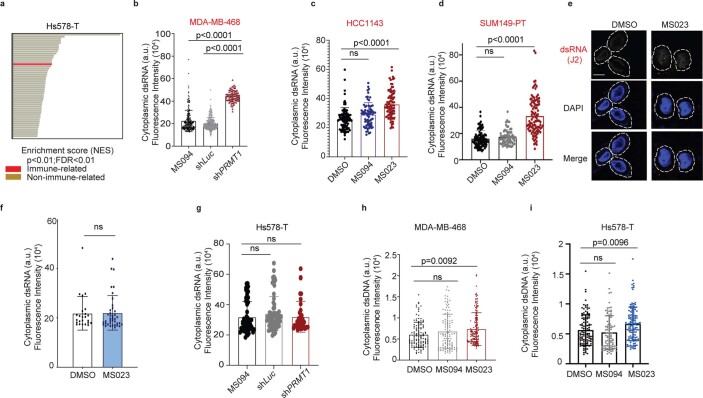
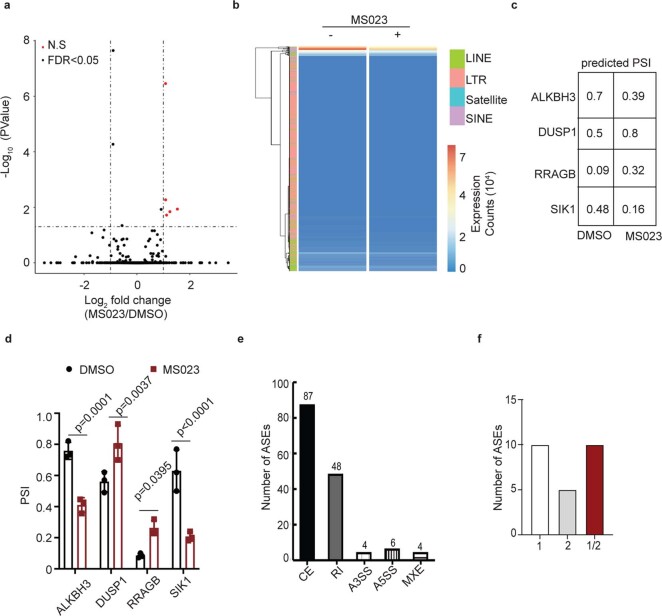
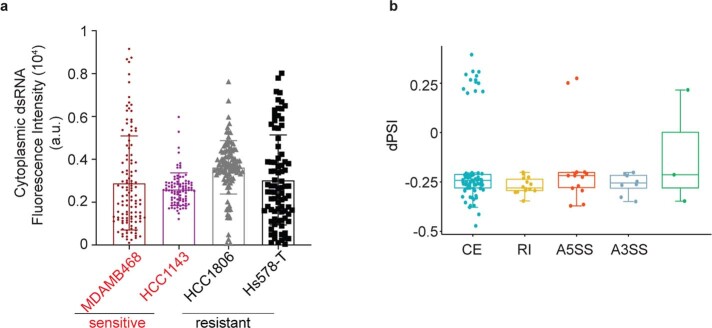
Triple-negative breast cancer (TNBC) is the most aggressive breast cancer subtype with the worst prognosis and few effective therapies. Here we identified MS023, an inhibitor of type I protein arginine methyltransferases (PRMTs), which has antitumor growth activity in TNBC. Pathway analysis of TNBC cell lines indicates that the activation of interferon responses before and after MS023 treatment is a functional biomarker and determinant of response, and these observations extend to a panel of human-derived organoids. Inhibition of type I PRMT triggers an interferon response through the antiviral defense pathway with the induction of double-stranded RNA, which is derived, at least in part, from inverted repeat Alu elements. Together, our results represent a shift in understanding the antitumor mechanism of type I PRMT inhibitors and provide a rationale and biomarker approach for the clinical development of type I PRMT inhibitors.


Conflict of interest statement

J.J. is a cofounder, consultant, shareholder and scientific advisory board member in Cullgen, Inc. J.J. is also a consultant at Accent Therapeutics, Inc., and EpiCypher, Inc. The J.J. lab received research funds from Cullinan Oncology, Inc., Celgene Corporation, Cullgen, Inc., and Levo Therapeutics, Inc. D.D.D.C. is a cofounder, employee and shareholder at DNAMx, Inc. D.D.D.C. received funding unrelated to this project from Pfizer and Nektar Therapeutics. All other authors declare no competing interests.

Figures

Fig. 1
Fig. 1. Chemical screen of 36 epigenetic probes identifies type I PRMTs as therapeutic targets in TNBC.
a, Heat map showing the average cell proliferation values of the indicated epigenetic chemical probes at 6 d in 15 TNBC cell lines (data are shown as mean ± s.d. of n = 4); KDM, lysine demethylase. b, Viable cell counts of three TNBC cell lines treated with the indicated chemical probes for 7 d (data are shown as mean ± s.d. of n = 4); data were analyzed by one-way analysis of variance (ANOVA) with Dunnett’s test for multiple comparisons. c, Essential score of type I PRMTs across TNBC cell lines from the Cancer Dependency Map dataset (https://depmap.org/portal/). d, Type I PRMT mRNA expression in TNBC cell lines (n = 28 TNBC cell lines per group, each dot as an individual line); data were analyzed by one-way ANOVA with Dunnett’s test for multiple comparisons; TPM, transcripts per million. Source data
Fig. 2
Fig. 2. Type I PRMT inhibition suppresses tumor growth in a subset of TNBC.
ad, PRMT1 gene expression in TCGA breast cancer datasets (a), METABRIC breast cancer datasets (b), Princess Margaret Hospital PDX datasets (PM-PDXs; c) and Princess Margaret Hospital cell line datasets (PM-cell lines; d). According to PAM50 classification, the cohorts were designated as basal and non-basal subtypes. Gene expression is reported as log2 (TPM + 0.001). In the box plots, the center lines mark the median, the box limits indicate the 25th and 75th percentiles, and the whiskers extend to 1.5× the interquartile range from the 25th and 75th percentiles. The numbers of individuals (n) per group are indicated, and the fold change (FC) values are as labeled. Data were analyzed by unpaired two-tailed Student’s t-test. e, Heat map of responsiveness to MS023 in the indicated cell lines. AAC was calculated from dose–response assays across 17 TNBC cell lines. Data are normalized to DMSO. A higher AAC indicates greater sensitivity. Colored cell lines are studied in more detail in this paper. Data are shown as mean ± s.d.; n = 4. f, Growth curves of Hs578-T and MDA-MB-468 cells treated with MS023 for 5 d. Data are shown as mean ± s.d.; n = 4. g, Immunoblots of MDA-MD-468 and Hs578-T cells following 5 d of treatment with the indicated doses of MS023 and the negative control MS094. Data are representative of n = 3 independent experiments. h, Immunoblots showing the doxycycline-inducible shRNA knockdown of PRMT1 or luciferase control in MDA-MB-468 and Hs578-T cells. Data are representative of n = 3 independent experiments; SDMA, symmetric dimethylarginine; Luc, luciferase. i, Individual tumor growth of the MDA-MB-468 xenograft model with once-daily administration of 60 mg kg–1 MS023 when tumors reach 2 mm in diameter. Data are shown as mean ± s.d.; n = 3. Data were analyzed by two-way ANOVA with Dunnett’s test for multiple comparisons. j, Tumor weight was measured as a surrogate for tumor burden from the control (CTL) and MS023-treated mice. Data are shown as mean ± s.d. (n = 3) and were analyzed by one-way ANOVA with Dunnett’s test. k, Immunoblot of tumor tissue from mice treated with control or MS023 at the experimental endpoint. Data are representative of n = 3 independent technical experiments. Source data
Fig. 3
Fig. 3. Increased IFN responses underlie the responsiveness to type I PRMT inhibition.
a, Pearson correlation analysis of individual gene expression and MS023 activity. A Volcano plot of log2 fold change values for all genes significantly upregulated in sensitive lines (red, left) or in resistant lines (blue, right) is shown. Data were analyzed by unpaired two-tailed Student’s t-test for multiple comparisons. b, Top nine pathways significantly correlated with MS023 sensitivity. Data were analyzed by one-tailed Fisher’s exact test for multiple comparisons; FDR, false discovery rate; EMT, epithelial–mesenchymal transition. c, GSEA for gene sets associated with IFN responses enriched in sensitive TNBC lines. Data were analyzed by one-tailed Fisher’s exact test. d, Images of different organoid models with either DMSO or MS023 treatment; scale bar, 100 μm. The image shown is representative of n = 4 independent experiments. e, Differential response of organoids to MS023 treatment. Data are shown as mean ± s.d.; n = 2. f, Heat map showing the differential expression of IFN-responsive genes between sensitive and resistant models. g, qRT–PCR validation of the expression of the indicated genes in both MS023-sensitive and MS023-resistant organoid models. Data are shown as mean ± s.d.; n = 3. Source data
Fig. 4
Fig. 4. MS023 treatment triggers IFN responses.
a, Volcano plot of log2 fold change for genes significantly upregulated (red, right) or downregulated (blue, left) following 5 d of MS023 treatment in the MDA-MB-468 cell line. Data were analyzed by unpaired two-tailed Student’s t-test; NS, not significant. b, GSEA of all ranked differentially expressed genes. Data were analyzed by one-tailed Fisher’s exact test; NES, normalized enrichment score. c, Heat map showing genes associated with DNA repair after MS023 treatment for 5 d in both MDA-MB-468 and Hs578-T cell lines. d, Immunoblots showing the expression level of pH2AX, a DNA damage marker, with either DMSO or MS023 treatment in both MDA-MB-468 and Hs578-T cell lines. Data are representative of n = 3 independent experiments. e, Heat map showing RNA-seq data for indicated genes in MDA-MB-468 cells with either DMSO or MS023 treatment for 5 d. f, Expression of indicated IFN-responsive genes in MDA-MB-468 cells with either DMSO or MS023 treatment for 5 d analyzed by qRT–PCR. Data are shown as mean ± s.d.; n = 5 for STING1, OAS1, MX1, TLR3 and GAPDH; n = 3 for IFNB1 and IFNG. Data were analyzed by two-way ANOVA with Dunnett’s test for multiple comparisons. g, Immunoblots of the indicated proteins in MDA-MB-468 cells after 5 d of MS023 treatment. Normalized band intensity is labeled. Data are representative of n = 3 independent experiments; p-STAT1, phospho-STAT1; p-IRF3, phospho-IRF3. Source data
Fig. 5
Fig. 5. Type I PRMT inhibition induces cytoplasmic dsRNA formation due to increased intron retention.
ac, Type I PRMT inhibition leads to activation of immune signatures in MS023-sensitive cells. a, Bar plot of upregulated gene sets enriched in the MDA-MB-468 cell line after MS023 treatment. Gene sets associated with immune response are red. Data were analyzed by one-tailed Fisher’s exact test. b, GSEA for gene sets associated with the dsRNA-sensing endosomal vacuolar pathway. Data were analyzed by one-tailed Fisher’s exact test. c, GSEA for gene sets associated with cellular response to dsRNA. Data were analyzed by one-tailed Fisher’s exact test. d, Cellular dsRNA was evaluated by anti-dsRNA (J2) immunofluorescence; scale bar, 10 μm. The images shown are representative of n = 3 independent experiments. e, Quantification of cytoplasmic dsRNA signal intensity; AU, arbitrary units. Data are shown as mean ± s.d.; n = 3 independent biological experiments of at least 85 cells per group analyzed. Data were analyzed by one-way ANOVA with Dunnett’s test for multiple comparisons. Source data
Fig. 6
Fig. 6. MS023 activates dsRNA sensors to induce IFN signaling.
a, The expression of IFIH1 and indicated IFN-responsive genes in scramble-treated (shCTL), MS023-treated and IFIH1-knockdown/MS023-treated MDA-MB-468 cells analyzed by qRT–PCR. b, The expression of DDX58 and indicated IFN-responsive genes in scramble-treated, MS023-treated and DDX58-knockdown/MS023-treated MDA-MB-468 cells analyzed by qRT–PCR. c, The expression of TLR3 and indicated IFN-responsive genes in scramble-treated, MS023-treated and TLR3-knockdown/MS023-treated MDA-MB-468 cells analyzed by qRT–PCR. Data in ac are shown as mean ± s.d. (n = 3) and were analyzed by one-way ANOVA with Dunnett’s test for multiple comparisons. d, Cell confluence of scramble-treated, IFIH1-knockdown, DDX58-knockdown and TLR3-knockdown MDA-MB-468 cells. Data are shown as mean ± s.d. (n = 4) and were analyzed by one-way ANOVA with Dunnett’s test for multiple comparisons. e, Cell confluence of scramble-treated, MS023-treated and IFIH1-knockdown/MS023-treated MDA-MB-468 cells. f, Cell confluence of scramble-treated, MS023-treated and DDX58-knockdown/MS023-treated MDA-MB-468 cells. g, Cell confluence of scramble-treated, MS023-treated and TLR3-knockdown/MS023-treated MDA-MB-468 cells. Data in eg are shown as mean ± s.d. (n = 4) and were analyzed by two-way ANOVA with Dunnett’s test for multiple comparisons. h, Bar plot showing the number of ASEs belonging to each of the main alternative splicing categories. i, Bar plot showing the count of IR pairs in which the intron intersects with only the first Alu in the pair (1; white), with only the second Alu in the pair (2; gray) or with the two Alus in the pair (1/2; red). j, qRT–PCR analysis of the indicated genes after J2 immunoprecipitation. Data are shown as mean ± s.d. (n = 4) and were analyzed by one-way ANOVA with Dunnett’s test for multiple comparisons; ssRNA, single-stranded RNA. Source data
Extended Data Fig. 1
Extended Data Fig. 1. Dependency and expression of PRMTs across TNBC cell lines.
a. Flow chart of the epigenetic-focused chemical screen: 36 epigenetic probes at 5 μM were tested in the indicated cell lines and images were recorded by an Incucyte Zoom System in order to calculate cell proliferation rate. b. A representative experiment showing effects of in vitro treatment of MDA-MB-436 cells with indicated compound. Images were captured by an Incucyte Zoom. Scale bar represents 300 µM (representative n = 4 independent experiments). c. Essential score of PRMT1 in MS023 sensitive and resistant cell lines (mean ± s.d., n = 4 independent TNBC cell line per group, Student’s two-tailed t-test). d. Essential score of PRMT1 in breast cancer cell lines (n = 32 breast cancer cell lines were tested). e. Protein expression of Type I PRMTs including PRMT1, PRMT3 and PRMT8 in Cancer Dependency Map dataset (https://depmap.org/portal/) datasets. Protein expression is reported as log2 ratio. In the boxplots, the centre lines mark the median, the box limits indicate the 25th and 75th percentiles, and the whiskers extend to 1.5× the interquartile range from the 25th and 75th percentiles (n = 11 TNBC cell line per group, unpaired two-tailed Student’s t-test). Source data
Extended Data Fig. 2
Extended Data Fig. 2. PRMT1 inhibition suppresses cell growth in a subset of TNBC cell lines.
a. Growth curves of 17 TNBC cell lines with MS023 at indicated concentrations for 5 days treatment (means±s.d., n = 4). b. Cell confluency of TNBC cells with 5 μM GSK3368715 treatment for 5 days (means±s.d., n = 3). c. Immunoblots showing two more shRNA knockdown of PRMT1 in both MDA-MB-468 and Hs578-T cells (representative of n = 3 independent experiments). d. Normalized cell confluence of PRMT1 knockdown for the indicated time post doxycycline induction (means±s.d., n = 4, two-way ANOVA with Dunnett’s test for multiple comparisons, ns: not significant). e. Growth curves of 4 TNBC cell lines with MS023 at indicated concentrations for 5 days treatment (means±s.d., n = 4). f. Representative immunoblots showing shRNA knockdown of PRMT1 in TNBC cell lines (red: MS023 sensitive; black: MS023 resistant) (representative of n = 3 independent experiments). g. Normalized cell confluence of PRMT1 knockdown for the indicated time post doxycycline induction (means±s.d., n = 4, two-way ANOVA with Dunnett’s test for multiple comparisons, ns: not significant). h. Body weights measurement of individual mouse over the course of treatment with control or MS023 (means±s.d., n = 3). Source data
Extended Data Fig. 3
Extended Data Fig. 3. No significant identified molecular signature correlates with MS023 sensitivity in TNBC.
a. Correlation of MTAP expression and MS023 sensitivity. b. Oncoplot showing the mutation status of genes involved in RNA splicing across TNBC cell lines. Color indicates different mutation type. Arrow indicates the sensitivity of cell lines to MS023 treatment. c. PRMT5 gene expression in the Princess Margaret Hospital cell line datasets (PM-Cell lines) datasets. Gene expression is reported as log2(TPM + 0.001). d. PRMT5 protein expression in TNBC cell lines. Arrow indicates the sensitivity of cell lines to MS023 treatment. e. Correlation of cell doubling time and MS023 sensitivity. Source data
Extended Data Fig. 4
Extended Data Fig. 4. Type I PRMT inhibition stimulates interferon responses in a subset of TNBC cell lines.
a. Flow cytometry cell cycle analysis for MDA-MB-468 cells cultured with or without MS023 for 5 days (means±s.d., n = 3, two-way ANOVA with Dunnett’s test for multiple comparisons, ns: not significant). b. GSEA of the apoptosis pathway in MDA-MB-468 cells after MS023 treatment for 5 days. (one-tailed Fisher’s exact test for multiple comparisons). c. Apoptotic cell counts of MS023 treated for 5 days by caspase 3/7 staining (means±s.d., n = 3, two-sided Student’s t test). d. Volcano plot of log2 fold change for genes significantly upregulated (red in the right panel) or downregulated (blue in left panel) upon MS023 treatment (n = 3) in Hs578-T cell line (unpaired two-tailed Student’s t-test). e. Gene set enrichment analysis (GSEA) of all ranked differential expressed genes in Hs578-T after 5 days MS023 treatment (one-tailed Fisher’s exact test for multiple comparisons). f. Growth curves of MDA-MB-468 cell with indicated concentration of MS023 for 2 days culture (means±s.d., n = 4). g. Top 10 gene set enrichment analysis (GSEA) of all ranked differential expressed genes in MDA-MB-468 after 2 days MS023 treatment. h. Representative immunoblots showing DNA damage after MS023 treatment for 2 days (one of three independent experiments are shown). i. Quantification of cytoplasmic dsRNA signal intensity in MDA-MB-468 cells with indicated compound treatment for 2 days (means±s.d., n = 3 independent biologically experiments of at least 86 cells per group, one-way ANOVA with Dunnett’s test for multiple comparisons). Source data
Extended Data Fig. 5
Extended Data Fig. 5. MS023 triggers interferon response through dsRNA accumulation.
a. Upregulated gene sets enriched in Hs578-T cell after MS023 treatment for 5 days. Gene sets associated with immune response are red (one-tailed Fisher’s exact test). b. Quantification of cytoplasmic dsRNA signal intensity in MDA-MB-468 cells with indicated compound or shPRMT1 for 5 days (means±s.d., n = 3 independent biologically experiments of at least 91 cells per group analyzed). c. Quantification of cytoplasmic dsRNA signal intensity in HCC1143 cells with indicated compound treatment for 5 days (means±s.d., n = 3 independent biologically experiments of at least 70 cells per group analyzed). d. Quantification of cytoplasmic dsRNA signal intensity in SUM149-PT cells with indicated compound treatment for 5 days (means±s.d., n = 3 independent biologically experiments of at least 70 cells per group analyzed). e. Images of cellular dsRNA staining in Hs578-T cell after MS023 treatment for 5 days. Scale bar represents 10 μm (Representative images of 3 independent experiments are shown). f. Quantification of cytoplasmic dsRNA signal intensity in Hs578-T cell after MS023 treatment for 5 days (means±s.d., n = 3 of at least 40 cells per group analyzed, one-way ANOVA with Dunnett’s test). g. Quantification of cytoplasmic dsRNA signal intensity in Hs578-T cells with indicated compound or shPRMT1 for 5 days (means±s.d., n = 3 independent biologically experiments of at least 45 cells per group analyzed). h. Quantification of cytoplasmic dsDNA signal intensity in MDA-MB-468 cells with indicated compound treatment for 5 days (means±s.d., n = 3 independent biologically experiments of at least 120 cells per group analyzed). i. Quantification of cytoplasmic dsDNA signal intensity in Hs578-T cells with indicated compound treatment for 5 days (means±s.d., n = 3 independent biologically experiments of at least 43 cells per group analyzed). For panels b-d, and g-i, P values were calculated using one-way ANOVA with Dunnett’s test for multiple comparisons. Source data
Extended Data Fig. 6
Extended Data Fig. 6. Retained introns contribute to dsRNA accumulation in MS023 sensitive cells.
a. Volcano plot depicting expression changes of transposable elements in MDA-MB-468 cells after MS023 treatment for 5 days (unpaired two-tailed Student’s t-test). b. Heatmap depicting expression changes of transposable elements in MDA-MB-468 cells after MS023 treatment for 5 days (unpaired two-tailed Student’s t-test). c. Predicted PSI (percent spliced in) of indicated genes in MDA-MB-468 cells with indicated treatment for 5 days. d. PSI values derived from RT-PCR analysis for indicated genes from MDA-MB-468 cells after MS023 treatment for 5 days (means±s.d., n = 3, one-way ANOVA with Dunnett’s test for multiple comparisons). e. Barplot showing the number of alternative splicing events belonging to each of the main ASEs in Hs578-T cells with MS023 treatment for 5 days. f. Barplot showing the count of inverted-repeat (IR)-pairs in which the intron intersects with only the first Alu in the pair (1; white), or the only the second Alu in the pair (2; grey), or the two Alus in the pair (1/2; red). Source data
Extended Data Fig. 7
Extended Data Fig. 7. No correlation between IR-Alus induced dsRNA and basal IFN signature.
a. Quantification of cytoplasmic dsRNA signal intensity across four TNBC cell lines (means±s.d., n = 3 independent biologically experiments of at least 85 cells per group analyzed). b. Distribution of dPSI for classes of alternative splicing events that correlates with MS023 sensitivity. Each dot represents a potential splicing event from n = 3 biological independent experiments. In the boxplots, the centre lines mark the median, the box limits indicate the 25th and 75th percentiles, and the whiskers extend to 1.5× the interquartile range from the 25th and 75th percentiles (unpaired two-tailed Student’s t-test). Source data

Comment in

  • Putting introns on retainer.
    Srour N, Richard S. Srour N, et al. Nat Chem Biol. 2022 Aug;18(8):795-796. doi: 10.1038/s41589-022-01025-3. Nat Chem Biol. 2022. PMID: 35578033 No abstract available.

References

    1. Siegel RL, Miller KD, Jemal A. Cancer statistics, 2019. CA Cancer J. Clin. 2019;69:7–34. doi: 10.3322/caac.21551. - DOI - PubMed
    1. Bianchini G, De Angelis C, Licata L, Gianni L. Treatment landscape of triple-negative breast cancer—expanded options, evolving needs. Nat. Rev. Clin. Oncol. 2022;19:91–113. doi: 10.1038/s41571-021-00565-2. - DOI - PubMed
    1. Kim C, et al. Chemoresistance evolution in triple-negative breast cancer delineated by single-cell sequencing. Cell. 2018;173:879–893. doi: 10.1016/j.cell.2018.03.041. - DOI - PMC - PubMed
    1. Arrowsmith CH, Bountra C, Fish PV, Lee K, Schapira M. Epigenetic protein families: a new frontier for drug discovery. Nat. Rev. Drug Discov. 2012;11:384–400. doi: 10.1038/nrd3674. - DOI - PubMed
    1. Burridge S. Drugging the epigenome. Nat. Rev. Drug Discov. 2013;12:92–93. doi: 10.1038/nrd3943. - DOI - PubMed

Publication types

MeSH terms