. 2022 May 16;27(1):39.
doi: 10.1186/s11658-022-00331-x.

Identification and validation of an eight-lncRNA signature that predicts prognosis in patients with esophageal squamous cell carcinoma

Affiliations

Identification and validation of an eight-lncRNA signature that predicts prognosis in patients with esophageal squamous cell carcinoma

Jinfeng Zhang et al. Cell Mol Biol Lett. .

Abstract

Background: Esophageal squamous cell carcinoma (ESCC) is correlated with worse clinical prognosis and lacks available targeted therapy. Thus, identification of reliable biomarkers is required for the diagnosis and treatment of ESCC.

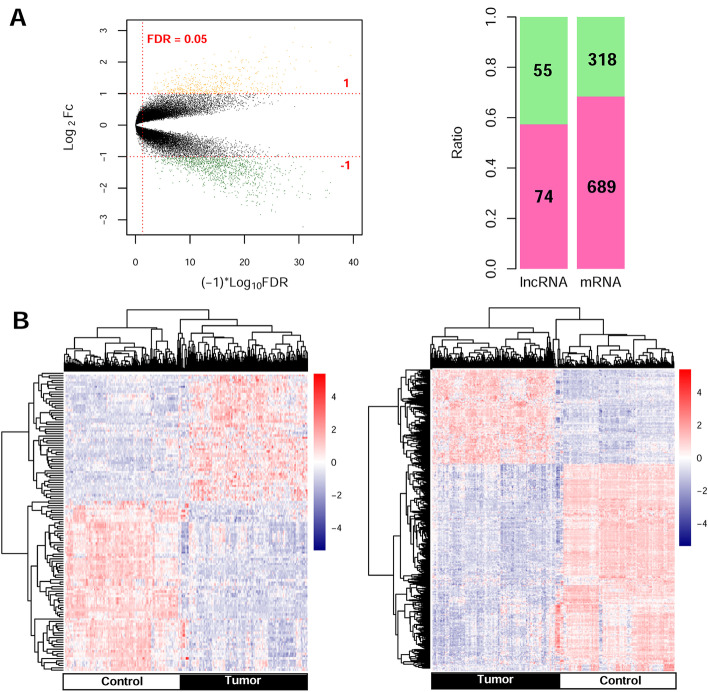
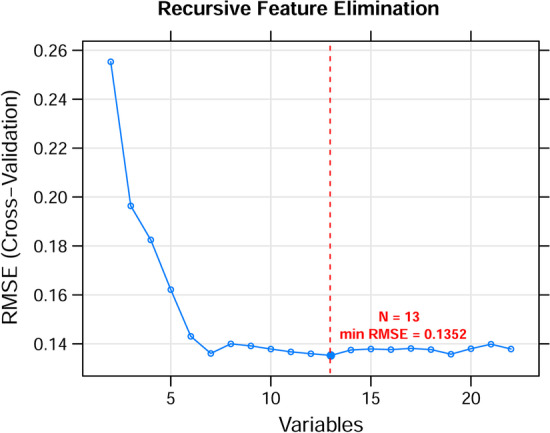
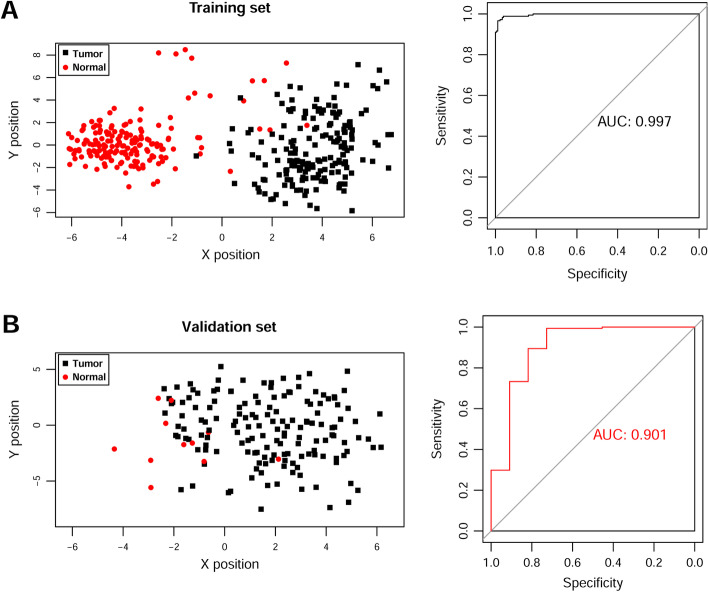
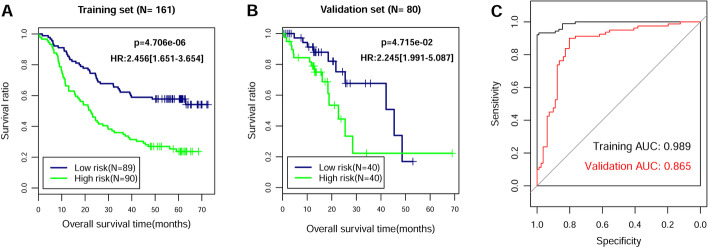
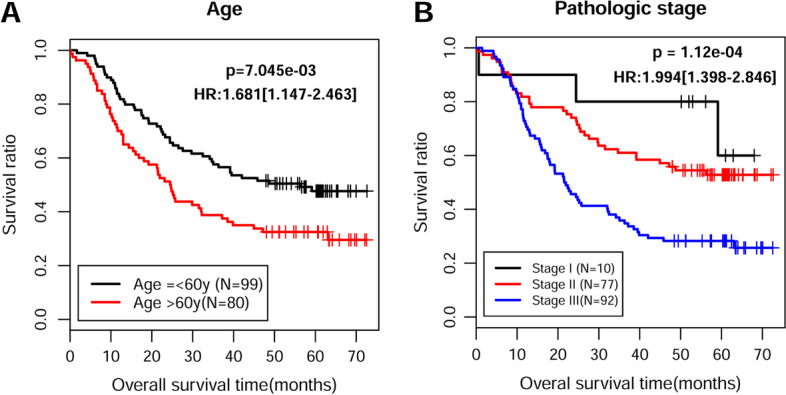
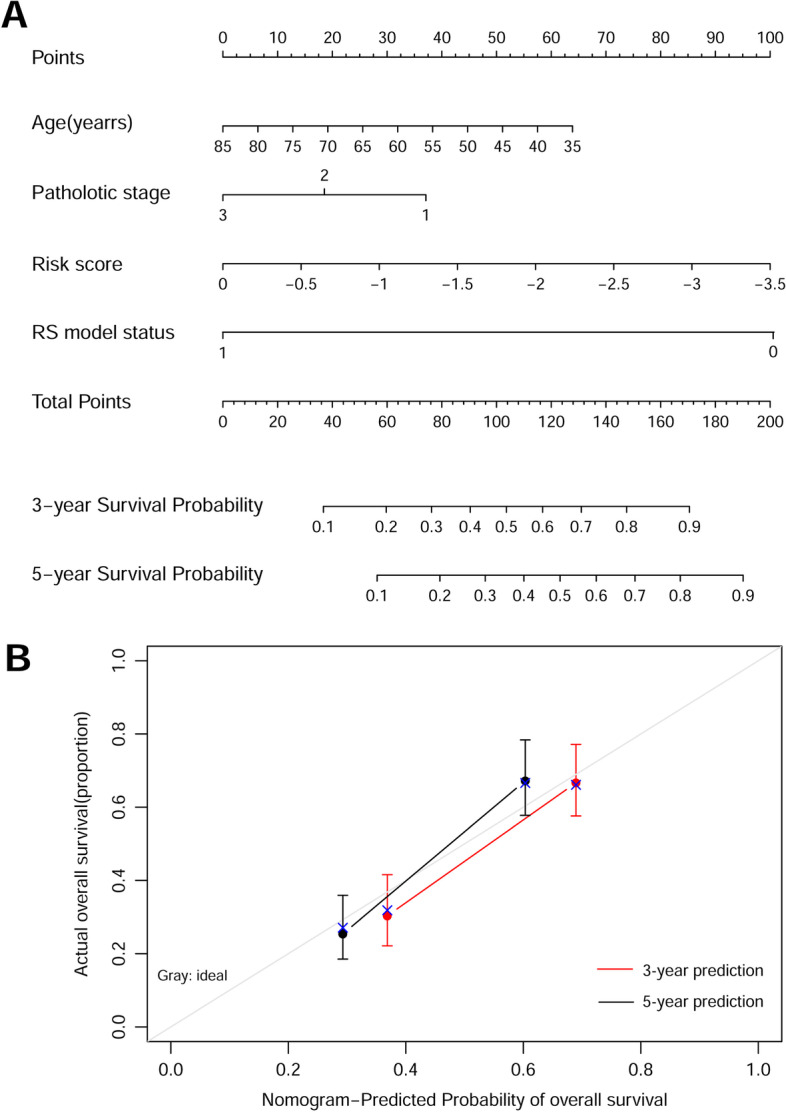
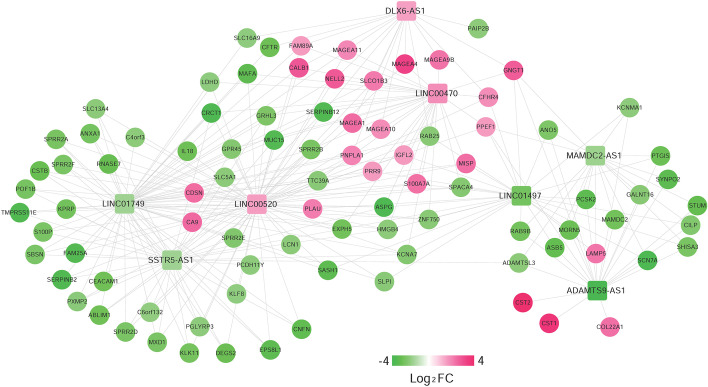
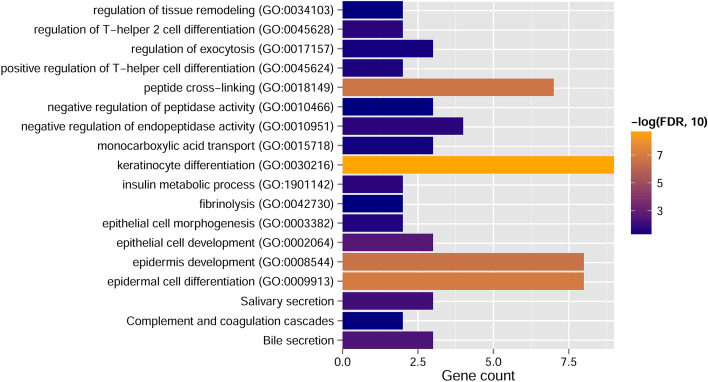
Methods: We downloaded the GSE53625 dataset as a training dataset to screen differentially expressed RNAs (DERs) with the criterion of false discovery rate (FDR) < 0.05 and |log2fold change (FC)| > 1. A support vector machine classifier was used to find the optimal feature gene set that could conclusively distinguish different samples. An eight-lncRNA signature was identified by random survival forest algorithm and multivariate Cox regression analysis. The RNA sequencing data from The Cancer Genome Atlas (TCGA) database were used for external validation. The predictive value of the signature was assessed using Kaplan-Meier test, time-dependent receiver operating characteristic (ROC) curves, and dynamic area under the curve (AUC). Furthermore, a nomogram to predict patients' 3-year and 5-year prognosis was constructed. CCK-8 assay, flow cytometry, and transwell assay were conducted in ESCC cells.

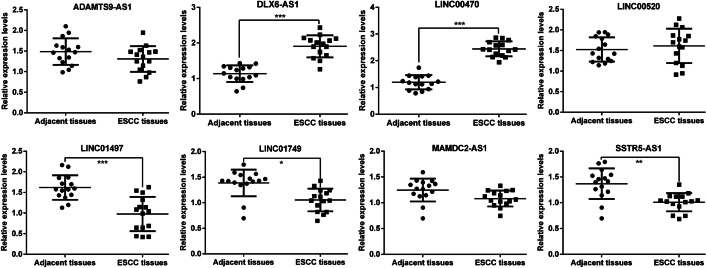
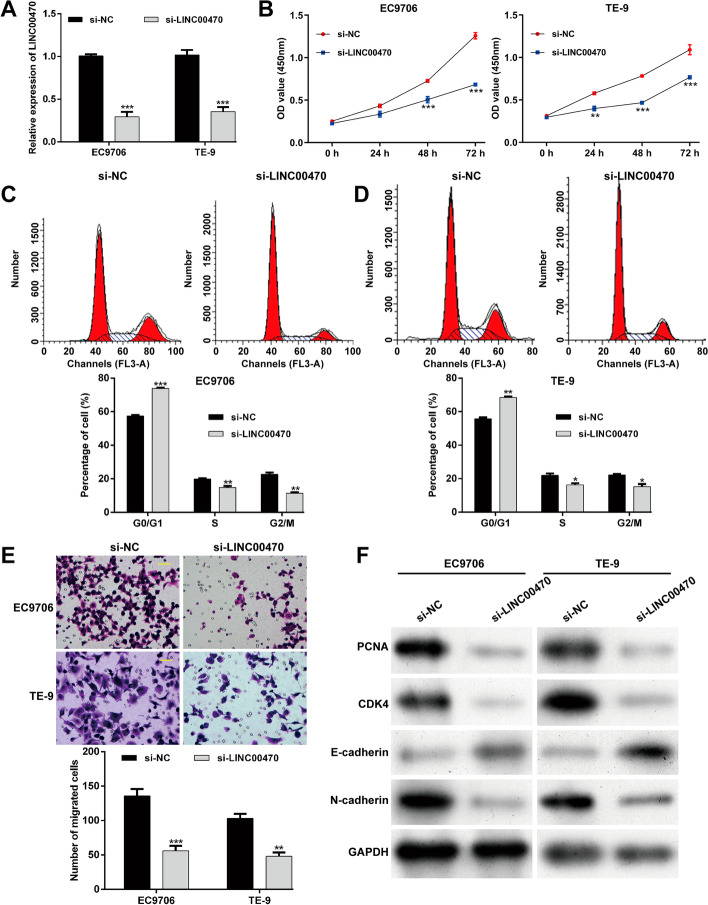
Results: A total of 1136 DERs, including 689 downregulated mRNAs, 318 upregulated mRNAs, 74 downregulated lncRNAs and 55 upregulated lncRNAs, were obtained in the GES53625 dataset. From the training dataset, we identified an eight-lncRNA signature, (ADAMTS9-AS1, DLX6-AS1, LINC00470, LINC00520, LINC01497, LINC01749, MAMDC2-AS1, and SSTR5-AS1). A nomogram based on the eight-lncRNA signature, age, and pathologic stage was developed and showed good accuracy for predicting 3-year and 5-year survival probability of patients with ESCC. Functionally, knockdown of LINC00470 significantly suppressed cell proliferation, G1/S transition, and migration in two ESCC cell lines (EC9706 and TE-9). Moreover, knockdown of LINC00470 downregulated the protein levels of PCNA, CDK4, and N-cadherin, while upregulating E-cadherin protein level in EC9706 and TE-9 cells.

Conclusion: Our eight-lncRNA signature and nomogram can provide theoretical guidance for further research on the molecular mechanism of ESCC and the screening of molecular markers.

Keywords: Esophageal squamous cell carcinoma; Long noncoding RNA; Nomogram; Signature.


Conflict of interest statement

The authors declare no competing interests.

Figures

Fig. 1
Fig. 1
Volcano plot and bidirectional hierarchical clustering heatmap. A Left: volcano plot depicting the DEGs; the X-axis represents the log-transformed values of false discovery rates, and the Y-axis indicates the average differences in gene expression. Green and orange dots indicate the down- and upregulated DEGs in tumor. The red horizontal dotted line indicates FDR < 0.05, and two red vertical dashed lines indicate |log2FC|> 1. Right: proportional distribution bar chart of DElncRNAs and DEmRNAs; pink and green represent the significantly upregulated and downregulated percentages of DERs, respectively. B Bidirectional hierarchical clustering heat map based on DERs (left lncRNA, right mRNA) expression levels; the white and black samples below represent control and tumor samples, respectively
Fig. 2
Fig. 2
The RMSE curves of the optimal gene combination based on RFE algorithm. The horizontal axis represents the number of lncRNAs variables, and the vertical axis represents cross-validation RMSEs. The marked place is the number of lncRNAs required to obtain the optimal value
Fig. 3
Fig. 3
Classification efficiency of the optimum feature genes in the SVM model. The scatter diagram (left picture) and area under the ROC curve (right picture) in the GSE53625 training set A and TCGA validation set B are shown, respectively. Green dots and red squares represent nonmutated and mutated AML samples, respectively. The X and Y axes represent the coordinate vector positions of the sample points, respectively
Fig. 4
Fig. 4
Validation of the eight-lncRNA signature. On the basis of the RS prediction model, prognostic-related Kaplan–Meier curves were drawn in training set (A) and validation set (B). The blue and green curves represent low- and high-risk group, respectively. C The ROC curve of RS prediction model; black and red curves represent the ROC curves of training set and verification set, respectively
Fig. 5
Fig. 5
Screening of prognosis-related clinical characteristics by Kaplan–Meier analyses. A Kaplan–Meier curves based on different age. The black curve represents patients (≤ 60 years), and red curve represents patients (> 60 years). B Kaplan–Meier curves based on different pathologic stages. The black, red, and blue curves represent pathologic I, II, and III sample group, respectively
Fig. 6
Fig. 6
Construction of a nomogram for overall survival prediction in ESCC. A Nomogram survival prediction model consists of age, pathologic stage, and RS model status based on the eight-lncRNA signature. B A nomogram to predict survival probability at 3 and 5 years after surgery for patients with ESCC, which was compared with actual overall survival in patients with ESCC. The horizontal axis represents the predicted overall survival rate, and the vertical axis represents the actual overall survival rate. The line segments at both ends represent the survival rate obtained in the group with the highest consistency between the predicted and observed values. The red and black lines represent the 3- and 5-year prediction line charts, respectively
Fig. 7
Fig. 7
Co-expression network of 8 signature lncRNAs and 74 PDEmRNAs. The change of color from light to dark indicates the change of differential log2FC from low to high. Square and circle indicate signature lncRNA and PDEmRNAs, respectively
Fig. 8
Fig. 8
Column diagram of GO and KEGG enrichment analysis. The horizontal axis represents the number of genes, and the vertical axis represents the item name. The color of the column represents the enrichment significance. The closer the color to orange, the higher the significance
Fig. 9
Fig. 9
The expression levels of eight signature lncRNAs in ESCC tissues. Quantitative real-time PCR analysis was conducted to determine the expression levels of ADAMTS9-AS1, DLX6-AS1, LINC00470, LINC00520, LINC01497, LINC01749, MAMDC2-AS1, and SSTR5-AS1 in 15 pairs of ESCC tissues and matched adjacent tissues
Fig. 10
Fig. 10
Knockdown of LINC00470 suppresses ESCC cell proliferation, G1/S transition, and migration in vitro. A Transfection with si-LINC00470 dramatically suppressed LINC00470 expression in EC9706 and TE-9 cells. B CCK-8 assay showed that knockdown of LINC00470 resulted in growth retardation of EC9706 and TE-9 cells. Flow cytometry assay was conducted to analyze cell cycle distribution in transfected EC9706 C and TE-9 D cells. E Cell migration was evaluated in transfected EC9706 and TE-9 cells by transwell assay. Magnification, ×200; scale bar, 100 μm. F Western blot analysis was performed to determine the protein levels of PCNA, CDK4, E-cadherin, and N-cadherin in EC9706 and TE-9 cells. Data are expressed as mean ± SD. **p < 0.01, ***p < 0.001, compared with si-NC

References

    1. Bray F, Ferlay J, Soerjomataram I, Siegel RL, Torre LA, Jemal A. Global cancer statistics 2018: GLOBOCAN estimates of incidence and mortality worldwide for 36 cancers in 185 countries. CA Cancer J Clin. 2018;68(6):394–424. - PubMed
    1. Arnold M, Soerjomataram I, Ferlay J, Forman D. Global incidence of oesophageal cancer by histological subtype in 2012. Gut. 2015;64(3):381–387. - PubMed
    1. Herszenyi L, Tulassay Z. Epidemiology of gastrointestinal and liver tumors. Eur Rev Med Pharmacol Sci. 2010;14(4):249–258. - PubMed
    1. Wang WL, Chang WL, Yang HB, Wang YC, Chang IW, Lee CT, et al. Low disabled-2 expression promotes tumor progression and determines poor survival and high recurrence of esophageal squamous cell carcinoma. Oncotarget. 2016;7(44):71169–71181. - PMC - PubMed
    1. Aquino JL, Said MM, Pereira DA, Cecchino GN, Leandro-Merhi VA. Complications of the rescue esophagectomy in advanced esophageal cancer. Arq Bras Cir Dig. 2013;26(3):173–178. - PubMed

MeSH terms