. 2022 May 5:2022:8338137.
doi: 10.1155/2022/8338137. eCollection 2022.

Immune Subtype Profiling and Establishment of Prognostic Immune-Related lncRNA Pairs in Human Ovarian Cancer

Affiliations

Immune Subtype Profiling and Establishment of Prognostic Immune-Related lncRNA Pairs in Human Ovarian Cancer

Xingling Wang et al. Comput Math Methods Med. .

Retraction in

Abstract

This study collected immune-related genes (IRGs) and used gene expression data from TCGA database to construct a molecular subtype of ovarian cancer (OV) based on immune-related lncRNA gene pairs (IRLnc_GPs). The relationships between molecular subtypes and prognosis and clinical characteristics were further explored. IRGs were acquired from the ImmPort database, and round-robin pairing of immune-related lncRNAs was performed. The NMF algorithm was used to identify molecular subtypes, and the immune score of a single sample was calculated through ESTIMATE, TIMER, ssGSEA, MCPcounter, and CIBERSORT. The relationship between molecular subtypes and immune microenvironments was identified. A hypergeometric test was used to test the lncRNA pairs among the OV molecular subtypes (C1 and C2 subtypes). The BH method was used to screen the different lncRNA pairs, and a predictive risk model was constructed and verified. Finally, correlation analysis between the risk model, immune checkpoint genes, and chemotherapy drugs was carried out. Based on IRLnc_GP to classify 373 OV samples of TCGA, the samples were divided into two subtypes, and the prognosis between the subtypes showed significant differences. The C1 subtype with a poor prognosis was more related to the pathways of tumor occurrence and development. We identified 180 differential lncRNA pairs between subtypes and constructed a prognostic risk model based on 8 IRLnc_GPs. In the independent dataset, the distribution of subtypes in functional modules was different and highly repeatable. There were significant differences in the molecular and clinical characteristics of the subtypes and the drug sensitivity of immunotherapy/chemotherapy. In conclusion, the risk model established based on IRLnc_GP can better evaluate the prognosis of OV samples and can also assess the effects of different drug treatments in the high- and low-risk groups, providing new insights and ideas for the treatment of OV.


Conflict of interest statement

The authors declare that they have no competing interests.

Figures

Figure 1
Figure 1
Prognostic schemes related to the characteristics of immune gene-related lncRNA pairs in OV.
Figure 2
Figure 2
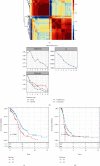
(a) Map showing NMF Clustering Consensus. (b) Cophenetic, RSS, and dispersion distributions with rank = 2‐10. (c) OS time prognostic survival curve for OV molecular subtypes. (d) Curve of prognosis for OV molecular subtypes according to PFS time.
Figure 3
Figure 3
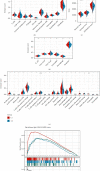
(a) Comparison of ssGSEA immune scores between the C1 and C2 groups. (b) Assessment of MCPcounter immune scores between the C1 and C2 groups. (c) Comparison of ESTIMATE immune scores between the C1 and C2 groups. (d) Comparison of TIMER immune scores between the C1 and C2 groups. (e) Comparison of CIBERSORT immune scores between the C1 and C2 groups. (f) Related pathways between molecular subtypes.
Figure 4
Figure 4
(a–d) Comparison of the distribution of different clinical characteristics (event, grade, stage, and age) between the two molecular subtypes in TCGA dataset.
Figure 5
Figure 5
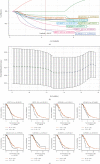
(a) The changing trajectory for each independent variable. The logarithm of the independent variable lambda is shown on the horizontal axis, and the coefficient of the independent variable is represented by the vertical axis of the graph. (b) The confidence interval for each lambda. (c) The 8 lncRNAs vs. the KM curve (on TCGA training set).
Figure 6
Figure 6
(a) ROC curve and AUC of RiskScore classification. (b) Survival curves for RiskScores calculated using KM in the training set. (c) ROC curve and AUC of RiskScore classification. (d) KM survival curve distribution of RiskScore in TCGA test set. (e) ROC curve and AUC of RiskScore classification. (f) KM survival curve distribution of RiskScore in all TCGA datasets from TCGA.
Figure 7
Figure 7
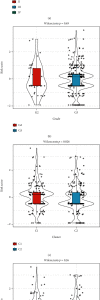
(a) Comparison of RiskScores between samples in the stage group. (b) Comparison of RiskScores between samples in the grade group. (c) Comparison of RiskScores between samples in the cluster group. (d) Comparison of RiskScores between samples in the age group.
Figure 8
Figure 8
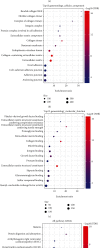
(a) BP annotation map of lncRNA to genes. (b) CC annotation map of lncRNA to genes. (c) MF annotation map of lncRNA to genes. (d) KEGG annotation map of lncRNA to genes.
Figure 9
Figure 9
(a) Clinical characteristics and RiskScore single-factor analysis results. (b) Clinical characteristics and RiskScore multifactor analysis results.
Figure 10
Figure 10
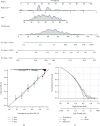
(a) Clinical features and risk-adjusted nomogram developed using RiskScore. (b, c) Nomogram of the survival rate correction chart.
Figure 11
Figure 11
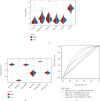
(a) Expression of immune checkpoint genes in the low- and high-risk groups. (b) Comparison of drug sensitivity between the low- and high-risk groups. (c) Clinical characteristics and the RiskScore ROC curve.

Similar articles

Cited by

References

    1. Momenimovahed Z., Tiznobaik A., Taheri S., Salehiniya H. Ovarian cancer in the world: epidemiology and risk factors. International Journal of Women's Health . 2019;Volume 11:287–299. doi: 10.2147/IJWH.S197604. - DOI - PMC - PubMed
    1. Coburn S. B., Bray F., Sherman M. E., Trabert B. International patterns and trends in ovarian cancer incidence, overall and by histologic subtype. International Journal of Cancer . 2017;140(11):2451–2460. doi: 10.1002/ijc.30676. - DOI - PMC - PubMed
    1. Torre L. A., Trabert B., DeSantis C. E., et al. Ovarian cancer statistics. CA: a Cancer Journal for Clinicians . 2018;68(4):284–296. doi: 10.3322/caac.21456. - DOI - PMC - PubMed
    1. Siegel R. L., Miller K. D., Jemal A. Cancer statistics, 2017. CA: a Cancer Journal for Clinicians . 2017;67(1):7–30. doi: 10.3322/caac.21387. - DOI - PubMed
    1. Mandilaras V., Garg S., Cabanero M., et al. TP53 mutations in high grade serous ovarian cancer and impact on clinical outcomes: a comparison of next generation sequencing and bioinformatics analyses. International Journal of Gynecological Cancer . 2019;29(2):346–352. doi: 10.1136/ijgc-2018-000087. - DOI - PubMed

Publication types