

Interleukin-38 promotes skin tumorigenesis in an IL-1Rrp2-dependent manner
- PMID: 35578812
- PMCID: PMC9171418
- DOI: 10.15252/embr.202153791
Interleukin-38 promotes skin tumorigenesis in an IL-1Rrp2-dependent manner
Abstract
Interleukin-38 (IL-38) is strongly associated with chronic inflammatory diseases; however, its role in tumorigenesis is poorly understood. We demonstrated that expression of IL-38, which exhibits high expression in the skin, is downregulated in human cutaneous squamous cell carcinoma and 7,12-dimethylbenzanthracene/12-O-tetradecanoyl phorbol-13-acetate-induced mouse skin tumorigenesis. IL-38 keratinocyte-specific knockout mice displayed suppressed skin tumor formation and malignant progression. Keratinocyte-specific deletion of IL-38 was associated with reduced expression of inflammatory cytokines, leading to reduced myeloid cell infiltration into the local tumor microenvironment. IL-38 is dispensable for epidermal mutagenesis, but IL-38 keratinocyte-specific deletion reduces proliferative gene expression along with epidermal cell proliferation and hyperplasia. Mechanistically, we first demonstrated that IL-38 activates the c-Jun N-terminal kinase (JNK)/activator protein 1 signal transduction pathway to promote the expression of cancer-related inflammatory cytokines and proliferation and migration of tumor cells in an IL-1 receptor-related protein 2 (IL-1Rrp2)-dependent manner. Our findings highlight the role of IL-38 in the regulation of epidermal cell hyperplasia and pro-tumorigenic microenvironment through IL-1Rrp2/JNK and suggest IL-38/IL-1Rrp2 as a preventive and potential therapeutic target in skin cancer.
Keywords: IL-1Rrp2; IL-38; skin carcinogenesis.
© 2022 The Authors.
Figures
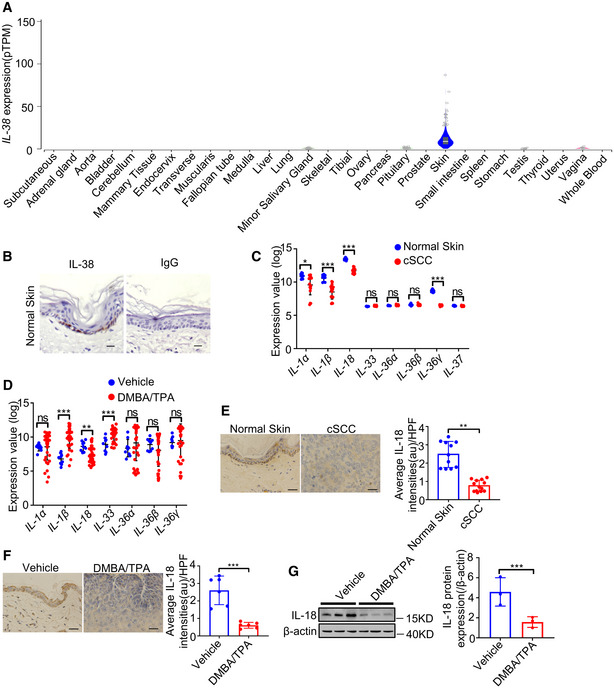
IL‐38 expression in various tissues sourced from control subjects (n = 6–860) using the GTEx database.
Representative immunohistochemical staining micrographs of IL‐38 and rabbit IgG in human normal skin. Scale bars represent 200 μm.
Relative expression of IL‐1 family members in human normal tissues (n = 9) and cSCC (n = 18) were analyzed using Geo Datasets (GSE98767).
Relative expression of IL‐1 family members in normal tissues (n = 9) and cSCC (n = 38) of mice analyzed using Geo Datasets (GSE63967).
Representative micrographs of human skin sections stained with anti‐IL‐18 antibody from normal patients (n = 11) and tumors of cSCC patients (n = 13). Scale bars represent 100 μm. The graph shows the quantification of mean IL‐18 expression per high‐powered field in tissues.
The dorsal hair of normal C57/BL6 mice was shaved and treated with DMBA/TPA twice a week for 32 weeks to induce skin tumors. Representative micrographs of mouse normal skin (n = 6) and tumor (n = 6) sections stained with anti‐IL‐18 antibody. Scale bars represent 100 μm. The graph shows the quantification of mean IL‐38 expression in tissues.
Representative western blot bands indicating IL‐18 in mouse normal skin (n = 3) and DMBA/TPA‐induced tumors (n = 3). The graph shows the quantification of mean IL‐18 expression in tissues. β‐actin blots of Figs EV1G and EV3F are derived from the same experiment.
- A
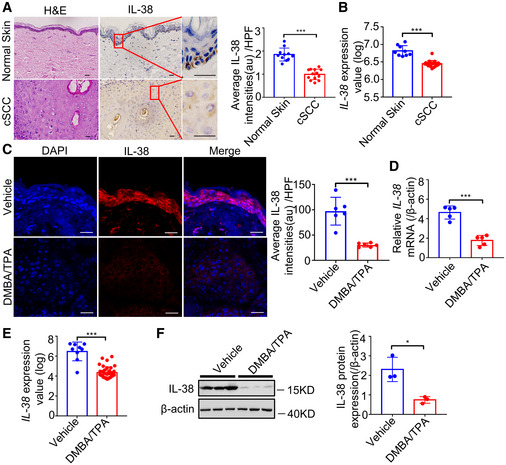
Representative micrographs of human skin sections stained with hematoxylin‐eosin (H&E) (left) and anti‐IL‐38 antibody (right) from normal patients (n = 11) and tumors of cSCC patients (n = 13). Scale bars represent 100 μm. The graph shows the quantification of mean IL‐38 expression per high‐powered field in tissues.
- B
Relative expression of IL‐38 in human normal tissues (n = 9) and cSCC (n = 18) was analyzed using Geo Datasets (GSE98767).
- C, D
The dorsal hair of normal C57/BL6 mice was shaved and treated with DMBA/TPA twice a week for 32 weeks to induce skin tumors. (C) Representative micrographs of mouse normal skin (n = 6) and tumor (n = 6) sections stained with anti‐IL‐38 antibody. The graph shows the quantification of mean IL‐38 expression per high‐powered field in tissues. Scale bars represent 100 μm. (D) Relative expression levels of Il‐38 in normal skin (n = 5) and tumors (n = 5) of mice were quantified using qPCR.
- E
Relative expression levels of Il‐38 in normal tissues (n = 9) and cSCC tissues (n = 38) of mice were analyzed using Geo Datasets (GSE63967).
- F
Representative western blot bands indicating IL‐38 in mouse normal skin (n = 3) and DMBA/TPA‐induced tumors (n = 3). The graph shows the quantification of mean IL‐38 expression in tissues.
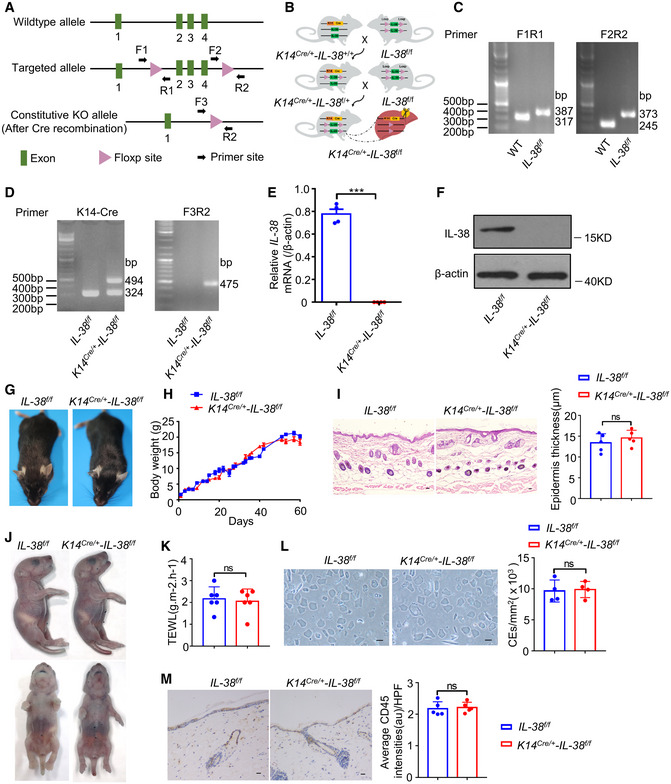
Construction of Il‐38‐loxP (Il‐38f / f ) mice.
Typical genetic cross scheme of keratinocyte IL‐38‐specific knockout (K14Cre /+ ‐Il‐38f / f ) mice.
PCR analysis of WT mice (at 317 and 245 bp) and Il‐38‐loxP mice (at 387 and 373 bp).
PCR analysis of keratin 14 promoter directing expression of Cre recombinase(left) and deletion of IL‐38 (right).
Relative expression of IL‐38 in the epidermal splits of Il‐38f / f (n = 4) and K14Cre /+ ‐Il‐38f / f (n = 4) mice.
Representative western blot bands indicating IL‐38 in the epidermal splits of Il‐38f / f and K14Cre /+ ‐Il‐38f / f mice.
Appearance of Il‐38f / f and K14Cre /+ ‐Il‐38f / f mice.
Cumulative body weight changes in Il‐38f / f (n = 12) and K14Cre /+ ‐Il‐38f / f (n = 12) mice in 60 days.
Representative histological photographs of skin stained with hematoxylin‐eosin (H&E) from Il‐38f / f (n = 5) and K14Cre /+ ‐Il‐38f / f (n = 5) mice. Scale bars represent 100 μm. The graph shows the quantification of epidermal thickness.
Skin barrier‐dependent dye exclusion assay using toluidine blue in Il‐38f / f mice (n = 5) and K14Cre /+ ‐Il‐38f / f littermate (n = 5) at birth.
TEWL assay measured on ventral surface of newborn Il‐38f / f mice (n = 6) and K14Cre /+ ‐Il‐38f / f littermate (n = 6).
Representative micrographs of cornified cell envelopes from Il‐38f / f (n = 4) and K14Cre /+ ‐Il‐38f / f (n = 4) mice. Scale bars represent 100 μm. The graph shows the number of cornified cell envelopes per square millimeter.
Representative immunohistochemical staining micrographs of CD45 in the skin of Il‐38f / f (n = 5) and K14Cre /+ ‐Il‐38f / f (n = 5) mice. Scale bars represent 100 μm. The graph shows average intensities of CD45 per high‐powered field.
- A
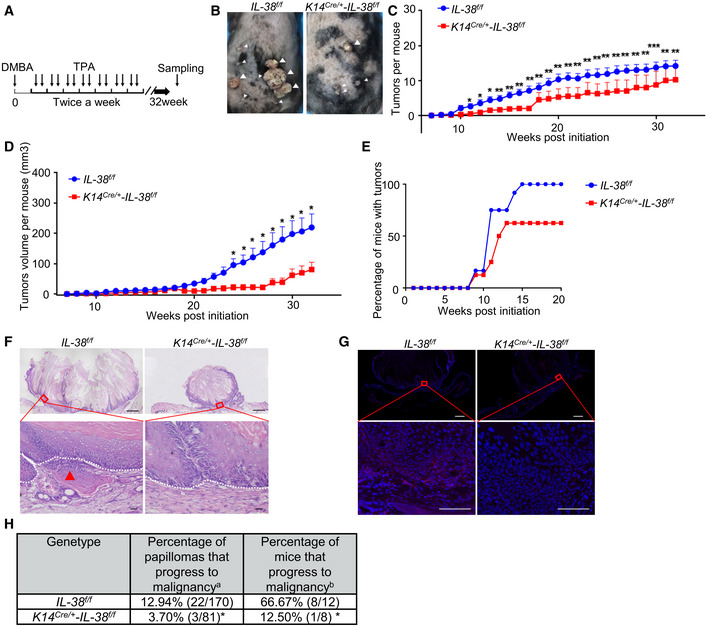
Timeline of DMBA/TPA treatment in two‐stage chemically induced skin tumor development protocol.
- B
Representative photographs of Il‐38f / f (n = 12) and K14Cre /+ ‐Il‐38f / f mice (n = 8) treated with DMBA/TPA for 32 weeks. White triangles indicate the tumors on the back of mice.
- C, D
Average tumor number (C) and volume (D) per mouse from Il‐38f / f (n = 12) and K14Cre /+ ‐Il‐38f / f mice (n = 8) treated with DMBA/TPA.
- E
Tumor bearing ratio of Il‐38f / f (n = 12) and K14Cre /+ ‐Il‐38f / f mice (n = 8) treated with DMBA/TPA.
- F
Representative histological micrographs stained with hematoxylin‐eosin (H&E) from tumors 32 weeks after initiation. Local micro‐invasive foci (red arrow) were often observed in tumors from K14Cre /+ ‐Il‐38f / f mice (lower panel). Dashed lines indicate the basement membrane. Areas indicated by boxes in the upper pictures are shown at higher magnification in the lower pictures. Top pictures, scale bars represent 800 μm; bottom pictures, scale bars represent 100 μm.
- G
Representative micrograph sections stained with K8 from tumors 32 weeks after initiation. Top pictures, scale bars represent 700 μm; bottom pictures, scale bars represent 100 μm.
- H
Malignant conversion rate of tumors 32 weeks after initiation. a = number of carcinomas/total number of tumors. b = number of mice with carcinomas/total number of mice.
- A–D
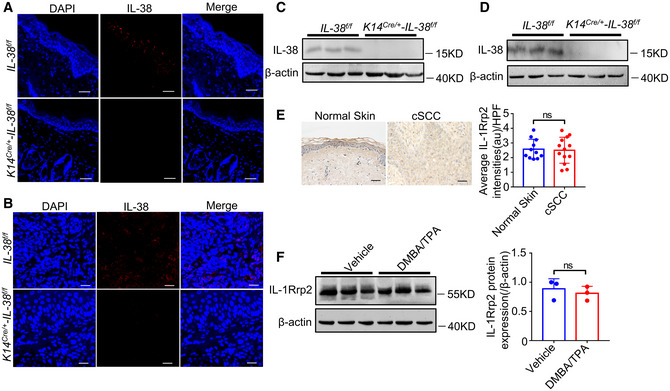
The dorsal hair of normal C57/BL6 mice was shaved and treated with DMBA/TPA twice a week for 3 weeks to induce the skin inflammation (A and C). (A) Representative immunofluorescent staining micrographs of IL‐38 in the skin of Il‐38f / f and K14Cre /+ ‐Il‐38f / f mice. Scale bars represent 100 μm. (C) Relative expression of IL‐38 in the skin of Il‐38f / f (n = 3) and K14Cre /+ ‐Il‐38f / f (n = 3) mice was detected by western blot. The dorsal hair of normal C57/BL6 mice was shaved and treated with DMBA/TPA twice a week for 32 weeks to induce the skin tumors (B and D). (B) Representative immunofluorescent staining micrographs of IL‐38 in the tumors of Il‐38f / f and K14Cre /+ ‐Il‐38f / f mice. Scale bars represent 100 μm. (D) Relative expression of IL‐38 in the tumors of Il‐38f / f (n = 3) and K14Cre /+ ‐Il‐38f / f (n = 3) mice was detected by western blot.
- E
Representative immunohistochemical staining micrographs of IL‐1Rrp2 from normal patients (n = 11) and tumors of cSCC patients (n = 13). Scale bars represent 100 μm. The graph shows average intensities of IL‐1Rrp2 per high‐powered field in tissues.
- F
Relative expression of IL‐1Rrp2 in mouse normal skin (n = 3) and DMBA/TPA‐induced tumors (n = 3). The graph shows the quantification of mean IL‐1Rrp2 expression in tissues.
- A
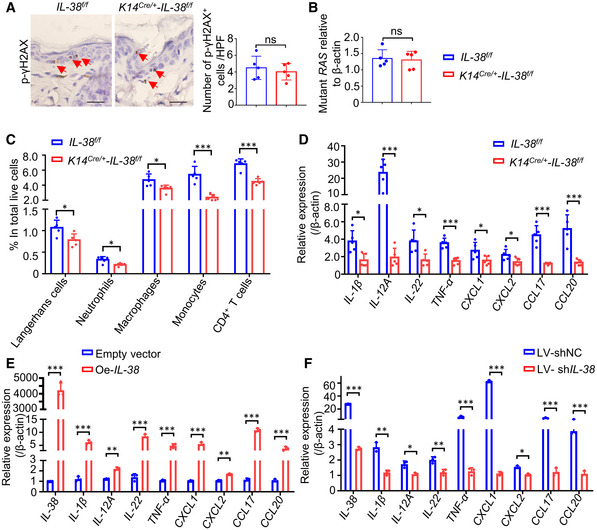
Representative immunohistochemical staining micrographs of γH2AX in the skin of Il‐38f / f (n = 5) and K14Cre /+ ‐Il‐38f / f (n = 5) mice after treated with DMBA for 24 h. Red triangles indicate the γH2AX+ positive cells. Scale bars represent 100 μm. The graph shows the number of γH2AX+ cells per high‐powered field.
- B
Taqman qPCR analysis of Hras codon‐61 mutations in DMBA‐treated skin of Il‐38f / f (n = 5) and K14Cre /+ ‐Il‐38f / f (n = 5) mice after treated with DMBA for 24 h.
- C, D
The dorsal hair of normal C57/BL6 mice was shaved and treated with DMBA/TPA twice a week for 3 weeks to induce the skin inflammation. (C) Percentage of skin‐infiltrating immune cell subsets within total live cells were determined using flow cytometry in DMBA/TPA‐treated Il‐38f / f (n = 5) and K14Cre /+ ‐Il‐38f / f mice (n = 5). (D) Relative expression levels of inflammatory mediators in the skin of DMBA/TPA‐treated Il‐38f / f (n = 5) and K14Cre /+ ‐Il‐38f / f mice (n = 5) were quantified using qPCR.
- E, F
Relative expression of inflammatory cytokines in A431 cells after Il‐38 overexpression (E) or knockdown (F) was detected using qPCR.
- A
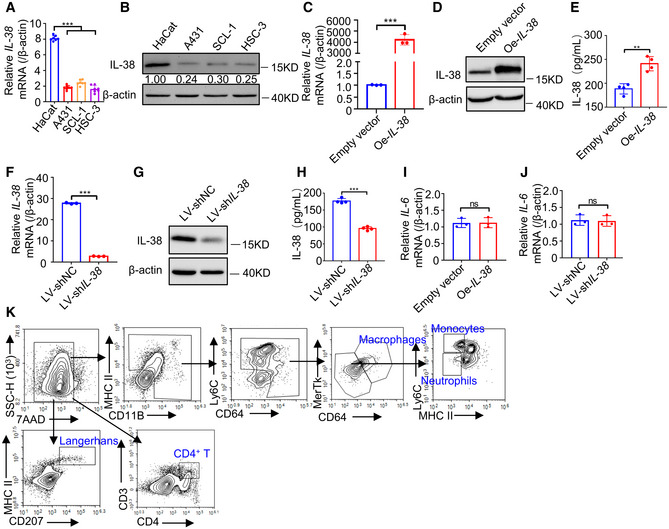
Relative expression of IL‐38 in normal skin cells (n = 7) and SCC cells (n = 7) determined using qPCR.
- B
Relative expression levels of IL‐38 in normal skin and SCC cells were detected using western blot.
- C–E
The IL‐38 overexpression cell line was constructed by transfecting A431 cells with the pcDNA3.1‐IL‐38 vector expressing IL‐38 and pcDNA3.1 empty vector. (C) Relative expression of IL‐38 was determined using qPCR. (D) Relative expression of IL‐38 was detected using western blotting. (E) The secretion of IL‐38 was measured using ELISA.
- F–H
Lentiviruses containing IL‐38 shRNA or Negative Control shRNA were used to infect A431 cells. (F) Relative expression of IL‐38 was determined using qPCR. (G) Relative expression of IL‐38 was detected using western blot. (H) IL‐38 secretion was measured using ELISA.
- I
Relative expression of IL‐6 in IL‐38‐overexpressed A431 cells (n = 3) was determined using qPCR.
- J
Relative expression of IL‐6 in IL‐38‐knockdown A431 cells (n = 3) was determined using qPCR.
- K
The flow cytometry gating strategy for immune cell detection in DMBA/TPA‐treated skin.
- A, B
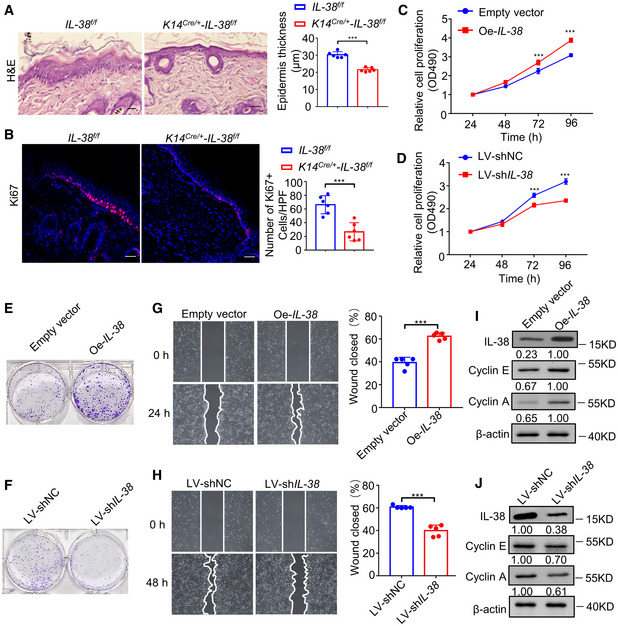
The dorsal hair of normal C57/BL6 mice was shaved and treated with DMBA/TPA twice a week for 3 weeks to induce the skin inflammation. (A) Representative micrograph sections stained with hematoxylin‐eosin (H&E) from the skin of Il‐38f / f (n = 6) and K14Cre /+ ‐Il‐38f / f mice (n = 6) Scale bars represent 100 μm. The graph shows average epidermal thickness. (B) Representative micrograph sections stained with anti‐Ki67 antibody from the skin of Il‐38f / f (n = 6) and K14Cre /+ ‐Il‐38f / f mice (n = 6). Scale bars represent 100 μm. The graph shows average numbers of Ki67+ cells per high‐powered field.
- C, D
Proliferation of A431 cells (n = 5) after overexpression (C) or knockdown (D) of IL‐38 was detected using cell proliferation detection reagent.
- E, F
Colony‐forming ability of A431 cells after IL‐38 overexpression (E) or knockdown (F) analyzed using the clone formation assay.
- G, H
Representative images of the scratch assay (left) and wound closure rate (right) of A431 cells (n = 5) after overexpression (G) or knockdown (H) of IL‐38.
- I, J
Representative western blot bands indicating cyclin E and cyclin A in A431 cells after IL‐38 overexpression (I) or knockdown (J).
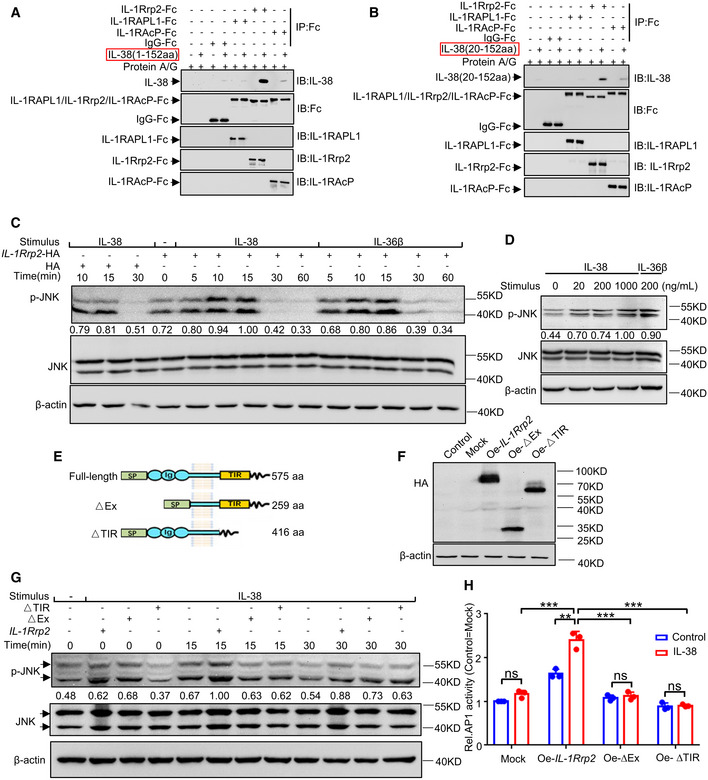
- A, B
Pull‐down assay of IL‐38 (1–152 aa) (A) or IL‐38 (20–152 aa) (B) with IL‐1Rrp2‐Fc, IL‐1RAPL1‐Fc, IL1RAcp‐Fc, and IgG‐Fc fusion proteins.
- C
Cell extracts prepared from 293T cells transfected with a mock mammalian expression vector (left) or an expression vector encoding IL‐1Rrp2 (right) were probed using anti‐phospho‐JNK, anti‐JNK, or anti‐β‐actin antibodies after stimulation with IL‐38 (200 ng/ml) or IL‐36β (200 ng/ml) at different times.
- D
Cell extracts prepared from 293T cells transfected with an expression vector encoding IL‐1Rrp2 were probed using anti‐phospho‐JNK, anti‐JNK, or anti‐β‐actin antibodies after stimulation with IL‐38 at different concentrations.
- E
Schematic structures of full‐length IL‐1Rrp2 and its deletion mutants. Lengths are indicated in amino acids (aa). SP, signal peptide; Ig, immunoglobulin domain; TIR, TIR domain.
- F
Cell extracts prepared from 293T cells transfected with HA‐tagged full‐length or deletion mutants of IL‐1Rrp2, were probed using anti‐HA or anti‐β‐actin antibodies. Oe, overexpression.
- G
Cell extracts prepared from 293T cells transfected with full‐length or deletion mutants of IL‐1Rrp2 were probed using anti‐phospho‐JNK, anti‐JNK, or anti‐β‐actin antibodies after stimulation with IL‐38 (200 ng/ml) at different times.
- H
After transfection with the full‐length or deletion mutants of IL‐1Rrp2 overexpression plasmid, 293T cells were treated with IL‐38 (200 ng/ml) for an additional 6 h and AP‐1 activity was measured using a luciferase reporter assay.
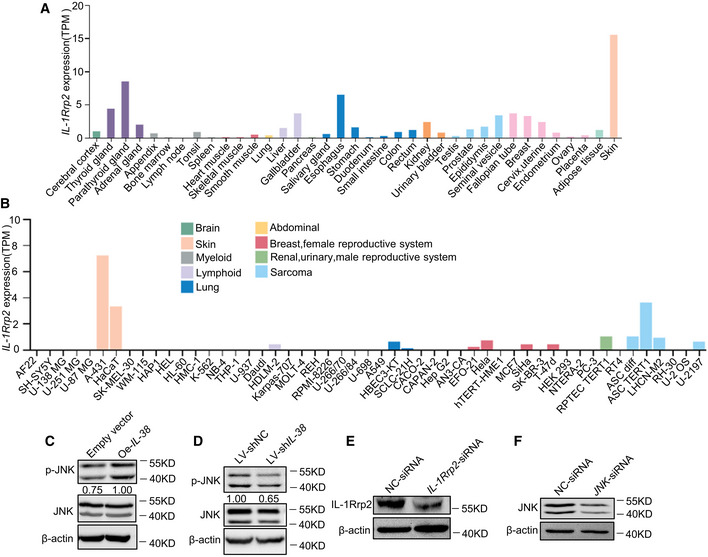
- A, B
Relative expression of IL‐1Rrp2 in human normal tissues (A) or cell lines (B) based on TPM values. Data were obtained from the Human Protein Atlas Dataset available from proteinatlas.org.
- C
Cell extracts prepared from A431 cells transfected with a mock mammalian expression vector (left) or an expression vector encoding IL‐38 (right), were blotted with anti‐phospho‐JNK, anti‐JNK, or anti‐β‐actin antibodies.
- D
Cell extracts prepared from A431 cells infected with lentiviruses containing Negative Control shRNA (left) or IL‐38 shRNA (right) were probed using anti‐phospho‐JNK, anti‐JNK, or anti‐β‐actin antibodies.
- E
The expression of IL‐1Rrp2 in A431 cells transfected with IL‐1Rrp2‐siRNA was detected using western blot.
- F
The expression of JNK in A431 cells transfected with JNK‐siRNA was detected using western blot.
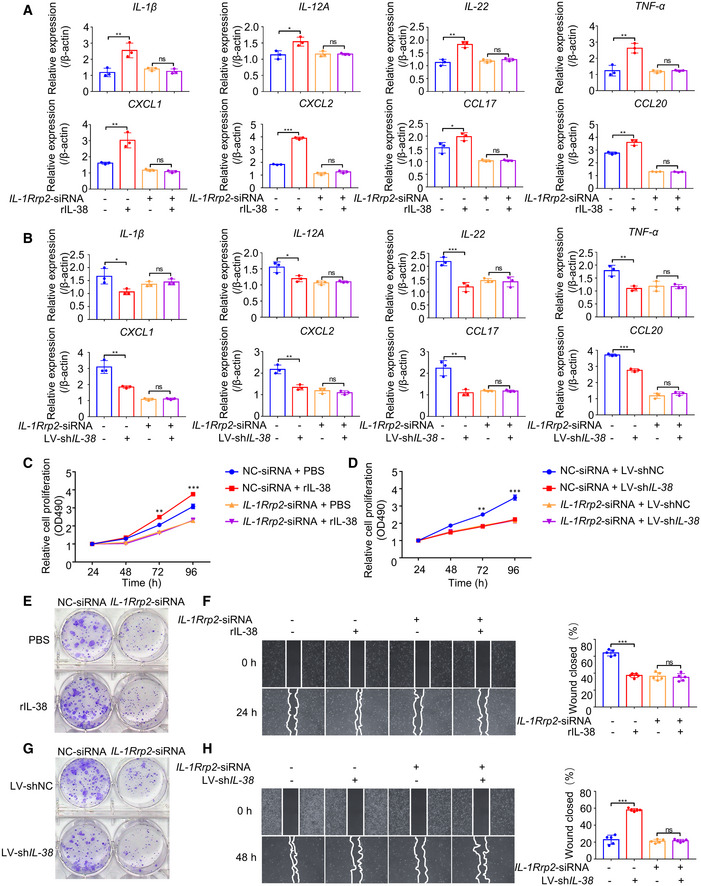
- A, B
Relative expression levels of inflammatory mediators were detected using qPCR after posttranscriptional silencing of IL‐1Rrp2 by RNA interference, followed by rIL‐38 (200 ng/ml) stimulation (A) or IL‐38 knockdown (B).
- C, D
Cell proliferation detection reagents were used to examine the effect of recombinant IL‐38 (200 ng/ml) protein (C) or IL‐38 knockdown (D) on A431 cell proliferation after IL‐1Rrp2 interference.
- E–H
Cell cloning formation assays were used to examine the effect of recombinant IL‐38 (200 ng/ml) protein stimulation (E) or IL‐38 knockdown (G) on A431 cell proliferation after IL‐1Rrp2 interference. Representative images of the scratch assay (left) and wound closure rate (right) of A431 cells (n = 5) treated with recombinant IL‐38 (200 ng/ml) (F) or knockdown of IL‐38 (H) after IL‐1Rrp2 interference.
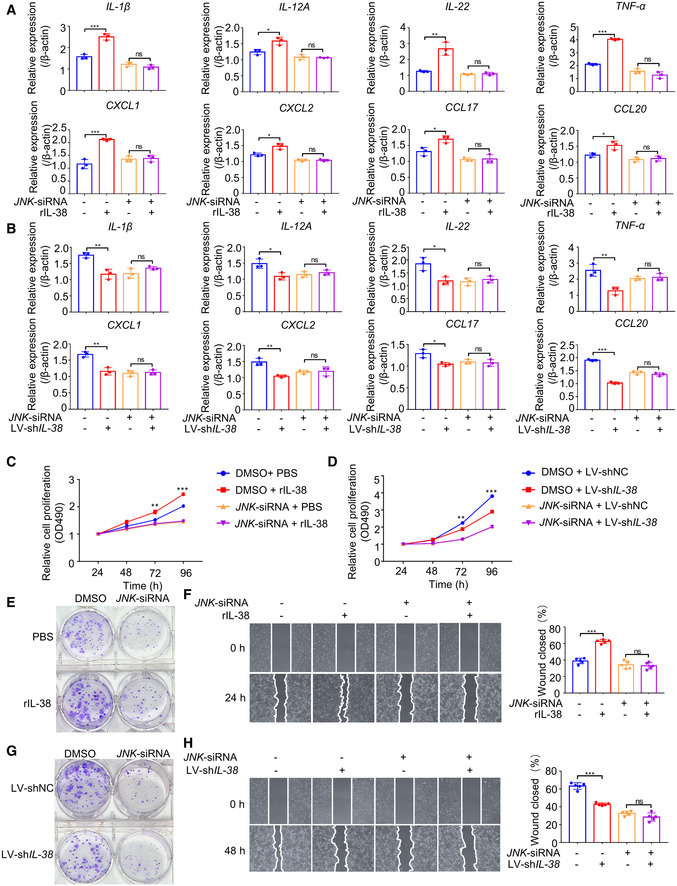
- A, B
Relative expression levels of inflammatory mediators were detected using qPCR after posttranscriptional silencing of JNK by RNA interference, followed by rIL‐38 (200 ng/ml) stimulation (A) or IL‐38 knockdown (B).
- C, D
Cell proliferation detection reagents were used to examine the effect of recombinant IL‐38 (200 ng/ml) protein (C) or IL‐38 knockdown (D) on A431 cell proliferation after JNK interference.
- E–H
Cell cloning formation assays were used to examine the effect of recombinant IL‐38 (200 ng/ml) protein stimulation (E) or IL‐38 knockdown (G) on A431 cell proliferation after JNK interference. Representative images of the scratch assay (left) and wound closure rate (right) of A431 cells (n = 5) treated with recombinant IL‐38 (200 ng/ml) (F) or knockdown of IL‐38 (H) after JNK interference.
References
-
- Bensen JT, Dawson PA, Mychaleckyj JC, Bowden DW (2001) Identification of a novel human cytokine gene in the interleukin gene cluster on chromosome 2q12‐14. J Interferon Cytokine Res 21: 899–904 - PubMed
-
- Boutet MA, Bart G, Penhoat M, Amiaud J, Brulin B, Charrier C, Morel F, Lecron JC, Rolli‐Derkinderen M, Bourreille A et al (2016) Distinct expression of interleukin (IL)‐36alpha, beta and gamma, their antagonist IL‐36Ra and IL‐38 in psoriasis, rheumatoid arthritis and Crohn's disease. Clin Exp Immunol 184: 159–173 - PMC - PubMed
-
- Boutet MA, Najm A, Bart G, Brion R, Touchais S, Trichet V, Layrolle P, Gabay C, Palmer G, Blanchard F et al (2017) IL‐38 overexpression induces anti‐inflammatory effects in mice arthritis models and in human macrophages in vitro . Ann Rheum Dis 76: 1304–1312 - PubMed
Publication types
MeSH terms
Substances
Associated data
- Actions
- Actions
LinkOut - more resources
Full Text Sources
Medical
Molecular Biology Databases
Research Materials
Miscellaneous
