. 2022 May 17:11:e73998.
doi: 10.7554/eLife.73998.

Integrative analysis of scRNA-seq and scATAC-seq revealed transit-amplifying thymic epithelial cells expressing autoimmune regulator

Affiliations

Integrative analysis of scRNA-seq and scATAC-seq revealed transit-amplifying thymic epithelial cells expressing autoimmune regulator

Takahisa Miyao et al. Elife. .

Abstract

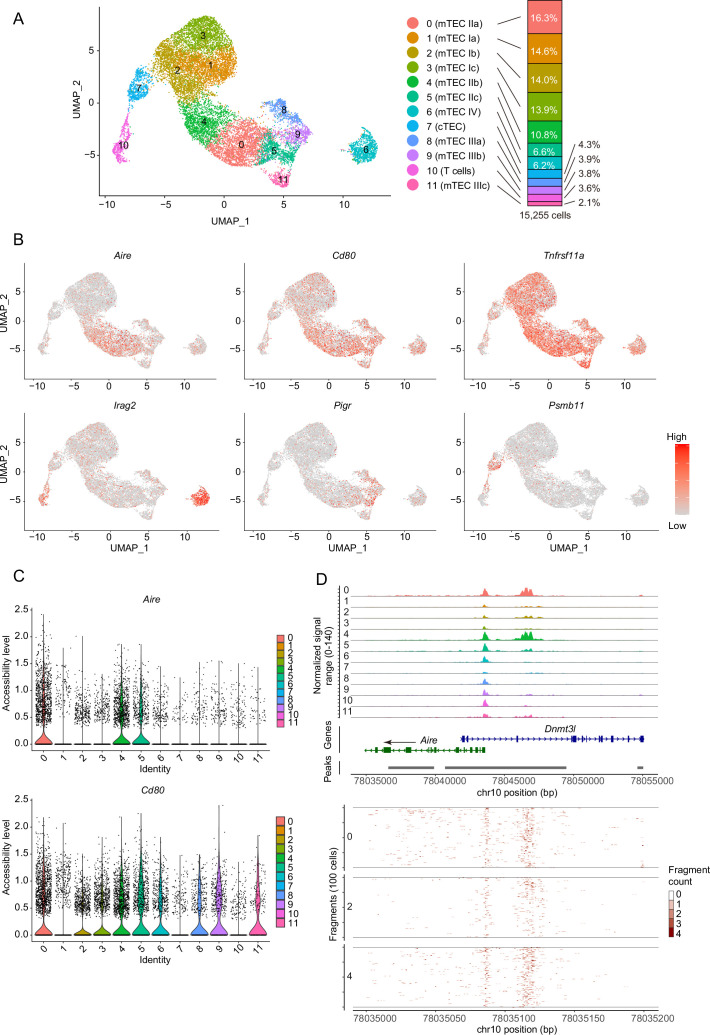
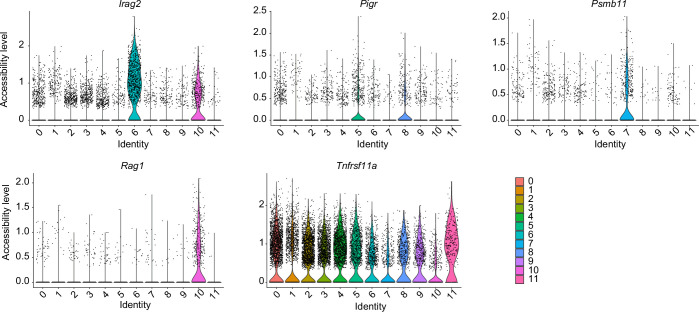
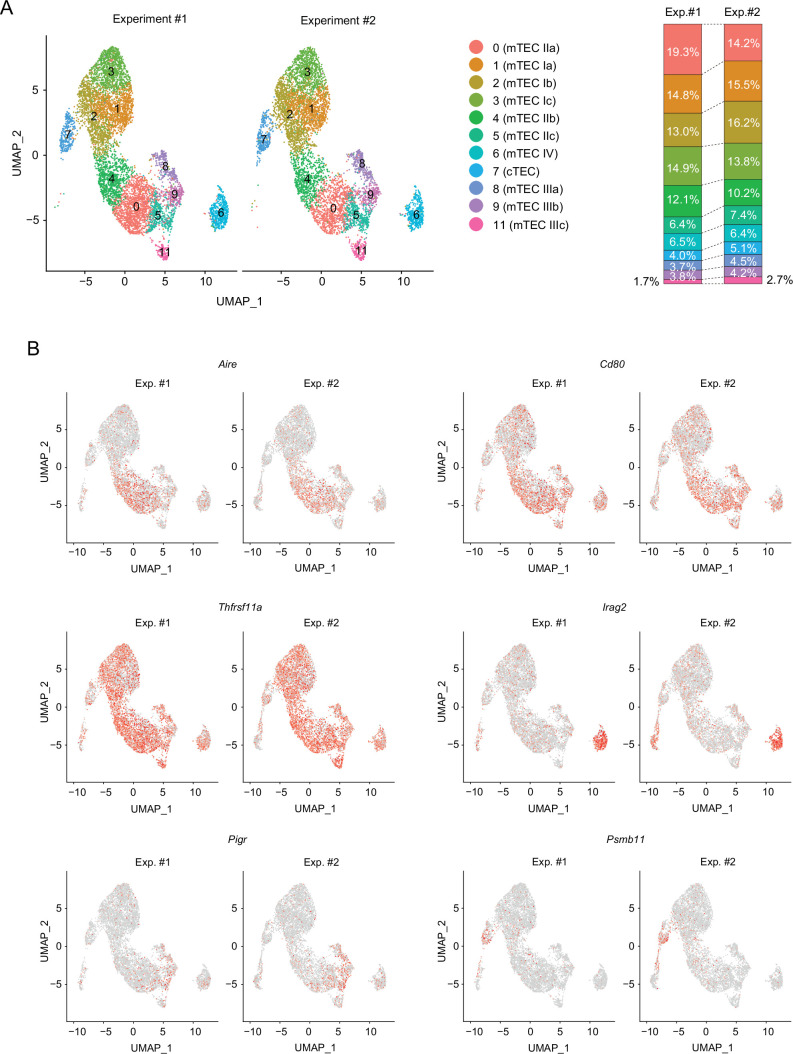
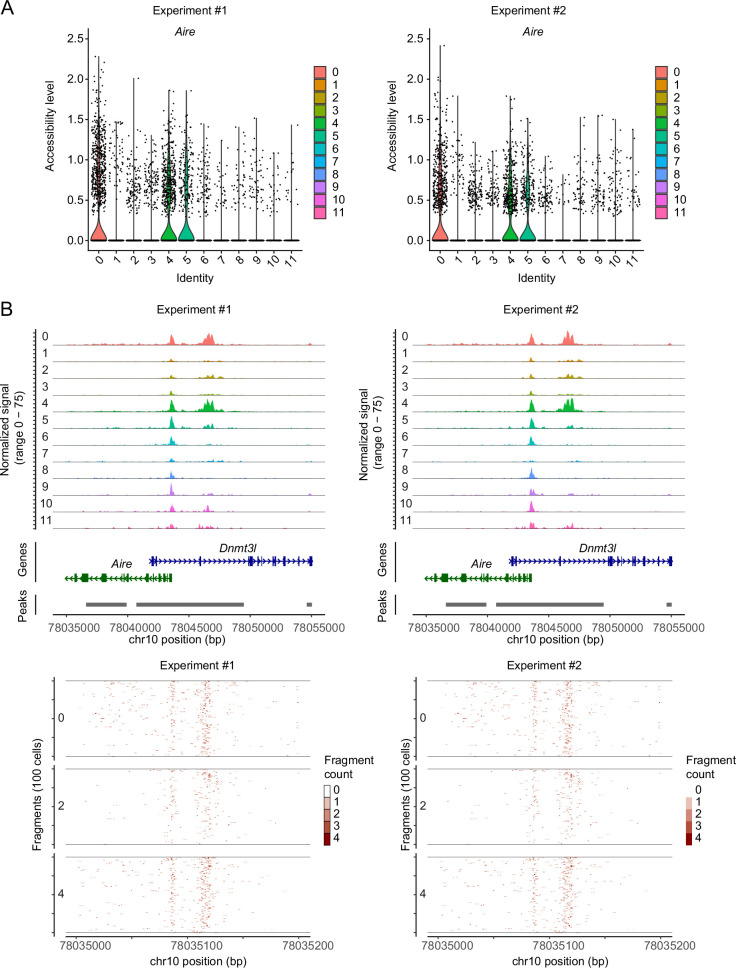
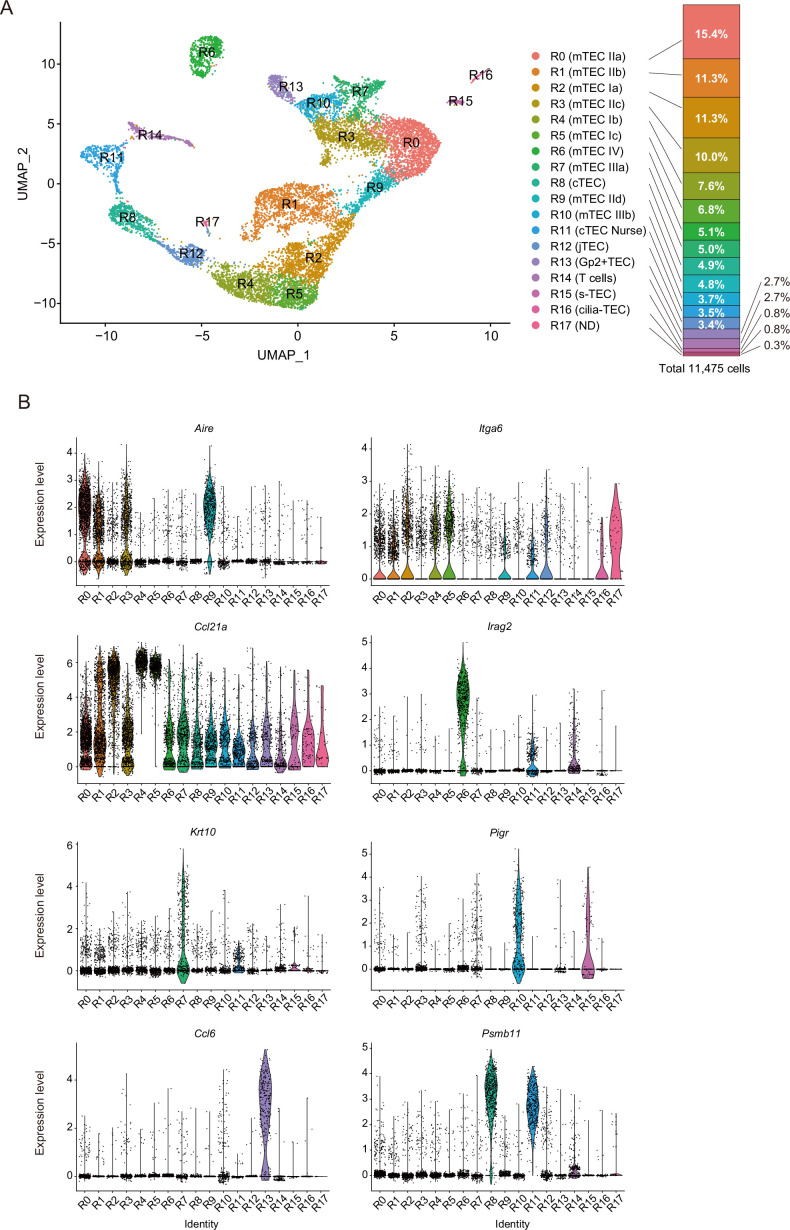
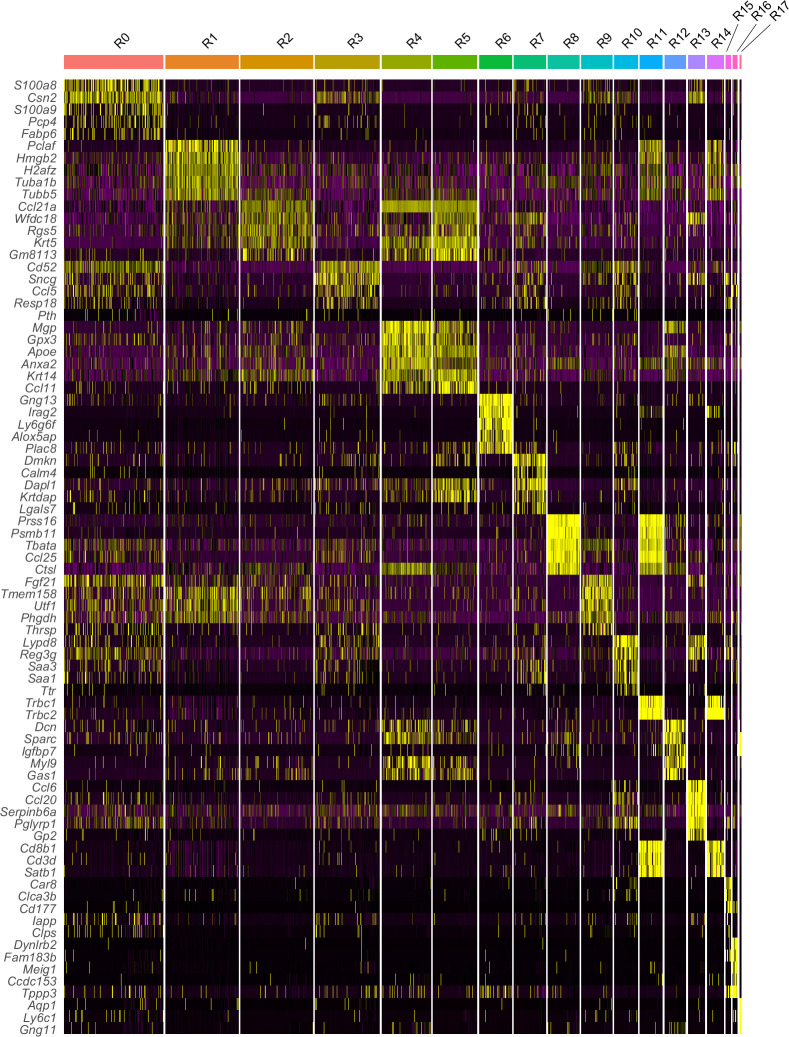
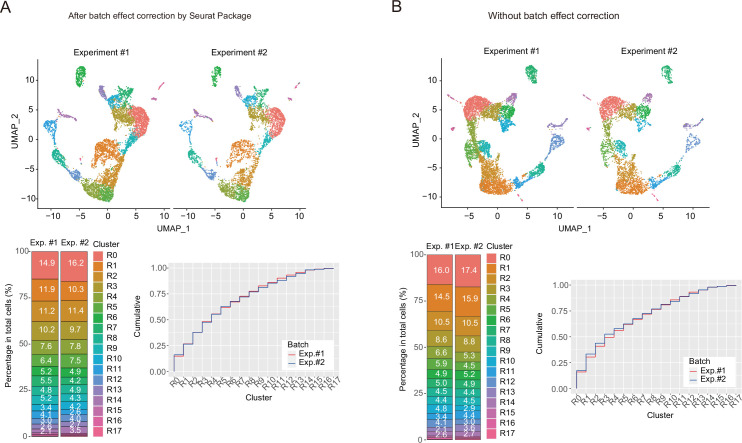
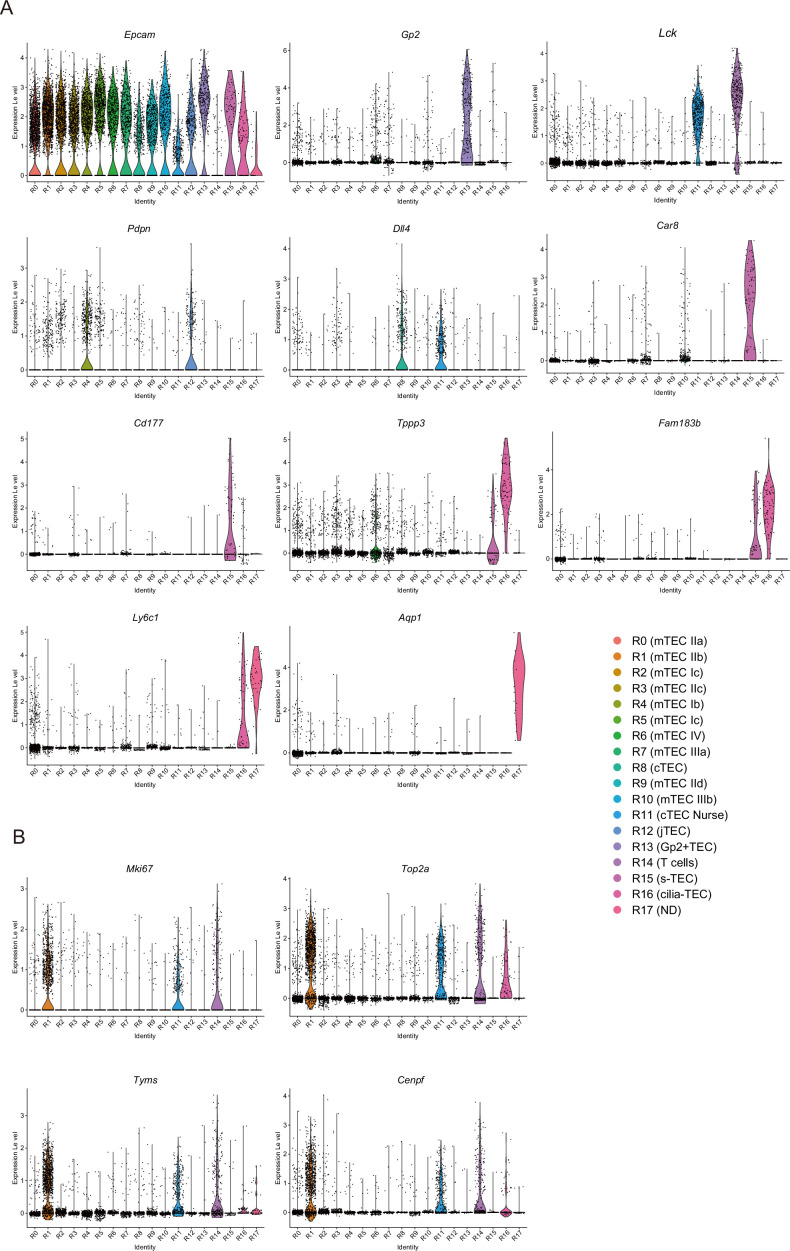
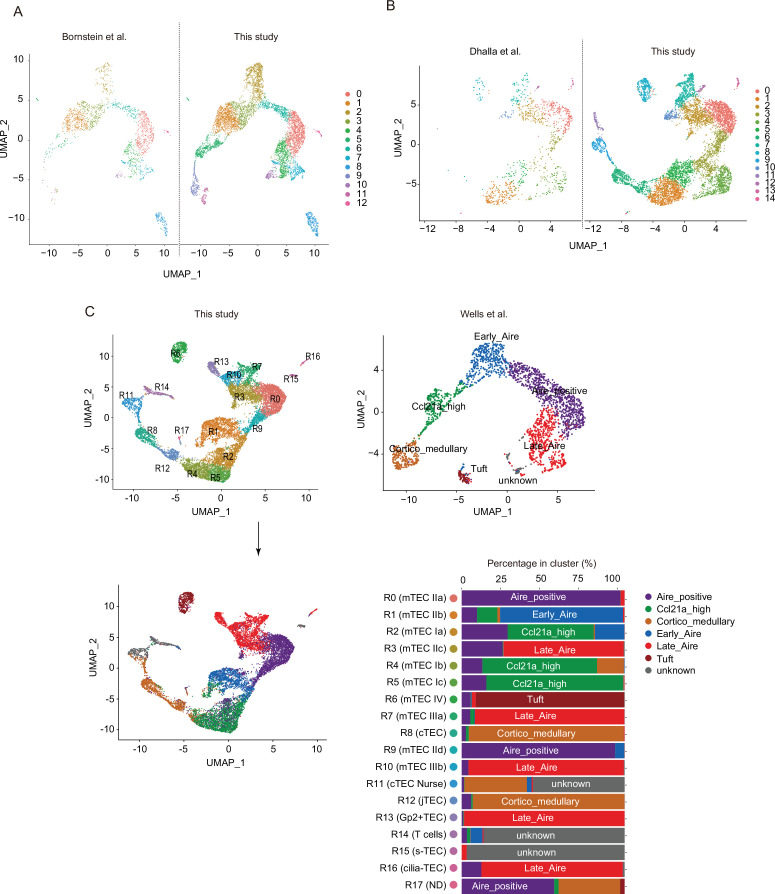
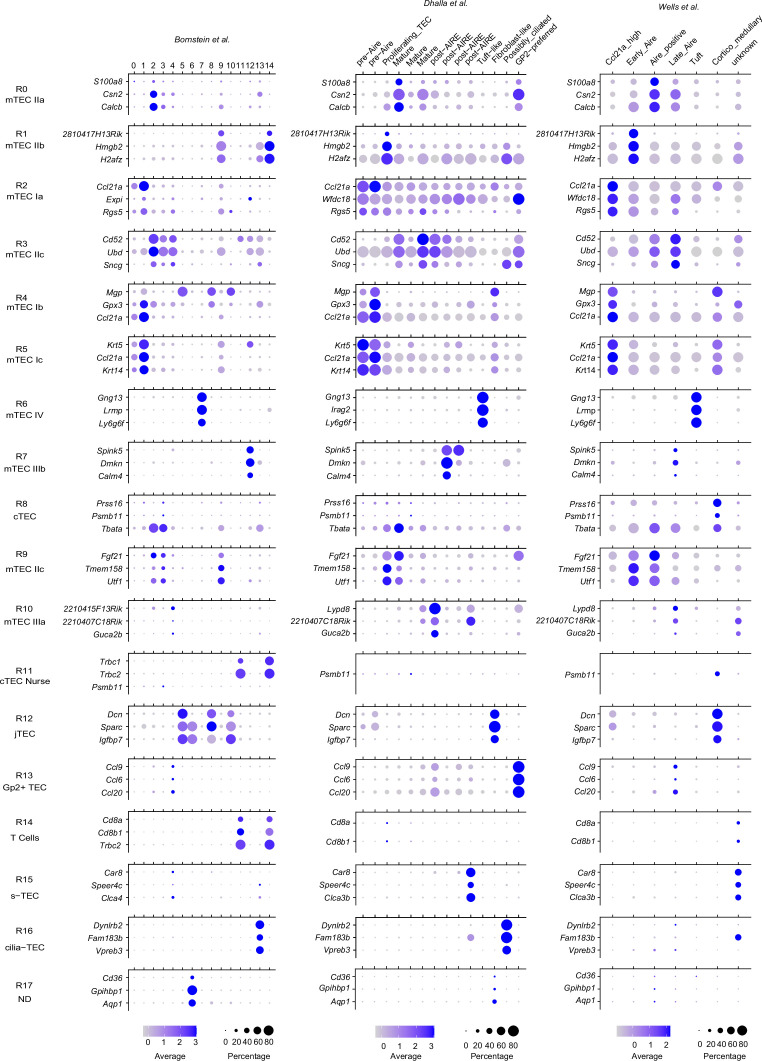
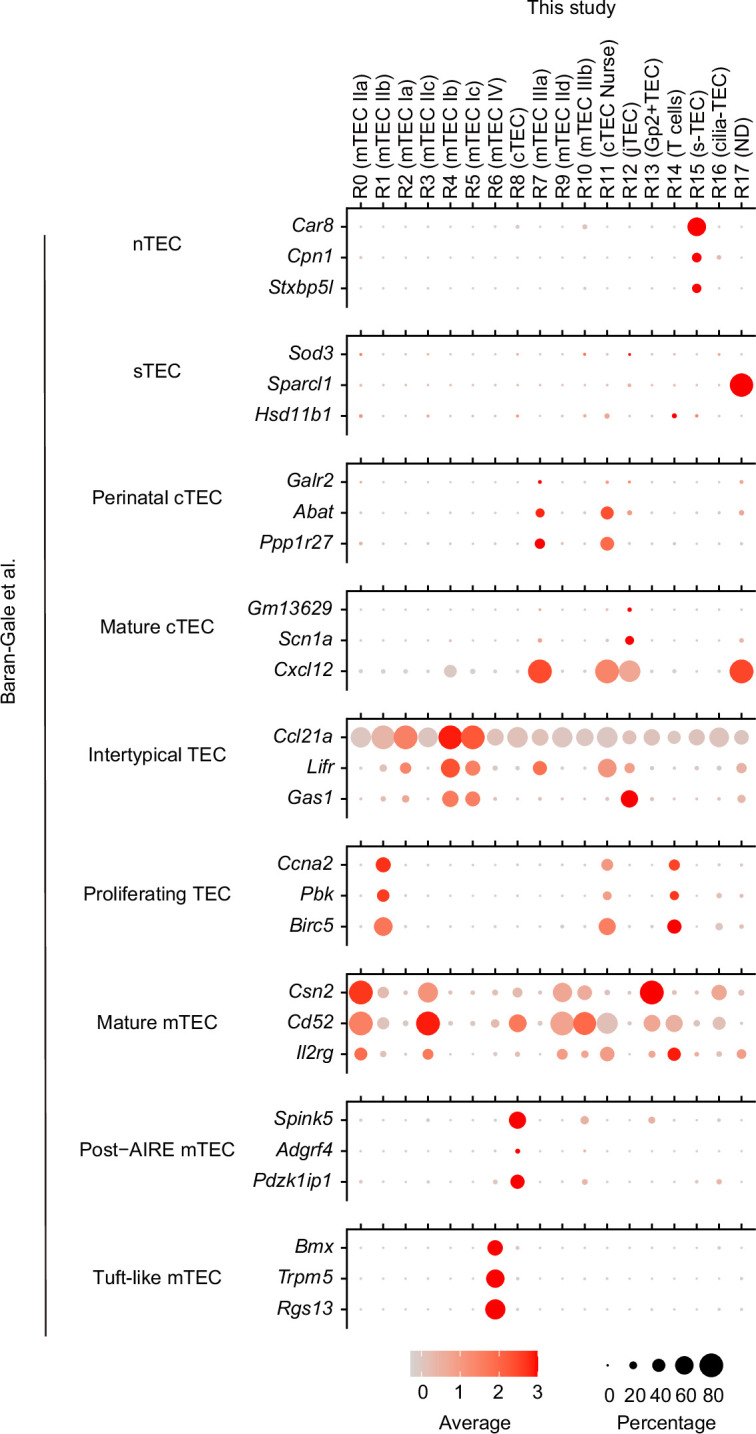
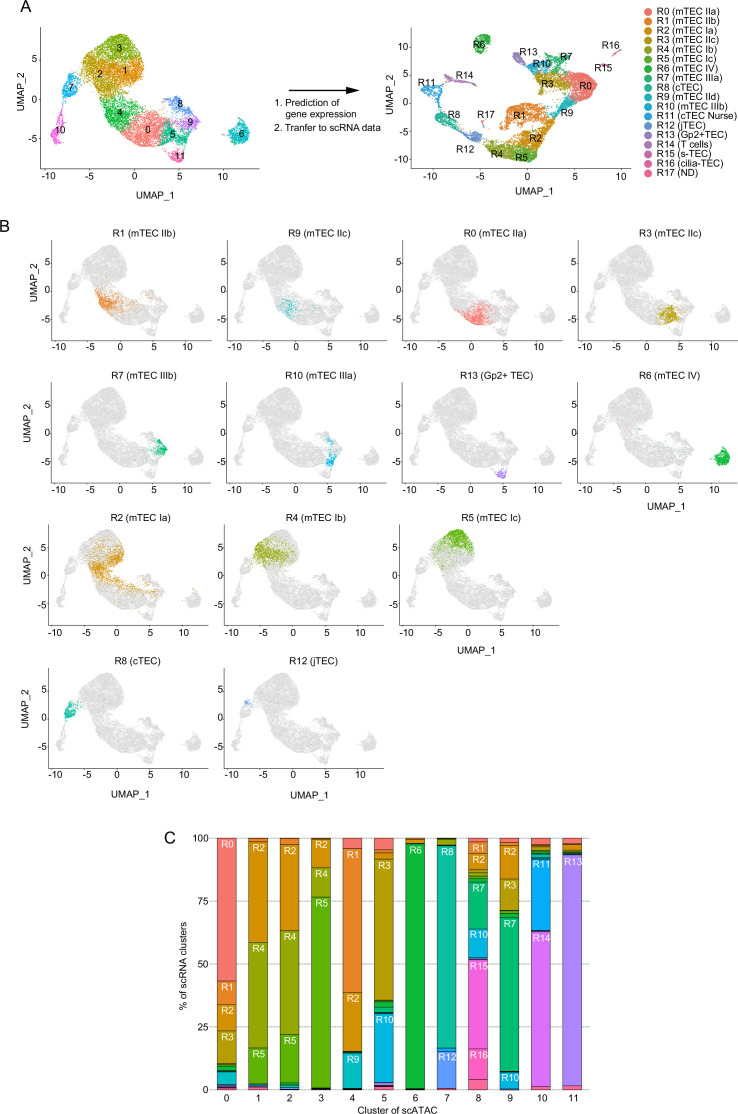
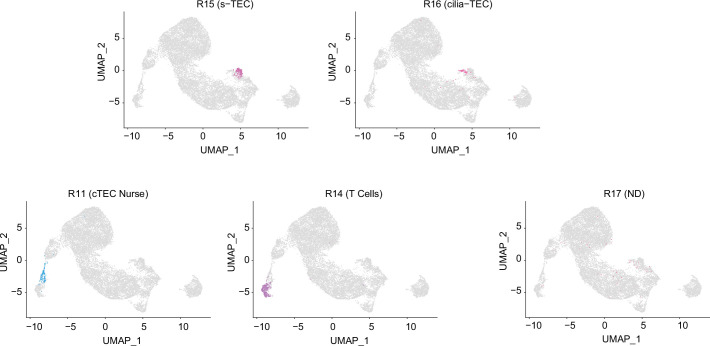
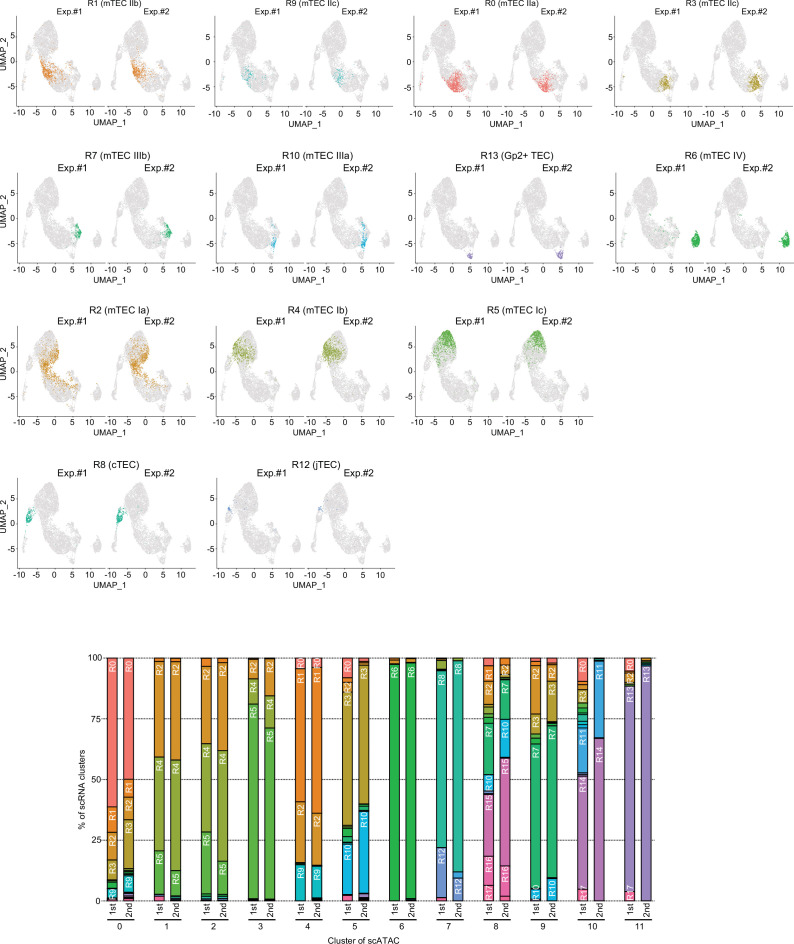
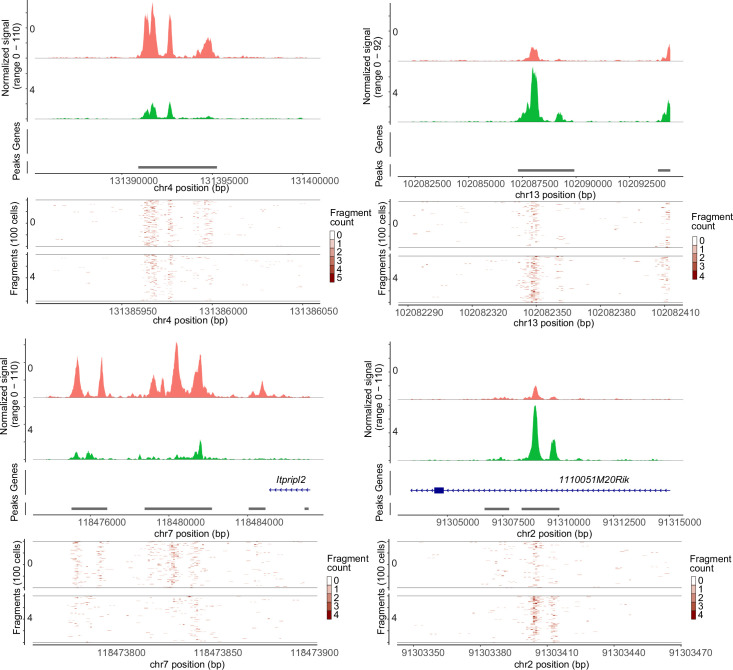
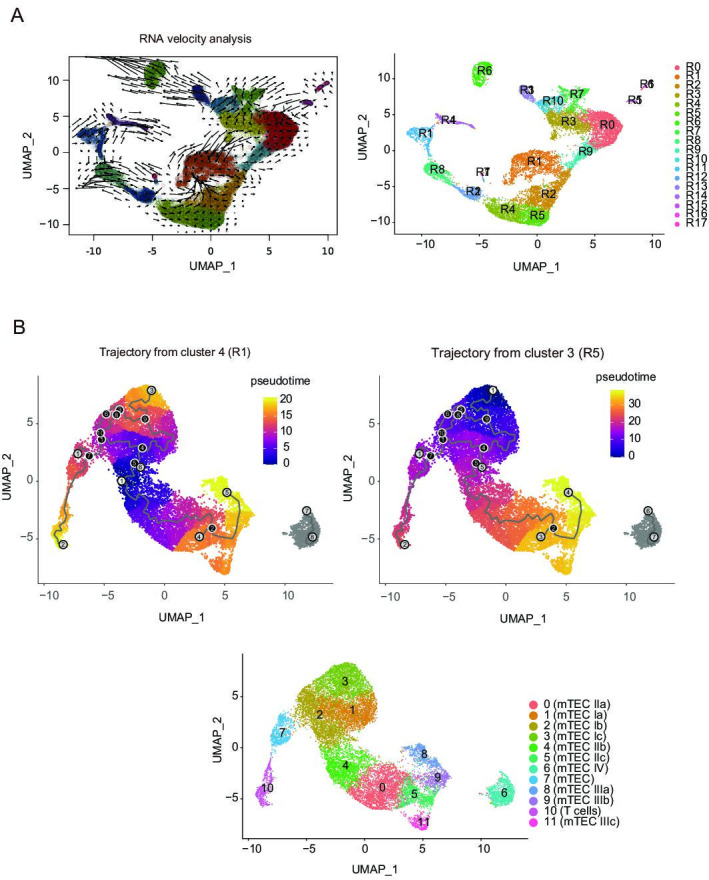
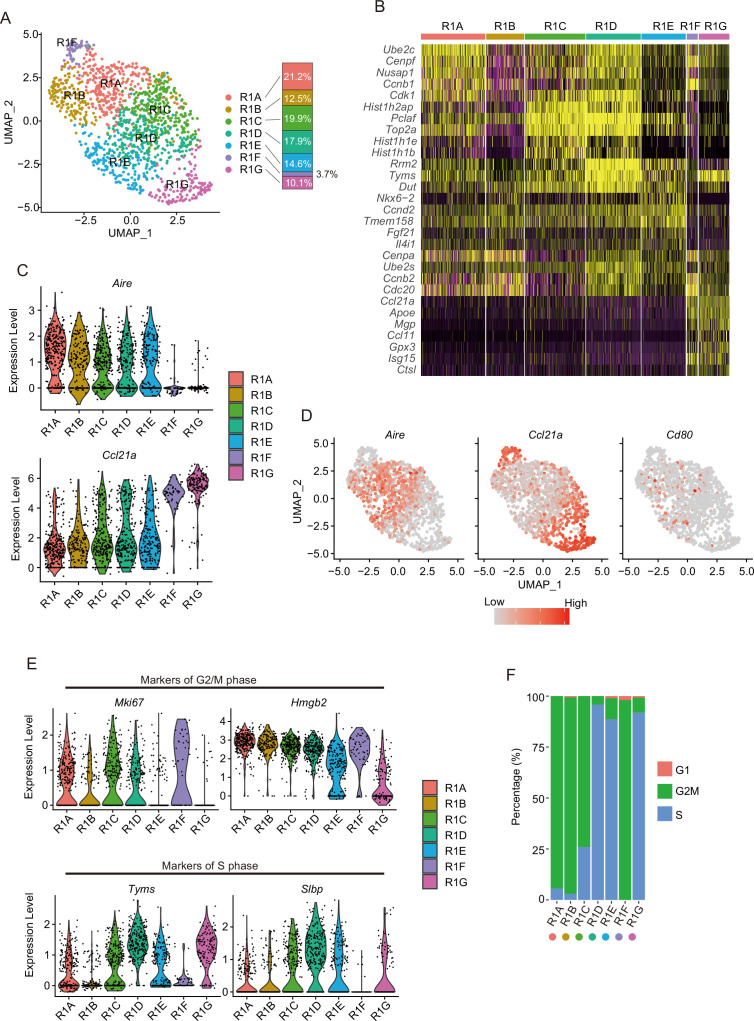
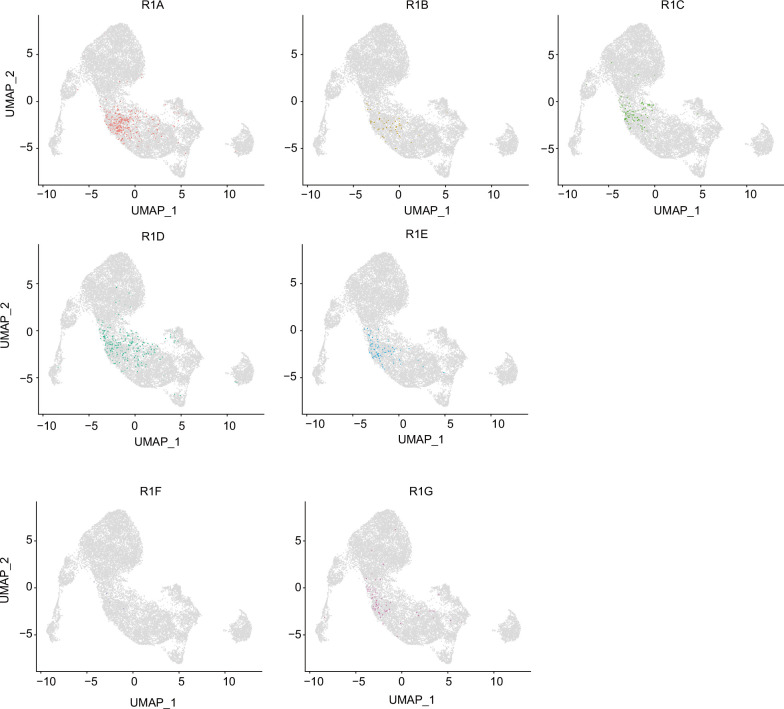
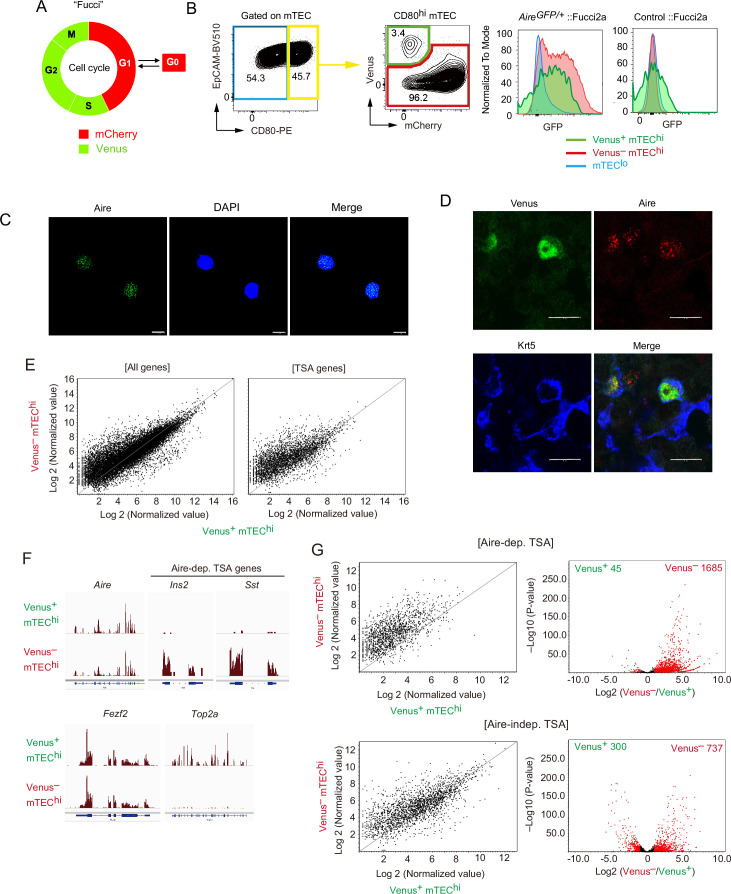
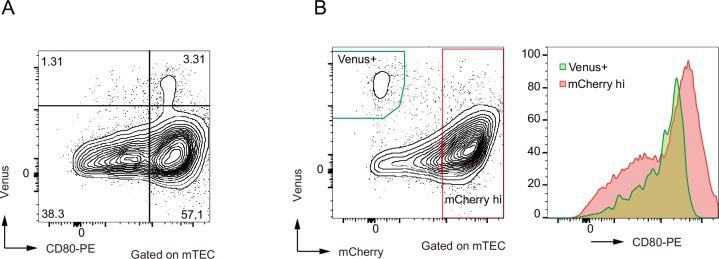
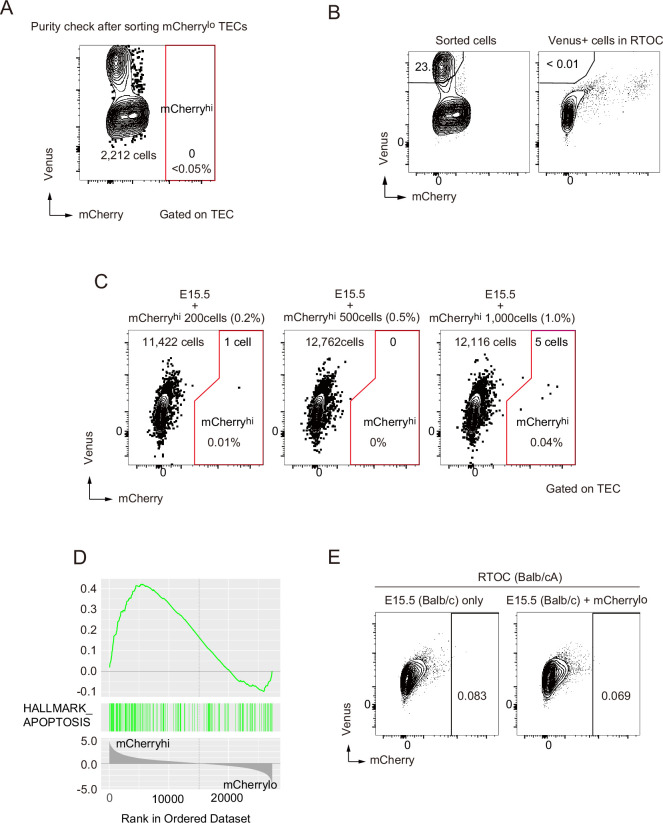
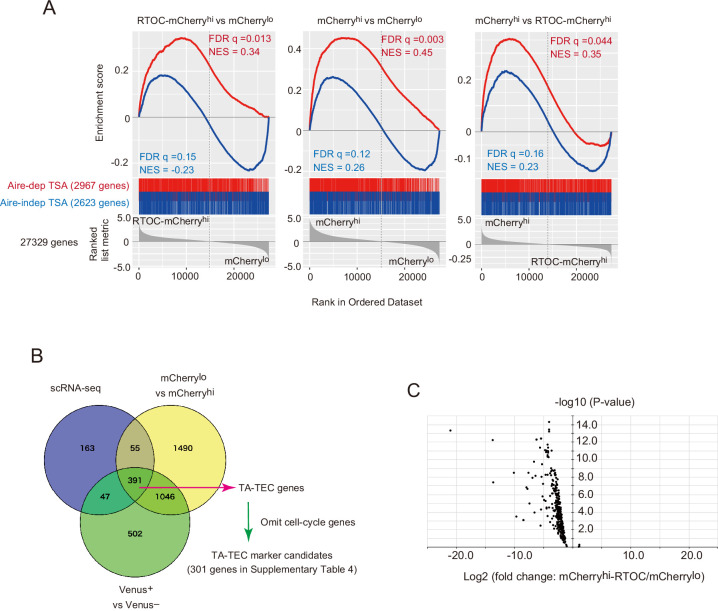
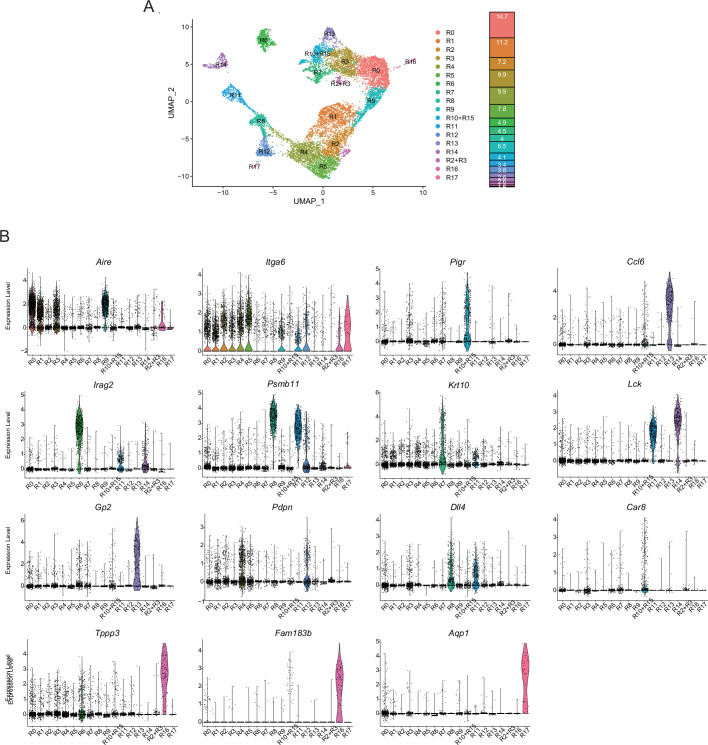
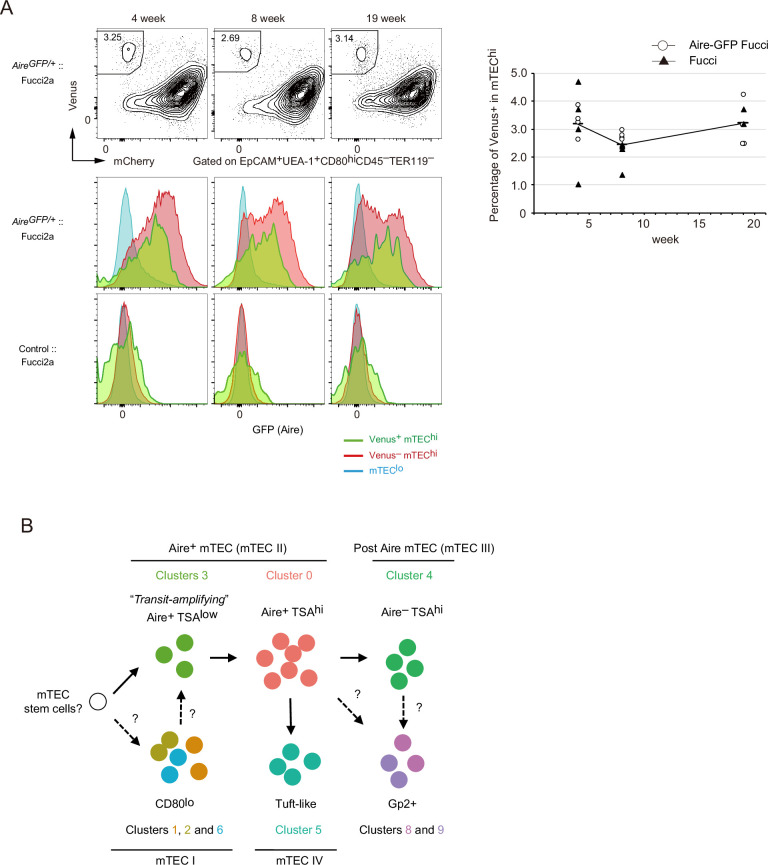
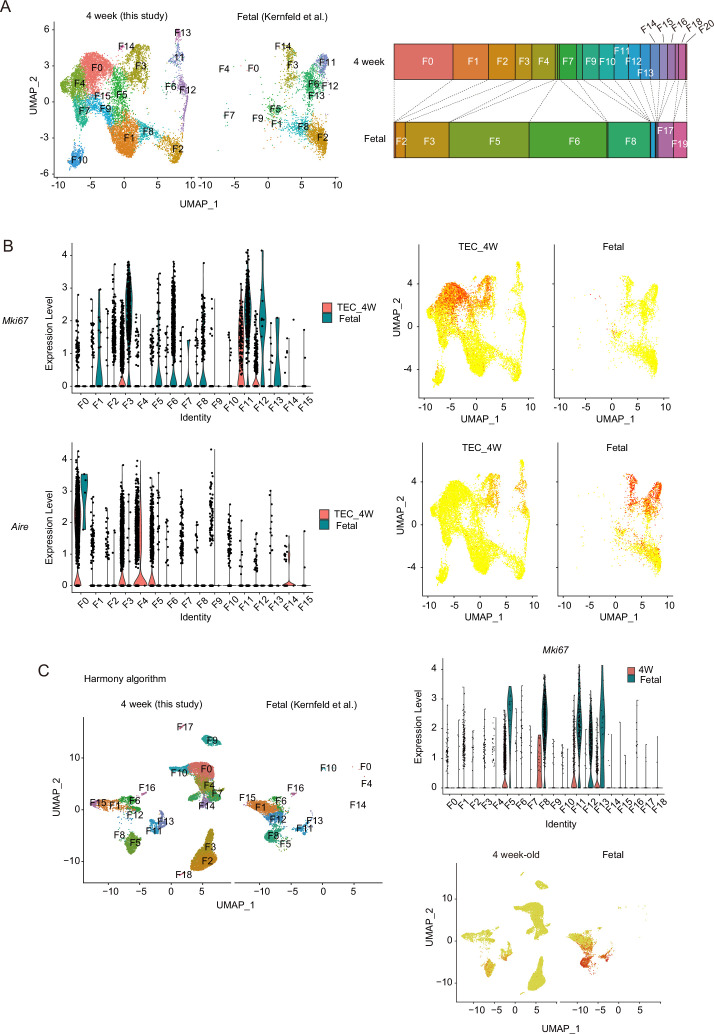
Medullary thymic epithelial cells (mTECs) are critical for self-tolerance induction in T cells via promiscuous expression of tissue-specific antigens (TSAs), which are controlled by the transcriptional regulator, AIRE. Whereas AIRE-expressing (Aire+) mTECs undergo constant turnover in the adult thymus, mechanisms underlying differentiation of postnatal mTECs remain to be discovered. Integrative analysis of single-cell assays for transposase-accessible chromatin (scATAC-seq) and single-cell RNA sequencing (scRNA-seq) suggested the presence of proliferating mTECs with a specific chromatin structure, which express high levels of Aire and co-stimulatory molecules, CD80 (Aire+CD80hi). Proliferating Aire+CD80hi mTECs detected using Fucci technology express a minimal number of Aire-dependent TSAs and are converted into quiescent Aire+CD80hi mTECs expressing high levels of TSAs after a transit amplification. These data provide evidence for the existence of transit-amplifying Aire+mTEC precursors during the Aire+mTEC differentiation process of the postnatal thymus.

Keywords: AIRE; ATAC; differentiation; immunology; inflammation; mouse; single-cell analysis; thymic epithelial cells; transit-amplifying cells.


Conflict of interest statement

TM, MM, SK, TT, TI, EO, SH, KH, YT, HO, MH, YM, TS, HI, HY, MY, AI, AS, AM, MM, AM, NA, TA No competing interests declared

Figures

Figure 1.
Figure 1.. Droplet-based single-cell assays for transposase-accessible chromatin sequencing (scATAC-seq) analysis of thymic epithelial cells (TECs) in 4-week mice.
(A) Uniform manifold approximation and production (UMAP) plot of scATAC-seq data from TECs (EpCAM+ CD45 TER119) from 4-week mice. Cell clusters are separated by colors and numbers in the plot. The two datasets were integrated using the Seurat package. The graph on the right shows percentages of each cluster in the total number of cells detected (15,255 cells). (B) Chromatin accessibility of typical marker genes of TECs. Accessibility in each gene region is represented in red. (C) Violin plot depicting chromatin accessibility in Aire and Cd80 gene regions in each cluster. (D) Pseudo-bulk accessibility tracks of the Aire gene region in each cluster (upper panels) and frequency of sequenced fragments within the Aire gene region of individual cells in cluster 0, 2, and 4 (lower panels).
Figure 1—figure supplement 1.
Figure 1—figure supplement 1.. Violin plot of chromatin accessibility in thymic epithelial cell (TEC) marker gene regions in each cluster.
Figure 1—figure supplement 2.
Figure 1—figure supplement 2.. Comparison of uniform manifold approximation and production (UMAP) plots of single-cell assays for transposase-accessible chromatin sequencing (scATAC-seq) between two experiments.
(A) Uniform manifold approximation and production (UMAP) plots of single-cell assays for transposase-accessible chromatin sequencing (scATAC-seq) data of murine thymic epithelial cells (TECs). Two scATAC-seq data (Experiment #1 and Experiment #2) were separately shown after the integration. The graph on the right shows percentages of each cluster. (B) Chromatin accessibility of typical marker genes of TECs. Two scATAC-seq data (Experiment #1 and Experiment #2) were separately shown after the integration. Accessibility in each gene region is represented in red.
Figure 1—figure supplement 3.
Figure 1—figure supplement 3.. Comparison of single-cell assays for transposase-accessible chromatin sequencing (scATAC-seq) data between two experiments.
(A) Violin plot depicting chromatin accessibility in Aire gene regions in each cluster. Two single-cell assays for transposase-accessible chromatin sequencing (scATAC-seq) data (Experiment #1 and Experiment #2) were separately shown after the integration. (B) Pseudo-bulk accessibility tracks of the Aire gene region in each cluster (upper panels) and frequency of sequenced fragments within the Aire gene region of individual cells in cluster 0, 2, and 4 (lower panels). Two scATAC-seq data (Experiment #1 and Experiment #2) were separately shown after the integration.
Figure 2.
Figure 2.. Droplet-based single-cell RNA sequencing (scRNA-seq) analysis of thymic epithelial cells (TECs) in 4-week mice.
(A) Uniform manifold approximation and production (UMAP) plot of scRNA-seq data from TECs (EpCAM+ CD45 TER119) from 4-week mice. Cell clusters (R0 to R17) are indicated by colors and numbers in the plot. The graph on the right shows the percentages of each cluster in the total number of cells detected (11,792 cells). (B) Violin plots depicting expression levels of typical TEC marker genes in each cluster.
Figure 2—figure supplement 1.
Figure 2—figure supplement 1.. Heatmap of the top five genes selectively expressed in each subcluster.
Yellow color indicates high expression.
Figure 2—figure supplement 2.
Figure 2—figure supplement 2.. Comparison of single-cell RNA sequencing data between two experiments.
(A) Uniform manifold approximation and production (UMAP) plots of thymic epithelial cell (TEC) single-cell RNA sequencing (scRNA-seq) data. Two scRNA-seq data (Experiment #1 and Experiment #2) were separately shown after the integration using Seurat package. The lower left graph shows percentages of each cluster. The lower right graph shows cumulative plot for percentages of clusters. (B) UMAP plots of TEC scRNA-seq data. Two scRNA-seq data (Experiment #1 and Experiment #2) were separately shown after merging two data without using integration functions. The lower left graph shows percentages of each cluster. The lower right graph shows cumulative plot for percentages of clusters.
Figure 2—figure supplement 3.
Figure 2—figure supplement 3.. Violin plots of marker genes and cell cycle-related genes.
(A) Violin plots for expression level of typical thymic epithelial cell (TEC) marker genes in single-cell RNA sequencing (scRNA-seq) analysis of TECs. (B) Violin plots for expression level of cell cycle-related genes in scRNA-seq analysis of TECs.
Figure 2—figure supplement 4.
Figure 2—figure supplement 4.. Comparison of single-cell RNA sequencing data between this study and previous studies.
(A) Integration of single-cell RNA sequencing (scRNA-seq) data derived from a previously reported well-based study (Bornstein et al., 2018) and scRNA-seq data derived from the present droplet-based study. scRNA-seq data from the two studies were integrated. (B) Uniform manifold approximation and production (UMAP) projections of the two scRNA-seq datasets are shown. Data from a previous study (Dhalla et al., 2020) were re-analyzed and integrated with data from the present study. Expression of typical marker genes in each data. (C) UMAP projections of our scRNA-seq data (upper left) and re-analyzed scRNA-seq data from a previous study (Wells et al., 2020) (upper right) are shown. In lower graphs, cell types in our single-cell assays for transposase-accessible chromatin sequencing (scATAC-seq) data were assigned by transferring the cell type annotation of Well’s scRNA-seq data.
Figure 2—figure supplement 5.
Figure 2—figure supplement 5.. Dot plots of expression of marker genes for our single-cell RNA sequencing (scRNA-seq) clusters in clusters of other scRNA-seq datasets (Bornstein et al., 2018; Dhalla et al., 2020; Wells et al., 2020).
Figure 2—figure supplement 6.
Figure 2—figure supplement 6.. Dot plots of expression of marker genes for Baran-Gales’s single-cell RNA sequencing (scRNA-seq) clusters (Baran-Gale et al., 2020) in clusters of our scRNA-seq datasets.
Figure 3.
Figure 3.. Integrative analysis of single-cell assays for transposase-accessible chromatin sequencing (scATAC-seq) data and single-cell RNA sequencing (scRNA-seq) data of thymic epithelial cells (TECs).
(A) Gene expression was predicted from scATAC-seq data using Signac. Individual cells in the cluster from scATAC data (clusters 0 to 11) were assigned and transferred to the uniform manifold approximation and production (UMAP) plot of scRNA-seq cluster (R0 to R17). (B) Correlation between clusters derived from scATAC-seq and scRNA-seq datasets of TECs. Cell types were annotated in scATAC dataset of TECs by transferring clusters from an scRNA-seq dataset. (C) Ratios of cells assigned to each scRNA-seq cluster in each scATAC cluster.
Figure 3—figure supplement 1.
Figure 3—figure supplement 1.. Integrative analysis of single-cell assays for transposase-accessible chromatin sequencing (scATAC-seq) data and single-cell RNA sequencing (scRNA-seq) data of thymic epithelial cells (TECs).
Gene expression was predicted from individual cells in scATAC-seq data. Individual cells in the scATAC data were assigned to an scRNA-seq cluster (R0 to R17).
Figure 3—figure supplement 2.
Figure 3—figure supplement 2.. Comparison of Integrative analysis of single-cell assays for transposase-accessible chromatin sequencing (scATAC-seq) data and single-cell RNA sequencing (scRNA-seq) data of thymic epithelial cells (TECs) between two experiments.
After cell types were annotated in single-cell assays for transposase-accessible chromatin (scATAC) dataset of thymic epithelial cells (TECs) by transferring clusters from an single-cell RNA sequencing (scRNA-seq) dataset, two scATAC-seq data were split. Ratio of cells assigned to each scRNA-seq cluster in each scATAC cluster was shown in the lower graph.
Figure 3—figure supplement 3.
Figure 3—figure supplement 3.. Pseudo-bulk accessibility tracks and frequency of sequenced fragments.
Typical differentially accessible regions between clusters 0 and 4 are depicted.
Figure 3—figure supplement 4.
Figure 3—figure supplement 4.. Trajectory analysis of single-cell RNA sequencing data.
(A) RNA velocity analysis of single-cell RNA sequencing (scRNA-seq) data. (B) Monocle 3 trajectory analysis of single-cell assays for transposase-accessible chromatin sequencing (scATAC-seq) data. The trajectory was manually started from cluster 3 or 4.
Figure 4.
Figure 4.. Subcluster analysis of the thymic epithelial cell (TEC) subset expressing a high level of cell cycle-related genes.
(A) Uniform manifold approximation and production (UMAP) plot of single-cell RNA sequencing (scRNA-seq) data of each subcluster (R1A to R1G) in R1. Cell subclusters (R1A to R1G) are separated by colors and numbers in the plot. The graph on the right shows the percentages of each cluster in the parent R1 cluster. (B) Heatmap of the top five genes selectively expressed in each subcluster. Yellow color indicates high expression. (C) Expression levels of Aire and Ccl21a in the subcluster are exhibited as violin plots. (D) Expression levels of Aire, Ccl21a, and Cd80 in the subcluster are shown in dot plots. (E) Expression levels of marker genes for G2/M phase (upper, Mki67 and Hmgb2) and S phase (lower, Tyms and Slbp) in the subcluster are exhibited as violin plots. (F) Percentage of cells predicted as each cell cycle (G1, G2M, and S phases) in the subclusters.
Figure 4—figure supplement 1.
Figure 4—figure supplement 1.. Integrative analysis of cluster 4 from single-cell assays for transposase-accessible chromatin sequencing (scATAC-seq) data and subclusters in R1 from single-cell RNA sequencing (scRNA-seq) data.
Gene expression was predicted from individual cells in cluster 4 of scATAC-seq data. Individual cells in the cluster 4 were assigned to the subclusters (R1A to R1G) in R1.
Figure 5.
Figure 5.. A highly proliferative subset of Aire+ CD80hi medullary thymic epithelial cells (mTECs).
(A) Schematic depiction of cell cycles and Fucci fluorescence. (B) Flow cytometric analysis of TECs from Fucci2a mice crossed with Aire-GFP-reporter mice. The gating strategy is shown. Intensities of GFP to monitor Aire expression in each subset (Venus+ CD80hi mTEC, Venus CD80hi mTEC, and CD80lo mTEClo) are shown in the right panels. Left, Airegfp/+:: Fucci2a; right, control::Fucci2a. Typical figures of three independent experiments are exhibited. (C) Immunostaining of a sorted Venus+ CD80hi mTEC subset via anti-Aire antibody and DAPI (nucleus staining). Typical panels of three independent experiments are exhibited. Scale bars, 10 μm. (D) Immunostaining of thymic sections from Fucci2a mice with anti-Aire and anti-keratin-5 (Krt5) antibodies. Typical panels of three independent experiments are exhibited. Scale bars, 10 μm. (E) Scatter plots of RNA sequencing data from Venus+ CD80hi mTEC and Venus CD80hi mTEC subsets. The left panel shows a plot of all detected genes and the right panel shows tissue-specific antigen (TSA) genes detected. N = 3. (F) Atypical RNA sequencing tracks of Aire, typical Aire-dependent TSA genes (Ins and Sst), Fezf2, and Top2a (a marker of G2/M phase). (G) Scatter plots and volcano plots of RNA sequencing data from Venus+ CD80hi mTEC and Venus CD80hi mTEC subsets. Upper panels show Aire-dependent TSAs, lower panels show Aire-independent TSAs. Red dots in volcano plots indicate genes for which expression differed significantly (twofold change and FDR p < 0.05) in Venus+ and Venus CD80hi mTEC subsets. Numbers of differentially expressed genes are shown in the panels. N = 3. Y axis is log10 of FDR p-value.
Figure 5—figure supplement 1.
Figure 5—figure supplement 1.. Flow cytometric analysis of medullary thymic epithelial cells (mTECs) from Fucci mouse.
Ly51UEA-1+ TECs were separated by expression of Venus+ and CD80 (left). CD80 expression was detected in mCherryhi mTECs (red) and Venus+ mTECs (green) in right panels.
Figure 5—figure supplement 2.
Figure 5—figure supplement 2.. Immunostaining of thymic sections from Fucci2a mice with anti-GFP (for Venus staining, green) and anti-keratin-5 (Krt5, blue) antibodies.
Typical panels of three independent experiments are exhibited. Scale bars, 100 μm.
Figure 5—figure supplement 3.
Figure 5—figure supplement 3.. Gene set enrichment analysis of differentially expressed genes between Venus and Venus + cells.
Gene sets of Aire-dependent tissue-specific antigens (TSAs) (Aire-dep TSAs), Aire-independent TSAs (Aire-indep TSAs), and all TSAs were tested. NES indicates normalized enrichment score.
Figure 6.
Figure 6.. Fate mapping study with in vivo BrdU pulse-labeling of Fucci thymic epithelial cells (TECs).
(A) Schematic procedure of in vivo BrdU pulse labeling of Fucci mice, and analysis of BrdU staining in mCherryhiCD80hi and mCherryloCD80hi medullary TECs (mTECs) by flow cytometiric analysis. BrdU staining was done after sorting each cell fraction. (B) Typical flow cytometric profile of BrdU staining in mCherryloCD80hi mTECs (upper panels) and mCherryhiCD80hi mTECs (lower panels) at days 0.5, 3.5, and 6.5 after the BrdU injection. Data for the ratio of BrdU+ cells in each mTEC fraction are summarized in right-hand figures. N = 7 for 0.5 day after the BrdU injection, N = 3 for 3.5 and 6.5 days after the injection. Two-tailed Student’s t-tests. **p < 0.01 and *p < 0.05. NS, not significant (p > 0.05). p = 1.5 × 10⁻³ for the upper figure and p = 0.033 for the lower figure. Original data were shown in Figure 6—source data 1. (C) Cell number of BrdU+mCherryloCD80hi mTECs and BrdU+mCherryhiCD80hi mTECs at days 0.5, 3.5, and 6.5 after the BrdU injection. Two-tailed Student’s t-tests. **p < 0.01. NS, not significant (p > 0.05). p = 4.3 × 10⁻³ for the left figure and p = 5.1 × 10⁻³ for the right figure. Original data were shown in Figure 6—source data 1. (D) Mean fluorescence intensity (MFI) of BrdU staining in mCherryloCD80hi at day 0.5 and mCherryhiCD80hi at days 3.5 and 6.5. MFIs of other time points were difficult to evaluate because of very low cell numbers. Two-tailed Student’s t-tests. *p = 0.015 and **p = 6.5 × 10⁻³. NS, not significant (p > 0.05). Original data were shown in Figure 6—source data 1.
Figure 7.
Figure 7.. Fate mapping study of proliferating Aire+ medullary thymic epithelial cells (mTECs) in in vitro reaggregated thymic organ culture (RTOC).
(A) RTOC experiment to test the differentiation capacity of proliferating Aire+ mTECs. Proliferating Aire+ mTECs (mCherrylo) and E15.5 embryonic thymic cells were reaggregated and subsequently cultured for 5 days. Reaggregated thymic organ (RTO) was analyzed by flow cytometry. Representative flow cytometric profiles of RTOC are shown. N = 5. The ratio of mCherryhi cells in TECs is summarized in the right-hand figure. *p < 0.05. p = 0.027 between CD80hi and CD80lo in mCherrylo and p = 0.024 between CD80hi mCherrylo and CD80hi RTOC control. (B) Volcano plots of RNA-seq data from mCherrylo CD80hi mTECs (mCherrylo), mCherryhi CD80hi mTECs (mCherryhi), and mCherryhi CD80hi mTECs in RTOC (mCherryhi in RTOC). Red dots in volcano plots indicate genes for which expression differed significantly between the two subsets. Numbers of differentially expressed genes are shown in the panels. N = 3. Y axis is log10 of FDR p-value. (C) Expression levels of Aire and Mki67 in mCherrylo, mCherryhi, and mCherryhi in RTOC. (D) Scatter plot of normalized expression values of TA-TEC marker candidates in mCherrylo and mCherryhi in RTOC. TA-TEC marker candidate genes were selected from bulk RNA-seq data and scRNA-seq data in Figure 7—figure supplement 2 (E) Integration of well-based single-cell random displacement amplification sequencing (scRamDA-seq) data (mCherrylo, mCherryhi, and mCherryhi in RTOC) with the droplet-based scRNA-seq data in Figure 2. (F) Frequency of each cell cluster in scRamDA-seq data of mCherrylo, mCherryhi, and mCherryhi -RTOC. (G) Volcano plot of tissue-specific antigen (TSA) expression in each cell cluster in scRamDa-seq data of mCherryhi-RTOC as compared to mCherrylo. Red dots indicate significantly changed TSA genes.
Figure 7—figure supplement 1.
Figure 7—figure supplement 1.. Flow cytometric analysis and gene set enrichment analysis of reaggregation thymic organ culture experiments.
(A) Flow cytometric analysis for purity check for sorted mCherrylo medullary thymic epithelial cells (mTECs). (B) Ratio of Venus+ cells in sorted mCherrylo and RTOC. (C) Reaggregated thymic organ culture (RTOC) experiment to test the survival of contaminated mCherryhi mTECs. Sorted mCherryhi mTECs (200, 500, or 1000 cells) and E15.5 embryonic thymic cells were reaggregated and subsequently cultured for 5 days. Reaggregated thymic organ was analyzed by flow cytometer. (D) Gene set enrichment analysis (GSEA) of differentially expressed genes between mCherryhi and mCherrylo for pro-apoptotic gene set (HALLMARK_APOPTOSIS, M5902) (Liberzon et al., 2015). (E) Flow cytometric analysis of RTOC using allogenic fetal thymus (Balb/cA).
Figure 7—figure supplement 2.
Figure 7—figure supplement 2.. Analysis of differentially expressed tissue specific antigen (TSA) genes between mCherryhi thymic epithelial cells (TECs) in reaggregated thymic organ culture (RTOC) and mCherrylo TECs.
(A) Gene set enrichment analyses of differentially expressed genes between mCherryhi thymic epithelial cells (TECs) in reaggregated thymic organ culture (RTOC) and mCherrylo TECs (left panels), mCherryhi TECs and mCherrylo TECs (middle panels), and mCherryhi TECs and mCherryhi TECs in RTOC are exhibited. Gene sets of Aire-dependent tissue-specific antigens (TSAs) (Aire-dep TSAs), and Aire-independent TSAs (Aire-indep TSAs) were tested. NES indicated normalized enrichment score. FDR q indicated the false discovery rate q value. (B) Venn diagram of gene lists expressed in proliferating TECs at higher level in the three different RNA-seq datasets (mCherrylo vs. mCherryhi in Figure 6, Venus + vs. Venus in Figure 4 and cluster R1 in Figure 2). TA-TEC gene candidates were selected from the Venn diagram. TA-TEC marker gene candidates were selected by omitting cell cycle-related genes (GO:0007049 and Tirosh et al., 2016) form the TA-TEC gene candidates. The list of genes is summarized in Supplementary file 4. (C) Volcano plot for TA-TEC marker candidate expression in mCherrylo and mCherryhi in RTOC.
Figure 7—figure supplement 3.
Figure 7—figure supplement 3.. Integration of droplet-based single-cell RNA sequencing and well-based single-cell random displacement amplification sequencing data.
(A) Uniform manifold approximation and production (UMAP) plot of droplet-based single-cell RNA sequencing (scRNA-seq) and well-based single-cell random displacement amplification sequencing (scRamDA-seq) data after their integration. Cell clusters are separated by colors and numbers in the plot. The graph on the right shows the percentages of each cluster in the total number of cells detected. Each cluster was assigned based on gene expression profile and corresponded with clusters in Figure 2. (B) Violin plots depicting expression level of typical thymic epithelial cell (TEC) marker genes in each cluster.
Figure 8.
Figure 8.. Proliferating Aire+ CD80hi medullary thymic epithelial cells (mTECs) persist in older mice.
(A) Flow cytometry analysis of CD80hi mTEC subsets from Fucci2a mice aged 4, 8, and 19 weeks. Representative data are shown. Percentages of Venus+ cells in CD80hi mTEC subsets are summarized in the graph in the right panel. N = 4 each for Airegfp/+:: Fucci2a (circle) and control::Fucci2a (closed triangles). (B) Schematic depiction of the proposed process of Aire+ mTEC development in the adult thymus. Transit-amplifying TSAlo Aire+ TECs give rise to mature mTECs. Precursor cells to the transit-amplifying TECs have not been determined yet. Cluster numbers in Figure 1 are shown together with the model of mTEC subsets I to IV.
Figure 8—figure supplement 1.
Figure 8—figure supplement 1.. Integration of single-cell RNA sequencing data of 4-week-old and fetal thymic epithelial cell.
(A) Single-cell RNA sequencing (scRNA-seq) data in this study (4-week-old mice) were integrated with scRNA-seq data reported by others (Kernfeld et al., 2018) by Seurat package (Find integration anchors function). (B) Expression levels of Mki67 (upper panels) and Aire (lower panels) in the subcluster are shown in violin plots (left) and dot plots (right). (C) scRNA-seq data in this study (4-week-old mice) were integrated with scRNA-seq data reported by others (Kernfeld et al., 2018) by Harmony algorithm (Korsunsky et al., 2019).
Figure 8—figure supplement 2.
Figure 8—figure supplement 2.. Single-cell RNA sequencing (scRNA-seq) data of feta thymus (Kernfeld et al., 2018) were integrated with other adult scRNA-seq data (Bornstein et al., 2018; Dhalla et al., 2020; Wells et al., 2020).

References

    1. Abramson J, Anderson G. Thymic Epithelial Cells. Annual Review of Immunology. 2017;35:85–118. doi: 10.1146/annurev-immunol-051116-052320. - DOI - PubMed
    1. Akiyama T, Maeda S, Yamane S, Ogino K, Kasai M, Kajiura F, Matsumoto M, Inoue J. Dependence of self-tolerance on TRAF6-directed development of thymic stroma. Science (New York, N.Y.) 2005;308:248–251. doi: 10.1126/science.1105677. - DOI - PubMed
    1. Akiyama T, Shimo Y, Yanai H, Qin J, Ohshima D, Maruyama Y, Asaumi Y, Kitazawa J, Takayanagi H, Penninger JM, Matsumoto M, Nitta T, Takahama Y, Inoue J-I. The tumor necrosis factor family receptors RANK and CD40 cooperatively establish the thymic medullary microenvironment and self-tolerance. Immunity. 2008;29:423–437. doi: 10.1016/j.immuni.2008.06.015. - DOI - PubMed
    1. Akiyama N, Shinzawa M, Miyauchi M, Yanai H, Tateishi R, Shimo Y, Ohshima D, Matsuo K, Sasaki I, Hoshino K, Wu G, Yagi S, Inoue J, Kaisho T, Akiyama T. Limitation of immune tolerance-inducing thymic epithelial cell development by Spi-B-mediated negative feedback regulation. The Journal of Experimental Medicine. 2014;211:2425–2438. doi: 10.1084/jem.20141207. - DOI - PMC - PubMed
    1. Akiyama N, Takizawa N, Miyauchi M, Yanai H, Tateishi R, Shinzawa M, Yoshinaga R, Kurihara M, Demizu Y, Yasuda H, Yagi S, Wu G, Matsumoto M, Sakamoto R, Yoshida N, Penninger JM, Kobayashi Y, Inoue J-I, Akiyama T. Identification of embryonic precursor cells that differentiate into thymic epithelial cells expressing autoimmune regulator. The Journal of Experimental Medicine. 2016;213:1441–1458. doi: 10.1084/jem.20151780. - DOI - PMC - PubMed

Publication types

Associated data

LinkOut - more resources