Randomized Controlled Trial
. 2022 Jun 28;7(3):e0012922.
doi: 10.1128/msystems.00129-22. Epub 2022 May 17.

Gut Microbial Stability is Associated with Greater Endurance Performance in Athletes Undertaking Dietary Periodization

Affiliations
Randomized Controlled Trial

Gut Microbial Stability is Associated with Greater Endurance Performance in Athletes Undertaking Dietary Periodization

Matthew J W Furber et al. mSystems. .

Abstract

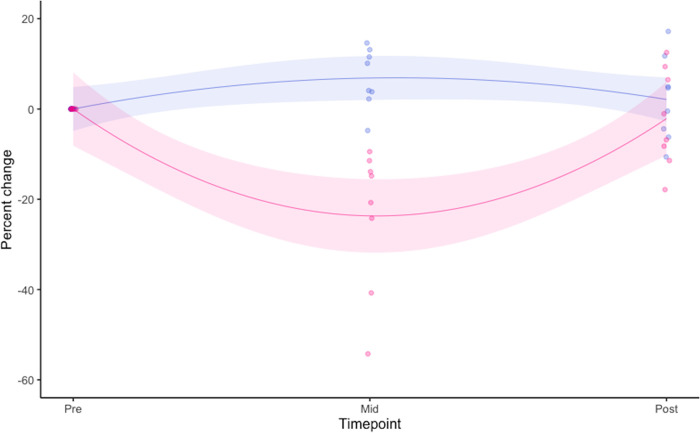
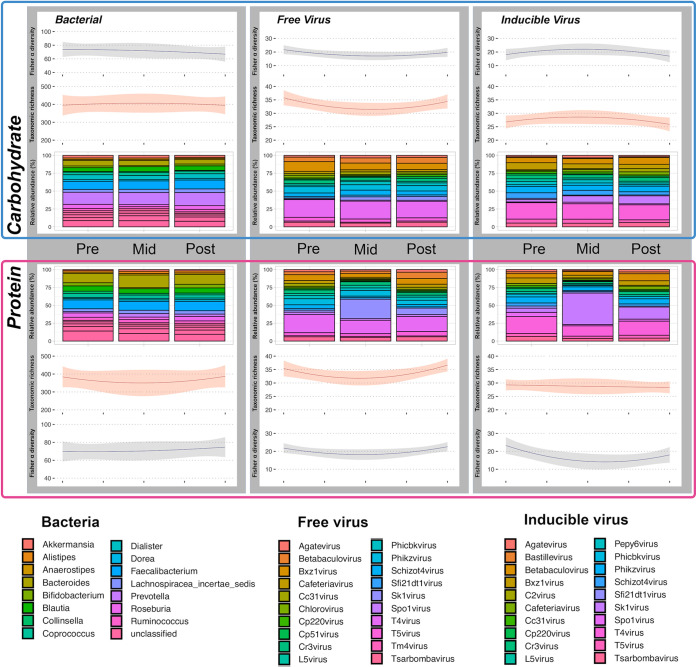
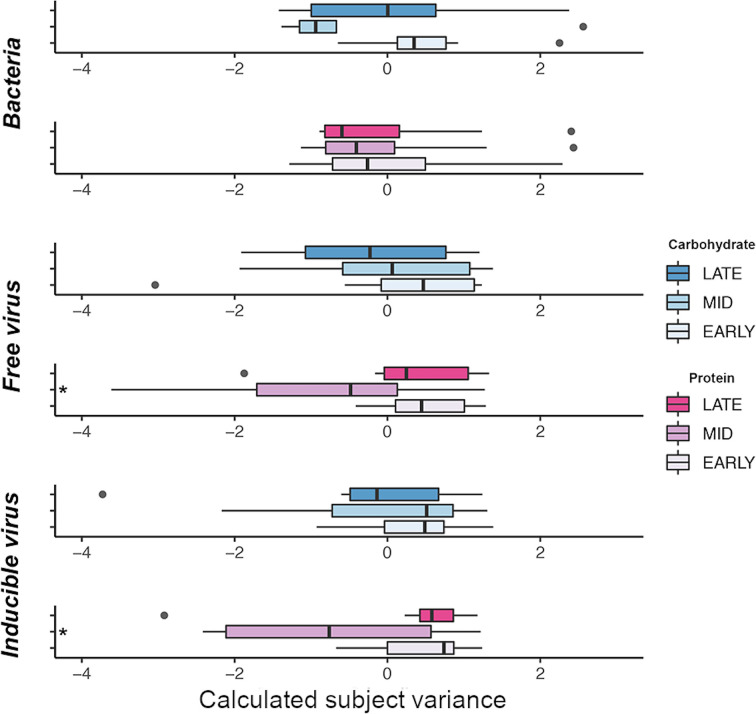
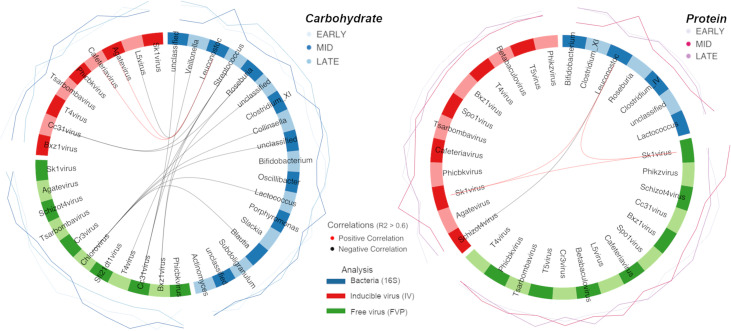
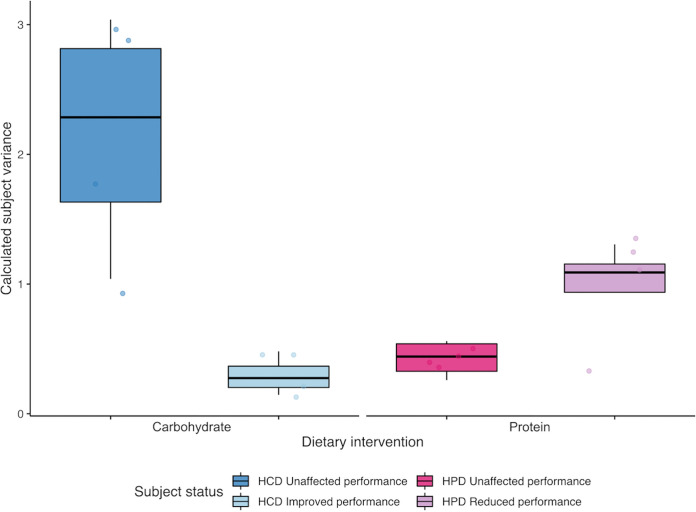
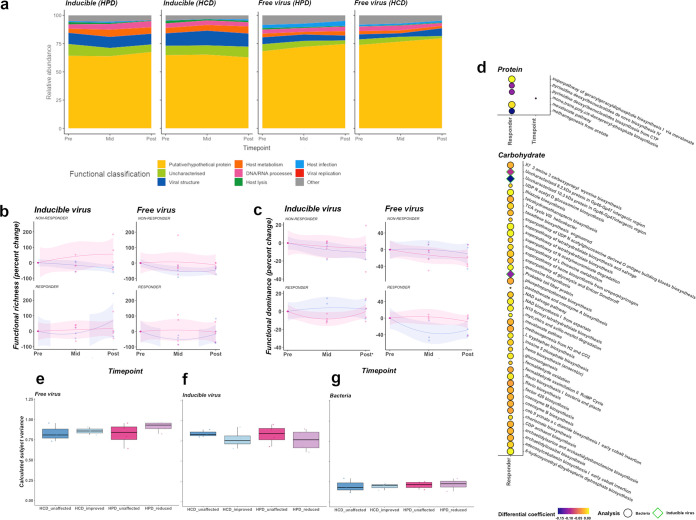
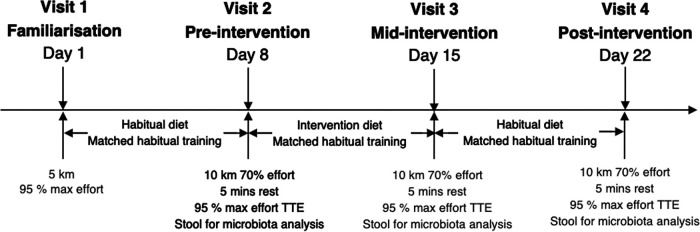
Dietary manipulation with high-protein or high-carbohydrate content are frequently employed during elite athletic training, aiming to enhance athletic performance. Such interventions are likely to impact upon gut microbial content. This study explored the impact of acute high-protein or high-carbohydrate diets on measured endurance performance and associated gut microbial community changes. In a cohort of well-matched, highly trained endurance runners, we measured performance outcomes, as well as gut bacterial, viral (FVP), and bacteriophage (IV) communities in a double-blind, repeated-measures design randomized control trial (RCT) to explore the impact of dietary intervention with either high-protein or high-carbohydrate content. High-dietary carbohydrate improved time-trial performance by +6.5% (P < 0.03) and was associated with expansion of Ruminococcus and Collinsella bacterial spp. Conversely, high dietary protein led to a reduction in performance by -23.3% (P = 0.001). This impact was accompanied by significantly reduced diversity (IV: P = 0.04) and altered composition (IV and FVP: P = 0.02) of the gut phageome as well as enrichment of both free and inducible Sk1virus and Leuconostoc bacterial populations. Greatest performance during dietary modification was observed in participants with less substantial shifts in community composition. Gut microbial stability during acute dietary periodization was associated with greater athletic performance in this highly trained, well-matched cohort. Athletes, and those supporting them, should be mindful of the potential consequences of dietary manipulation on gut flora and implications for performance, and periodize appropriately. IMPORTANCE Dietary periodization is employed to improve endurance exercise performance but may impact on gut microbial communities. Bacteriophage are implicated in bacterial cell homeostasis and have been identified as biomarkers of disequilibrium in the gut ecosystem possibly brought about through dietary periodization. We find high-carbohydrate and high-protein diets to have opposing impacts on endurance performance in highly trained athlete populations. Reduced performance is linked with disturbance of microbial stasis in the gut. We demonstrate bacteriophage communities are the most sensitive component of the gut microbiota to increased gut stress following dietary manipulation. Athletes undertaking dietary periodization should be aware of potential negative impacts of drastic changes to dietary composition on gut microbial stasis and, in turn, endurance performance.

Keywords: bacteria; bacteriophages; carbohydrate loading diet; endurance; endurance running; gut microbiome; high-protein diet; human microbiome; physical; randomized controlled trial; recovery.


Conflict of interest statement

The authors declare a conflict of interest. MF and SP have previously worked for Glaxo Smith Klyne. GH and DS have previously received funding from the same institution for investigation of the gut microbiota. Previous employers or funders had no influence on the study design, participant recruitment, results presented or the conclusions drawn here.

Figures

FIG 1
FIG 1
Illustrates longitudinal subject performance during the Max SE trial. Each point represents an individual subject through preintervention (pre), midintervention (mid), and postintervention (post), sampling time points, colored by intervention group (HCD = blue; HPD = pink). The line represents best fit of the linear regression model based on all subjects at that time point. The shaded area describes the 95% confidence intervals of the linear model.
FIG 2
FIG 2
Illustrates overall bacterial, FVP and IV communities measured at pre-, mid-, and postintervention time points for participants enrolled on both the HPD and HPC diets. Longitudinal progression of both Fisher-alpha diversity (navy line), and observed taxonomic richness (red line), are plotted for each community. Shaded area represents 95% confidence interval based on standard error. Microbial taxa included in the bar charts represent the 16 and 20 most abundant bacteria or viruses observed within the data sets, respectively.
FIG 3
FIG 3
Illustrates shifts in beta-diversity of microbial communities following both HPD (pink), and HCD (blue), interventions. Plotted are the loadings values of the primary component of principle coordinates analysis, time point is depicted by color intensity (post-/late = dark; mid- = light; pre-/early = lightest). The center of each box represents the median, edges extend to upper and lower quantiles and whiskers describe the full range of data, excluding outliers, which are plotted as individual points. Significant shifts in beta-diversity within communities are highlighted by asterisk.
FIG 4
FIG 4
Shows potential biomarkers of both HPD (a) and HCD (b) dietary intervention as identified by sPLS-DA. Significant positive (red), and negative (black), correlations with R2 values > 0.6 between features of each community are highlighted by lines joining nodes of bacterial (blue), FVP (green), and IV (red) nodes, forming the outside of the circle. Proportional abundance of each feature is illustrated by external lines colored by time point as in Fig. 2. Effect sizes of each individual feature per community are highlighted in the loadings plot and are colored by the same logic as proportional abundance.
FIG 5
FIG 5
Illustrates within and between subject variance based on Bray-Curtis of combined bacterial, FVP and IV community dissimilarity for participants enrolled in either the HCD (blue), or HPD (pink), interventions. Within subject variance explains the dissimilarity between samples from one individual across all three sampling time points. Between subject variance explains the dissimilarity between samples from different individuals enrolled on the same dietary intervention. Subjects are stratified in to “unaffected” (dark colors), or “improved” and “reduced” groups (light colors), dependent on TTE performance changes within each dietary group. Each point represents variance calculated for an individual subject. Box edges describe the upper and lower quartile ranges while the median is depicted by the central line. Whiskers extend to the full range of data points, excluding outliers.
FIG 6
FIG 6
illustrates functional gene compositions of samples. Functional composition across each time point is represented as relative abundance of functional gene classes (a). Changes in functional gene richness (b) and dominance (c) is also presented across sampling time points, stratified by responder status. Each point represents an individual sample and is colored by diet (pink = HPD; blue = HCD). Significantly differential gene features as identified by Maaslin2 are represented by individual bubbles, colored by differential coefficient and stratified by diet (d). Significance (q value) is represented by size of the bubble. Circles represent bacterial gene pathways while diamonds represent viral genes. Associations between microbial functional composition and performance during dietary intervention in FVP (e), IV (f), and bacterial (g) compartments are represented by box and whisker plots, as in Fig. 5.
FIG 7
FIG 7
Illustrates the method design employed in this study.

References

    1. Bergström J, Hermansen L, Hultman E, Saltin B. 1967. Diet, muscle glycogen and physical performance. Acta Physiol Scand 71:140–150. doi:10.1111/j.1748-1716.1967.tb03720.x. - DOI - PubMed
    1. Burke LM, Hawley JA, Wong SHS, Jeukendrup AE. 2011. Carbohydrates for training and competition. J Sports Sci 29:S17–S27. doi:10.1080/02640414.2011.585473. - DOI - PubMed
    1. Hearris MA, Hammond KM, Fell JM, Morton JP. 2018. Regulation of muscle glycogen metabolism during exercise: implications for endurance performance and training adaptations. Nutr 10:298. - PMC - PubMed
    1. Burke LM, Hawley JA, Jeukendrup A, Morton JP, Stellingwerff T, Maughan RJ. 2018. Toward a common understanding of diet–exercise strategies to manipulate fuel availability for training and competition preparation in endurance sport. Int J Sport Nutr Exerc Metab 28:451–463. doi:10.1123/ijsnem.2018-0289. - DOI - PubMed
    1. Hulston CJ, Venables MC, Mann CH, Martin C, Philp A, Baar K, Jeukendrup AE. 2010. Training with low muscle glycogen enhances fat metabolism in well-trained cyclists. Med Sci Sport Exerc 42:2046–2055. doi:10.1249/MSS.0b013e3181dd5070. - DOI - PubMed

Publication types

Substances

LinkOut - more resources