

Gut Microbiota of Obese Children Influences Inflammatory Mucosal Immune Pathways in the Respiratory Tract to Influenza Virus Infection: Optimization of an Ideal Duration of Microbial Colonization in a Gnotobiotic Pig Model
- PMID: 35579462
- PMCID: PMC9241774
- DOI: 10.1128/spectrum.02674-21
Gut Microbiota of Obese Children Influences Inflammatory Mucosal Immune Pathways in the Respiratory Tract to Influenza Virus Infection: Optimization of an Ideal Duration of Microbial Colonization in a Gnotobiotic Pig Model
Abstract
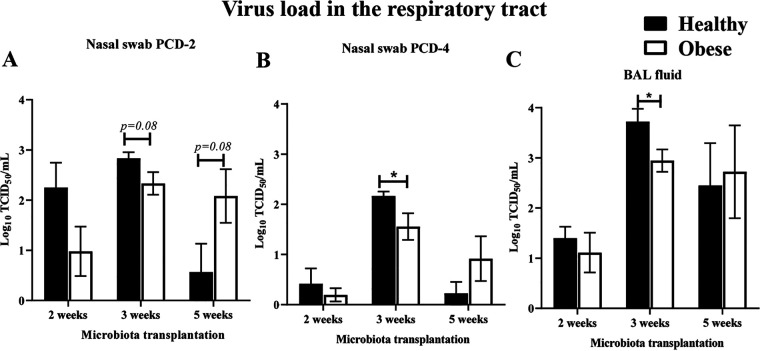
The impact of obesity on the human microbiota, immune maturation, and influenza virus infection has not been yet established in natural host animal models of influenza. In this study, gnotobiotic (Gn) pigs were colonized with human fecal microbiota (HFM) of obese (oHFM) or healthy lean (hHFM) children and infected at different periods (2-, 3-, and 5-weeks post-transplantation) using a zoonotic influenza virus strain. The infected oHFM pigs were characterized by lower levels of Firmicutes (Lactococcus, Lactobacillus, Turicibacter, and Streptococcus) and Actinobacteria (Bifidobacterium), which was associated with higher levels of Proteobacteria (Klebsiella), Bacteroidetes, and Verrucomicrobia (Akkermansia) compared with the infected hHFM group (P < 0.01). Furthermore, these genera significantly correlated with the expression of immune effectors, immune regulators, and inflammatory mediators, and displayed opposite trends between oHFM and hHFM groups (P < 0.01). The lymphoid and myeloid immune cell frequencies were differently modulated by the oHFM and hHFM colonization, especially apparent in the 5-weeks HFM colonized piglets. In addition, oHFM group had higher pro-inflammatory cytokines (IL-6, IL-12, TNF-α, and IFNγ) gene expression in the respiratory tract compared with the hHFM colonized pigs was detected. In conclusion, pigs colonized for longer duration, established oHFM increased the immune maturation favoring the activation of inflammatory mediators, however, the influenza virus load remained comparable with the hHFM group. Further, a longer duration of microbial colonization (5 weeks) may be required to reveal the impact of microbiome on the host immune maturation and susceptibility to influenza virus infection in the humanized Gn pig model. IMPORTANCE The diversity of gut microbiome of obese people differs markedly from that of lean healthy individuals which, in turn, influences the severity of inflammatory diseases because of differential maturation of immune system. The mouse model provides crucial insights into the mechanism(s) regulating the immune systems mediated by the gut microbiota but its applicability to humans is questionable because immune cells in mice are poorly activated in microbiota humanized mice. Several important strains of Bifidobacterium, Lactobacillus, and Clostridium fails to colonize the murine gut. Thus, understanding the role of certain important commensal gut bacterial species influences upon health and disease, a suitable large animal model like pig that supports the growth and colonization of most of the important human gut bacteria and possess comparable immunology and physiology to humans is beneficial to improve health.
Keywords: gnotobiotic pigs; healthy; human fecal microbiota; immune maturation; inflammation; influenza virus; obese.
Conflict of interest statement
The authors declare no conflict of interest.
Figures


Similar articles
-
Human Infant Fecal Microbiota Differentially Influences the Mucosal Immune Pathways Upon Influenza Infection in a Humanized Gnotobiotic Pig Model.Curr Microbiol. 2024 Jul 14;81(9):267. doi: 10.1007/s00284-024-03785-8. Curr Microbiol. 2024. PMID: 39003673 Free PMC article.
-
Enhanced GII.4 human norovirus infection in gnotobiotic pigs transplanted with a human gut microbiota.J Gen Virol. 2019 Nov;100(11):1530-1540. doi: 10.1099/jgv.0.001336. J Gen Virol. 2019. PMID: 31596195 Free PMC article.
-
Amish (Rural) vs. non-Amish (Urban) Infant Fecal Microbiotas Are Highly Diverse and Their Transplantation Lead to Differences in Mucosal Immune Maturation in a Humanized Germfree Piglet Model.Front Immunol. 2019 Jul 16;10:1509. doi: 10.3389/fimmu.2019.01509. eCollection 2019. Front Immunol. 2019. PMID: 31379808 Free PMC article.
-
Human microbiota-associated swine: current progress and future opportunities.ILAR J. 2015;56(1):63-73. doi: 10.1093/ilar/ilv006. ILAR J. 2015. PMID: 25991699 Free PMC article. Review.
-
The relationship among avian influenza, gut microbiota and chicken immunity: an updated overview.Poult Sci. 2022 Sep;101(9):102021. doi: 10.1016/j.psj.2022.102021. Epub 2022 Jun 26. Poult Sci. 2022. PMID: 35939896 Free PMC article. Review.
Cited by
-
Human Infant Fecal Microbiota Differentially Influences the Mucosal Immune Pathways Upon Influenza Infection in a Humanized Gnotobiotic Pig Model.Curr Microbiol. 2024 Jul 14;81(9):267. doi: 10.1007/s00284-024-03785-8. Curr Microbiol. 2024. PMID: 39003673 Free PMC article.
-
Association between gut microbiota and influenza: a bidirectional two-sample mendelian randomization study.BMC Infect Dis. 2023 Oct 17;23(1):692. doi: 10.1186/s12879-023-08706-x. BMC Infect Dis. 2023. PMID: 37848822 Free PMC article.
-
Relationship between gut microbiota and Chinook salmon (Oncorhynchus tshawytscha) health and growth performance in freshwater recirculating aquaculture systems.Front Microbiol. 2023 Feb 7;14:1065823. doi: 10.3389/fmicb.2023.1065823. eCollection 2023. Front Microbiol. 2023. PMID: 36825086 Free PMC article.
-
Influenza viruses and SARS-CoV-2 diagnosis via sensitive testing methods in clinical application.Heliyon. 2024 Aug 21;10(18):e36410. doi: 10.1016/j.heliyon.2024.e36410. eCollection 2024 Sep 30. Heliyon. 2024. PMID: 39381246 Free PMC article. Review.
-
Influenza and the gut microbiota: A hidden therapeutic link.Heliyon. 2024 Sep 10;10(18):e37661. doi: 10.1016/j.heliyon.2024.e37661. eCollection 2024 Sep 30. Heliyon. 2024. PMID: 39315196 Free PMC article. Review.
References
-
- Wang B, Yao M, Lv L, Ling Z, Li L. 2017. The human microbiota in health and disease. Engineering 3:71–82. doi:10.1016/J.ENG.2017.01.008. - DOI
Publication types
MeSH terms
Substances
LinkOut - more resources
Full Text Sources
Medical
