. 2022 Jul 15;132(14):e157644.
doi: 10.1172/JCI157644.

KRAS mutant-driven SUMOylation controls extracellular vesicle transmission to trigger lymphangiogenesis in pancreatic cancer

Affiliations

KRAS mutant-driven SUMOylation controls extracellular vesicle transmission to trigger lymphangiogenesis in pancreatic cancer

Yuming Luo et al. J Clin Invest. .

Abstract

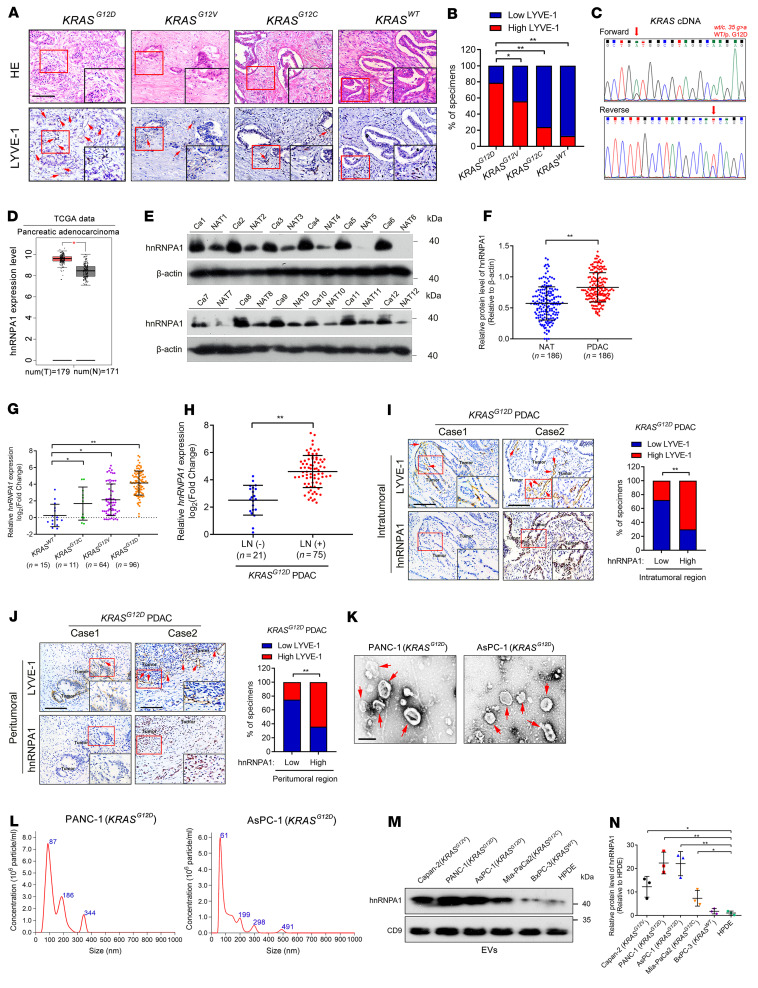
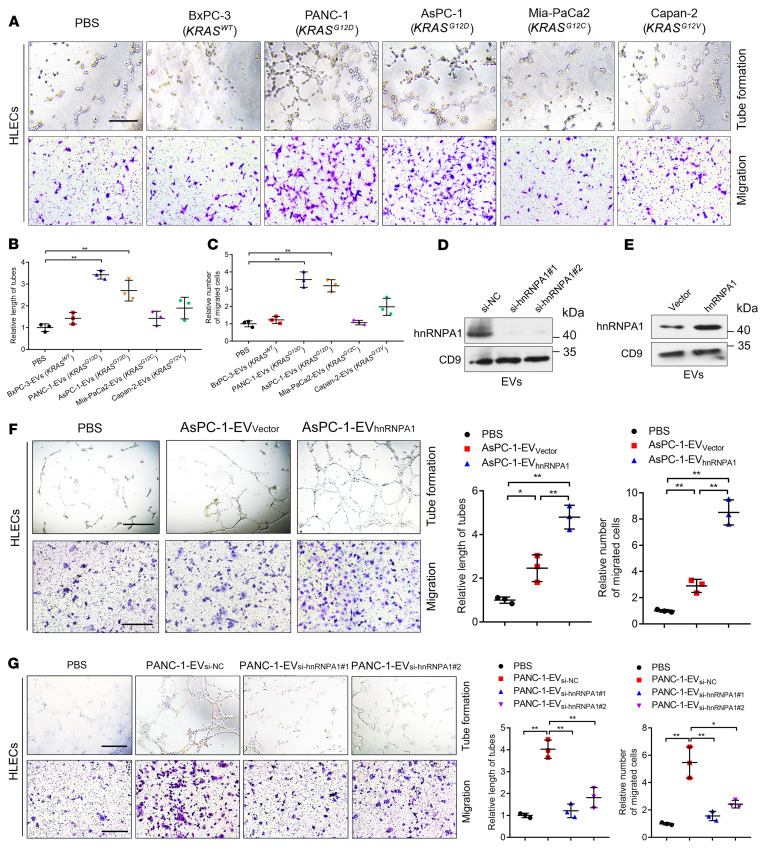
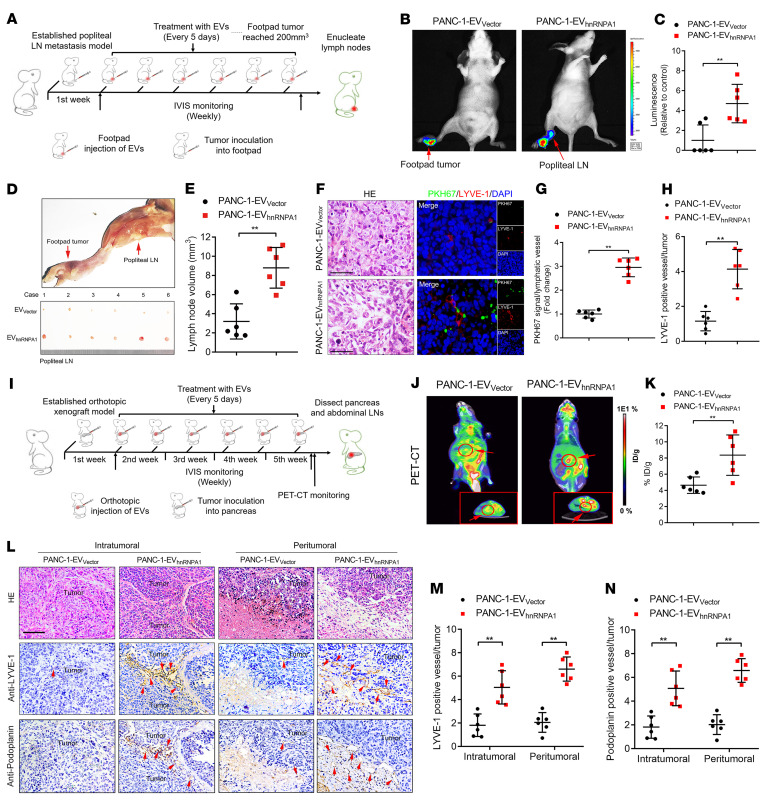
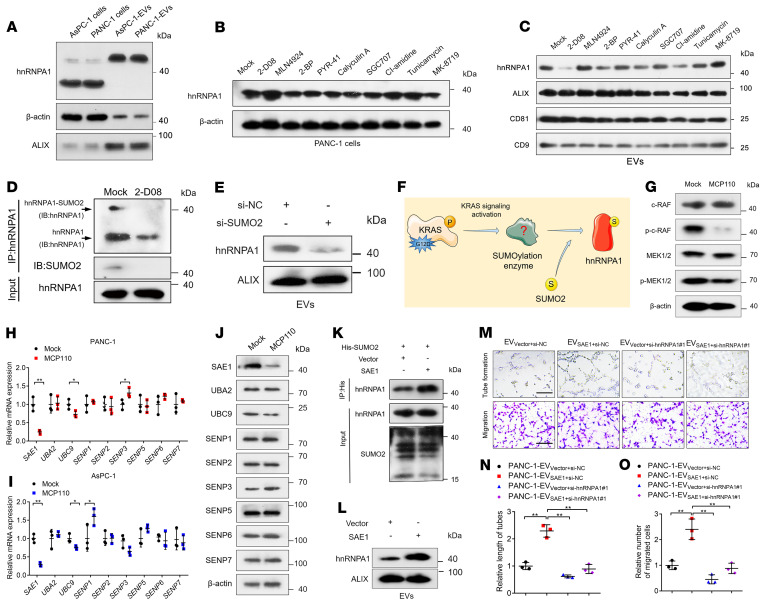
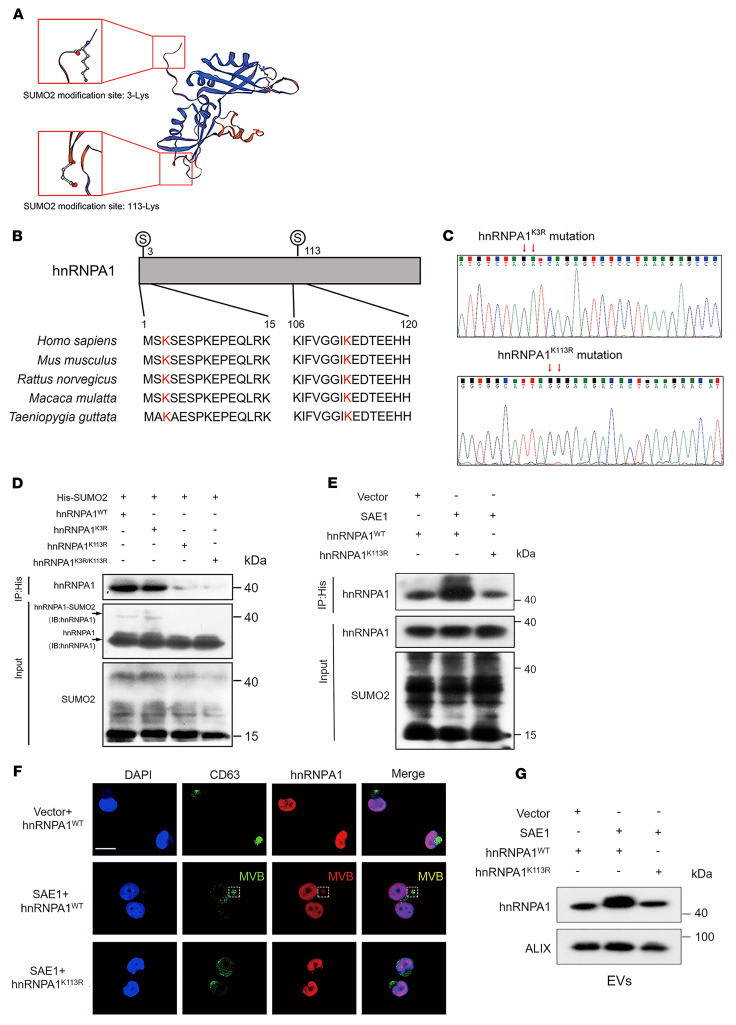
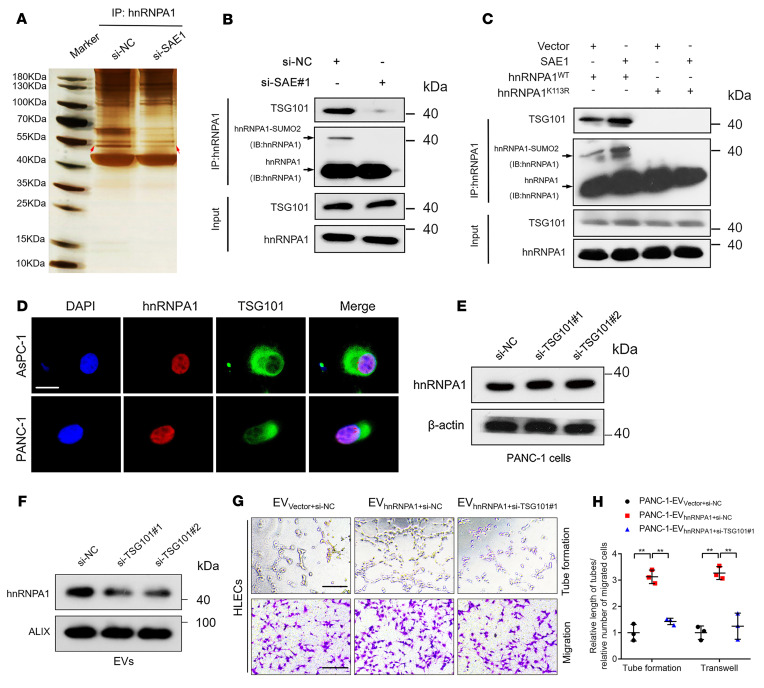
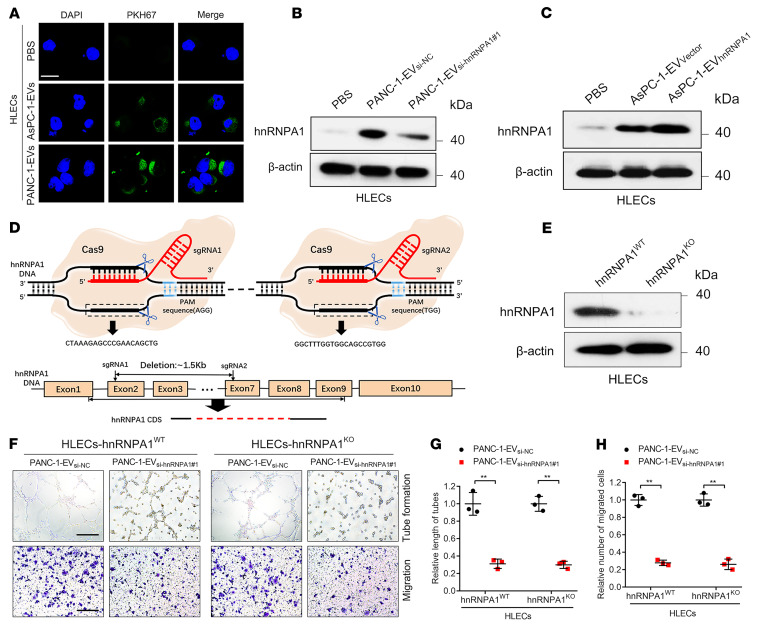
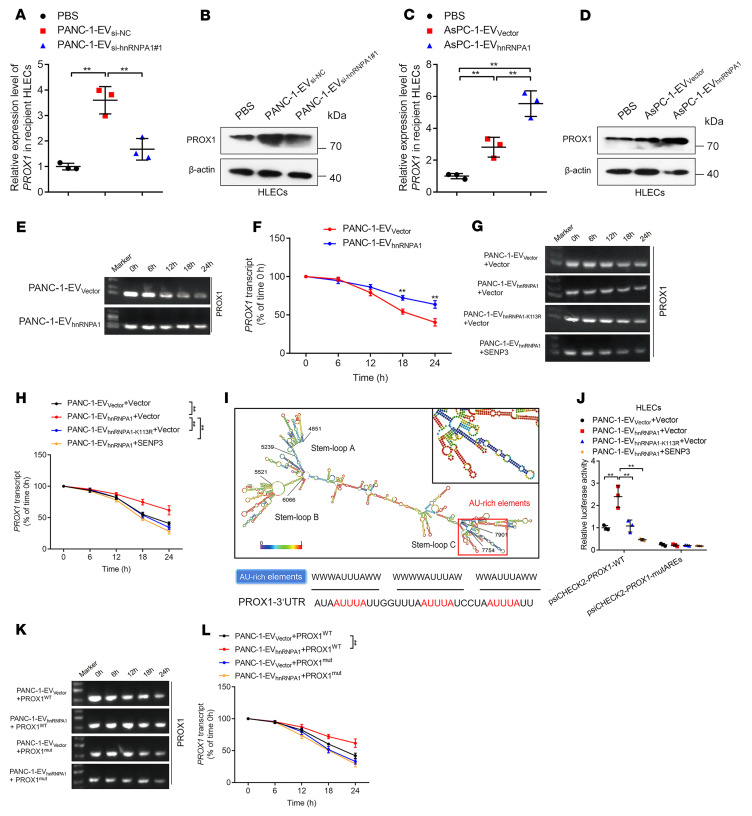
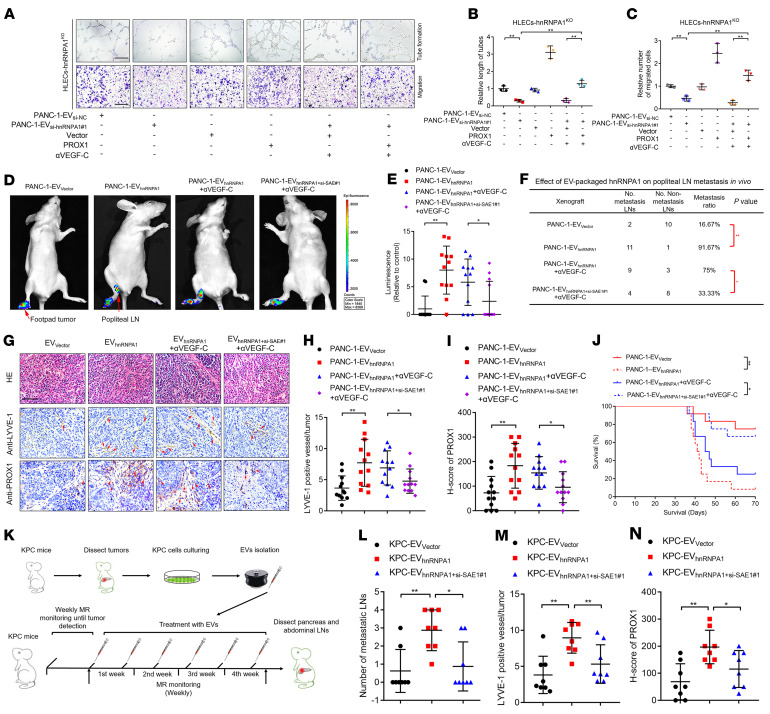
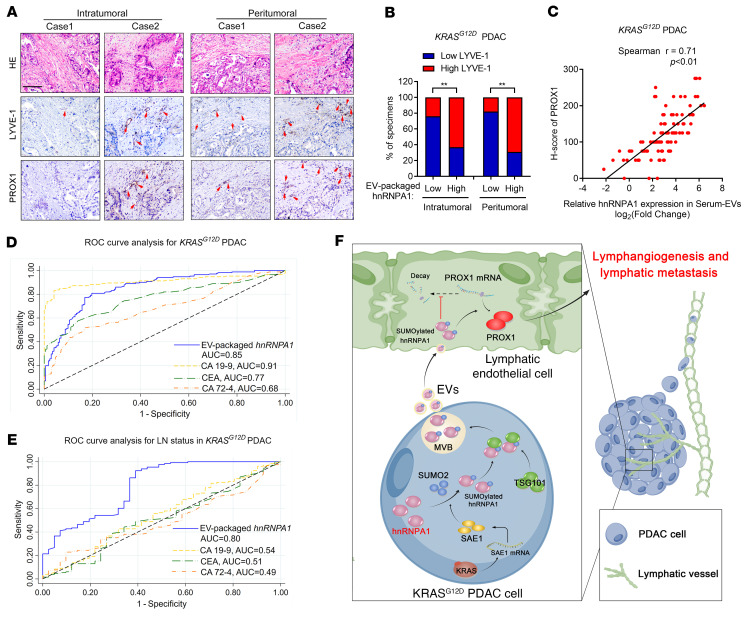
Lymph node (LN) metastasis occurs frequently in pancreatic ductal adenocarcinoma (PDAC) and predicts poor prognosis for patients. The KRASG12D mutation confers an aggressive PDAC phenotype that is susceptible to lymphatic dissemination. However, the regulatory mechanism underlying KRASG12D mutation-driven LN metastasis in PDAC remains unclear. Herein, we found that PDAC with the KRASG12D mutation (KRASG12D PDAC) sustained extracellular vesicle-mediated (EV-mediated) transmission of heterogeneous nuclear ribonucleoprotein A1 (hnRNPA1) in a SUMOylation-dependent manner and promoted lymphangiogenesis and LN metastasis in vitro and in vivo. Mechanistically, hnRNPA1 bound with SUMO2 at the lysine 113 residue via KRASG12D-induced hyperactivation of SUMOylation, which enabled its interaction with TSG101 to enhance hnRNPA1 packaging and transmission via EVs. Subsequently, SUMOylation induced EV-packaged-hnRNPA1 anchoring to the adenylate- and uridylate-rich elements of PROX1 in lymphatic endothelial cells, thus stabilizing PROX1 mRNA. Importantly, impeding SUMOylation of EV-packaged hnRNPA1 dramatically inhibited LN metastasis of KRASG12D PDAC in a genetically engineered KrasG12D/+ Trp53R172H/+ Pdx-1-Cre (KPC) mouse model. Our findings highlight the mechanism by which KRAS mutant-driven SUMOylation triggers EV-packaged hnRNPA1 transmission to promote lymphangiogenesis and LN metastasis, shedding light on the potential application of hnRNPA1 as a therapeutic target in patients with KRASG12D PDAC.

Keywords: Cancer; Lymph; Molecular biology; Oncology.


Figures

Figure 1
Figure 1. HnRNPA1 correlates with LN metastasis of KRASG12D PDAC.
(A and B) Representative H&E-stained and IHC images (A) and percentages of LYVE-1–positive lymphatic vessel density (B) in PDAC according to KRAS subtype (KRASWT, n = 15; KRASG12C, n = 11; KRASG12V, n = 64; KRASG12D, n = 96). Scale bars: 50 μm (black) or 25 μm (red). The χ2 test was used. (C) Sequencing evaluation of the KRASG12D mutation. (D) HnRNPA1 expression in PDAC and normal pancreatic tissues was analyzed using data from TCGA database. The nonparametric Mann-Whitney U test was used. (E and F) Representative Western blotting images and quantification of hnRNPA1 expression in PDAC tissues and paired normal adjacent tissue (NAT) (n = 186). The nonparametric Mann-Whitney U test was used. (G) qRT-PCR of hnRNPA1 expression in PDAC tissues (n = 186) according to KRAS subtype. The nonparametric Mann-Whitney U test was used. (H) qRT-PCR of hnRNPA1 expression in LN-positive and LN-negative KRASG12D PDAC tissues (n = 186). The nonparametric Mann-Whitney U test was used. (I and J) Representative images and percentages of IHC staining for hnRNPA1 expression and LYVE-1–positive lymphatic vessel density in KRASG12D PDAC. Scale bars: 50 μm. The χ2 test was used. (K and L) TEM- (K) and NanoSight-characterized (L) EVs secreted by KRASG12D PDAC cells. Scale bar: 100 nm. (M and N) Western blotting images and quantification of hnRNPA1 expression in EVs secreted by PDAC cells with different KRAS subtypes and HPDE cells. One-way ANOVA followed by Dunnett’s test was used. Data are presented as mean ± SD; 3 independent experiments were performed in KN. The box-and-whisker plot in D represents medians with minimum and maximum values. The top and bottom of the box represent the first and third quartiles. *P < 0.05, **P < 0.01.
Figure 2
Figure 2. EV-packaged hnRNPA1 promotes lymphangiogenesis in vitro.
(AC) Representative images (A) and quantification of tube formation and migration (B and C) for HLECs treated with PBS or PDAC cell–secreted EVs. Scale bar: 100 μm. One-way ANOVA followed by Dunnett’s test was used. (D and E) Western blotting analysis of hnRNPA1 protein levels in PANC-1 cell–secreted EVs after hnRNPA1 silencing or overexpression. (F and G) Representative images and quantification of tube formation and migration by HLECs treated with PBS or indicated EVs. Scale bars: 100 μm. One-way ANOVA followed by Dunnett’s test was used. Data are presented as mean ± SD of 3 independent experiments. *P < 0.05, **P < 0.01.
Figure 3
Figure 3. EV-packaged hnRNPA1 induces LN metastasis of KRASG12D PDAC in vivo.
(A) Schematic representation of the establishment of the popliteal lymphatic metastasis model. (B and C) Representative images (B) and quantification (C) of bioluminescence of the popliteal metastatic LNs (n = 6 per group). Red arrows: Footpad tumor and metastatic popliteal LNs. The 2-tailed Student’s t test was used. (D and E) Representative image (D) of popliteal lymphatic metastasis model. Quantification (E) of the popliteal LN volume is shown. Red arrows: Footpad tumor and metastatic popliteal LNs. The 2-tailed Student’s t test was used. (FH) Representative H&E-stained and immunofluorescence images (F) and quantification of PKH67-labeled EVs (G) or LYVE-1–positive lymphatic vessel density (H) in footpad tumors. Scale bars: 50 μm. The 2-tailed Student’s t test was used. (I) Schematic representation of orthotopic xenograft model establishment. (J and K) Representative images of PET-CT images of orthotopic tumors. Red arrows: Orthotopic tumor. 18FDG accumulation in the pancreas was assessed (n = 6 per group). ID, injected dose. The 2-tailed Student’s t test was used. (LN) Representative H&E-stained and IHC images (L) and quantification (M and N) of LYVE-1–positive or podoplanin-positive lymphatic vessel density in orthotopic tumors (n = 6 per group). Scale bar: 50 μm. The 2-tailed Student’s t test was used. Data are presented as mean ± SD; 3 independent experiments were performed. *P < 0.05, **P < 0.01.
Figure 4
Figure 4. KRAS signaling–induced SAE1 overexpression catalyzes the SUMOylation of hnRNPA1.
(A) Western blotting analysis of hnRNPA1 expression in PDAC cells and the corresponding EVs. (B and C) Western blotting assessment of hnRNPA1 expression in PANC-1 cells (B) and the corresponding EVs (C) after treatment with PBS or indicated inhibitors of PTMs. (D) IP assessment of SUMO2 binding to hnRNPA1 after 2-D08 treatment. IB, immunoblot. (E) Western blotting analysis of hnRNPA1 expression in EVs secreted by PANC-1 cells after SUMO2 silencing. (F) Schematic illustration of the hypothesis of KRASG12D-induced SUMOylation of hnRNPA1. (G) Western blotting analysis of the KRAS downstream pathway in PANC-1 cells after treatment with MCP110. (HJ) qRT-PCR (H and I) and Western blotting analysis (J) of SUMOylation enzyme expression in PDAC cells after MCP110 treatment. The 2-tailed Student’s t test was used. (K) Co-IP assessment of SUMO2 binding to hnRNPA1 after SAE1 overexpression. (L) Western blotting analysis of hnRNPA1 expression in PANC-1 cell–secreted EVs after SAE1 overexpression. (MO) Representative images (M) and quantification of tube formation (N) and migration (O) of HLECs treated with indicated EVs. Scale bars: 100 μm. One-way ANOVA followed by Dunnett’s test was used. Data are presented as mean ± SD of 3 independent experiments. *P < 0.05, **P < 0.01.
Figure 5
Figure 5. HnRNPA1 is SUMOylated at residue K113.
(A) Schematic illustration of the predicted SUMO2 binding sites on hnRNPA1 obtained from GST-SUMO. (B) Sequence alignment of hnRNPA1 homologs in various species. (C) Sequencing evaluation of the hnRNPA1K3R and hnRNPA1K113R mutations. (D and E) Co-IP assays assessing the SUMO2 binding sites on hnRNPA1 and its regulation by SAE1. IB, immunoblot. (F) Representative immunofluorescence images of hnRNPA1 accumulation in CD63-positive MVBs in PANC-1 cells. Scale bar: 5 μm. (G) Western blotting analysis of hnRNPA1 expression in indicated EVs.
Figure 6
Figure 6. SUMOylated hnRNPA1 is packaged into EVs by interacting with TSG101.
(A and B) Co-IP assay followed by silver staining (A) and Western blotting analysis (B) for detecting SUMOylated-hnRNPA1–interacting proteins in PANC-1 cells with or without SAE1 knockdown. IB, immunoblot. (C) Co‑IP assays analyzing the interaction of hnRNPA1 and TSG101 mediated by SAE1-induced SUMOylation on hnRNPA1. (D) Representative immunofluorescence images of hnRNPA1 and TSG101 colocalization in PDAC cells. Scale bar: 5 μm. (E and F) Western blotting analysis of hnRNPA1 expression in PANC-1 cells (E) and corresponding EVs (F) after TSG101 knockdown. (G and H) Representative images and quantification of tube formation and migration of HLECs treated with indicated EVs. Scale bars: 100 μm. One-way ANOVA followed by Dunnett’s test was used. Data are presented as mean ± SD of 3 independent experiments. **P < 0.01.
Figure 7
Figure 7. EV-packaged hnRNPA1 is delivered to HLECs.
(A) Representative fluorescence images of HLECs after incubation with PKH67-labeled EVs. Scale bar: 5 μm. (B and C) Western blotting analysis of hnRNPA1 expression in PBS- or EV-treated HLECs. (D) Schematic representation of CRISPR/Cas9-mediated hnRNPA1 deletion in HLECs. (E) Western blotting analysis validation of hnRNPA1 knockout in HLECs. (FH) Representative images (F) and quantification of tube formation (G) and migration (H) of EV-treated hnRNPA1WT or hnRNPA1KO HLECs. Scale bars: 100 μm. The 2-tailed Student’s t test was used. Data are presented as mean ± SD of 3 independent experiments. **P < 0.01.
Figure 8
Figure 8. EV-packaged hnRNPA1 enhances PROX1 mRNA stability in HLECs.
(AD) qRT-PCR (A and C) and Western blotting analysis (B and D) of PROX1 expression in PBS- or EV-treated HLECs. One-way ANOVA followed by Dunnett’s test was used. (EH) Representative agarose electrophoresis images and quantification of actinomycin assays for PROX1 mRNA in indicated EV-treated HLECs with or without SENP3 overexpression. The 2-tailed Student’s t test (F) or 1-way ANOVA followed by Dunnett’s test was used (H). (I) Schematic illustration of the AREs in the PROX1 mRNA 3′-UTR. (J) Dual-luciferase assays of wild-type or ARE-mutated PROX1 in HLECs. One-way ANOVA followed by Dunnett’s test was used. (K and L) Representative agarose electrophoresis images (K) and quantification (L) of actinomycin assays for PROX1 mRNA in EV-treated HLECs with or without ARE mutation in the PROX1 mRNA. One-way ANOVA followed by Dunnett’s test was used. Data are presented as mean ± SD of 3 independent experiments. **P < 0.01.
Figure 9
Figure 9. PROX1 is indispensable for EV-packaged-hnRNPA1–induced lymphangiogenesis and LN metastasis of KRASG12D PDAC.
(A–C) Representative images and quantification of tube formation and migration of PANC-1-EVsi-NC– or PANC-1-EVsi-hnRNPA1#1–treated hnRNPA1KO HLECs with or without PROX1 overexpression and VEGF-C–neutralizing antibody. Scale bars: 100 μm. One-way ANOVA followed by Dunnett’s test was used. (D and E) Representative images and quantification of bioluminescence of the popliteal metastatic LNs (n = 12 per group). One-way ANOVA followed by Dunnett’s test was used. (F) The analysis of LN metastasis rate in indicated groups of popliteal LN metastasis model. The χ2 test was used. (GI) Representative H&E-stained and IHC images and quantification of LYVE-1–positive lymphatic vessels and PROX1 expression in footpad tumors. Scale bar: 50 μm. One-way ANOVA followed by Dunnett’s test was used. (J) Kaplan-Meier curves for the nude mice. (K) Schematic representation of KPC mouse model establishment (n = 8 per group). One-way ANOVA followed by Dunnett’s test was used. (L) Quantification of the metastatic number of peripancreatic LNs. One-way ANOVA followed by Dunnett’s test was used. (M and N) Quantification of IHC analysis for LYVE-1–positive lymphatic vessels and PROX1 expression in pancreatic tumors. One-way ANOVA followed by Dunnett’s test was used. Data are presented as mean ± SD of 3 independent experiments. *P < 0.05, **P < 0.01.
Figure 10
Figure 10. EV-packaged hnRNPA1 correlates with LN metastasis of patients with KRASG12D PDAC.
(AC) Representative images (A) for determination of LYVE-1–positive lymphatic vessel density and PROX1 expression in KRASG12D PDAC according to EV-packaged-hnRNPA1 expression. The percentages of IHC staining for LYVE-1–positive lymphatic vessel density and the correlation between EV-packaged hnRNPA1 and PROX1 expression were analyzed (B and C). Scale bar: 50 μm. The χ2 test was used. (D and E) ROC analysis of the diagnostic efficiency of serum EV-packaged hnRNPA1, CA19-9, CEA, and CA72-4 for KRASG12D PDAC (D) or LN metastasis (E) of KRASG12D PDAC. (F) Proposed model of KRAS signaling–induced SUMOylation of EV-packaged hnRNPA1 that mediates PROX1 mRNA stability for facilitating KRASG12D PDAC LN metastasis. Data are presented as mean ± SD of 3 independent experiments. **P < 0.01.

Comment in

References

    1. Ho WJ, et al. The tumour microenvironment in pancreatic cancer - clinical challenges and opportunities. Nat Rev Clin Oncol. 2020;17(9):527–540. doi: 10.1038/s41571-020-0363-5. - DOI - PMC - PubMed
    1. Park W, et al. Pancreatic cancer: a review. JAMA. 2021;326(9):851–862. doi: 10.1001/jama.2021.13027. - DOI - PMC - PubMed
    1. Kong Y, et al. circNFIB1 inhibits lymphangiogenesis and lymphatic metastasis via the miR-486-5p/PIK3R1/VEGF-C axis in pancreatic cancer. Mol Cancer. 2020;19(1):82. doi: 10.1186/s12943-020-01205-6. - DOI - PMC - PubMed
    1. Kadera BE, et al. Locally advanced pancreatic cancer: association between prolonged preoperative treatment and lymph-node negativity and overall survival. JAMA Surg. 2014;149(2):145–153. doi: 10.1001/jamasurg.2013.2690. - DOI - PubMed
    1. Chen C, et al. Exosomal long noncoding RNA LNMAT2 promotes lymphatic metastasis in bladder cancer. J Clin Invest. 2020;130(1):404–421. - PMC - PubMed

Publication types

Substances