. 2022 Jul 1;132(13):e158885.
doi: 10.1172/JCI158885.

Stromal Notch ligands foster lymphopenia-driven functional plasticity and homeostatic proliferation of naive B cells

Affiliations

Stromal Notch ligands foster lymphopenia-driven functional plasticity and homeostatic proliferation of naive B cells

Daniela Gómez Atria et al. J Clin Invest. .

Abstract

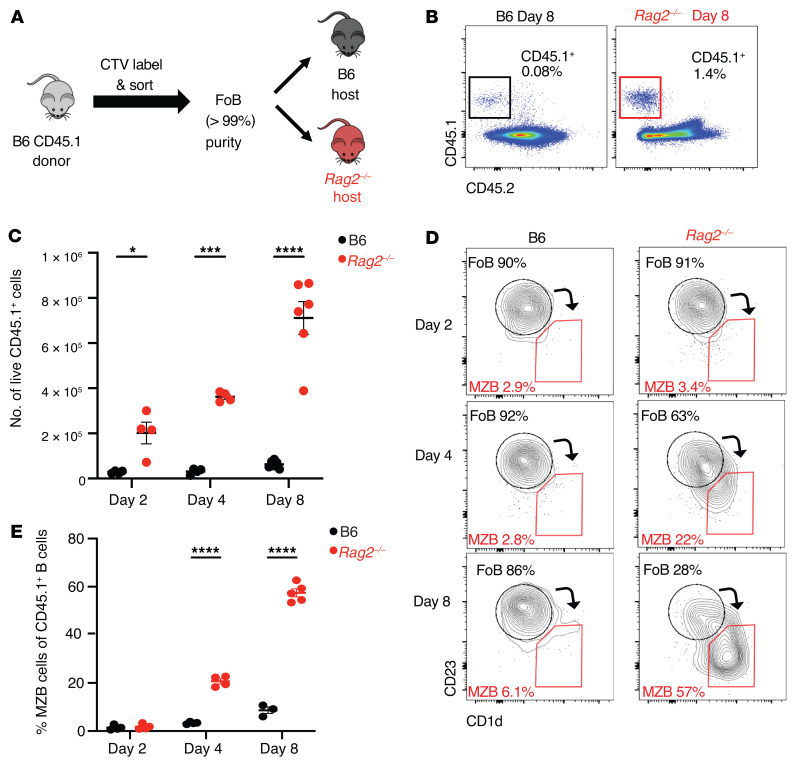
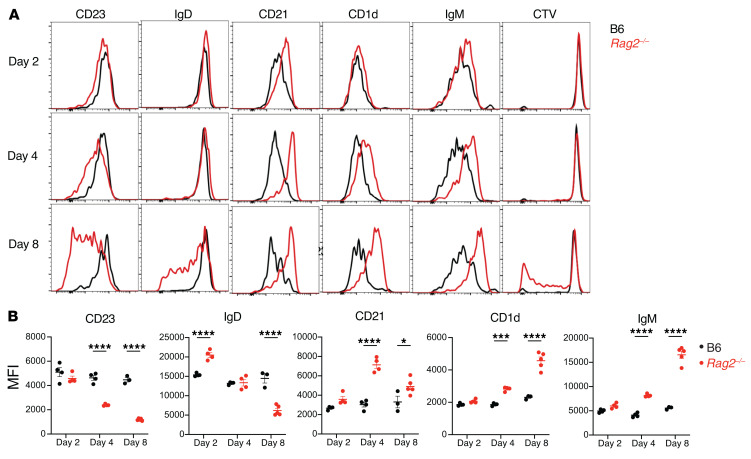
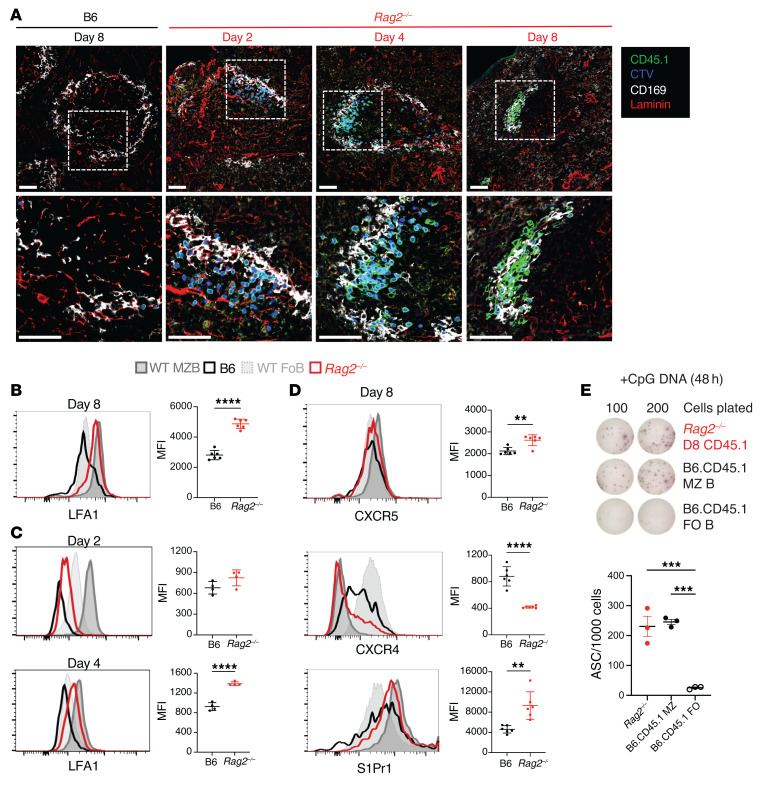
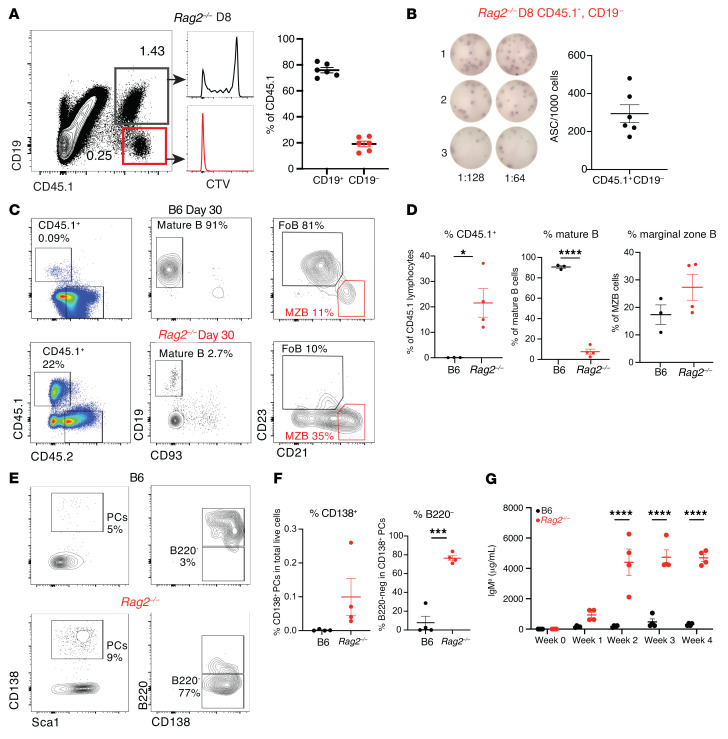
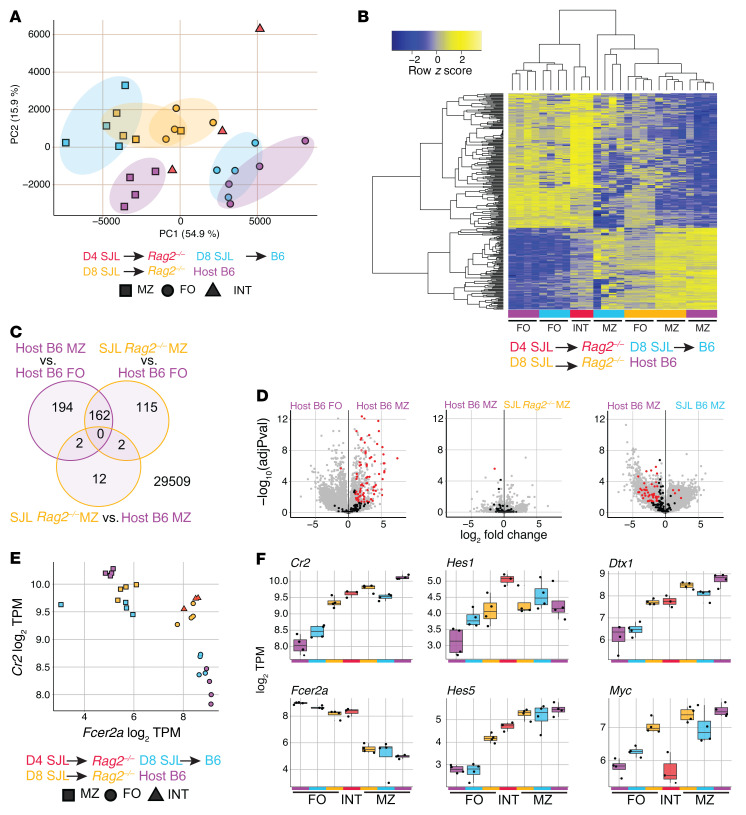
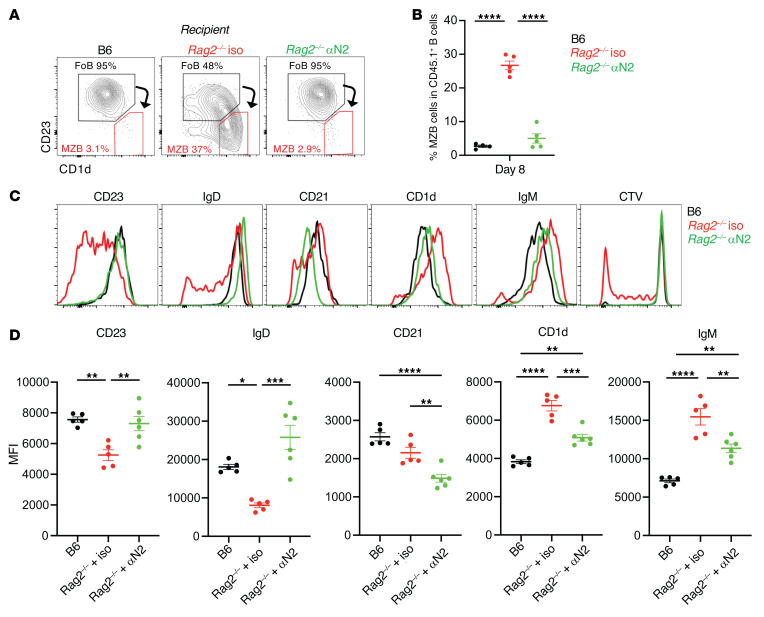
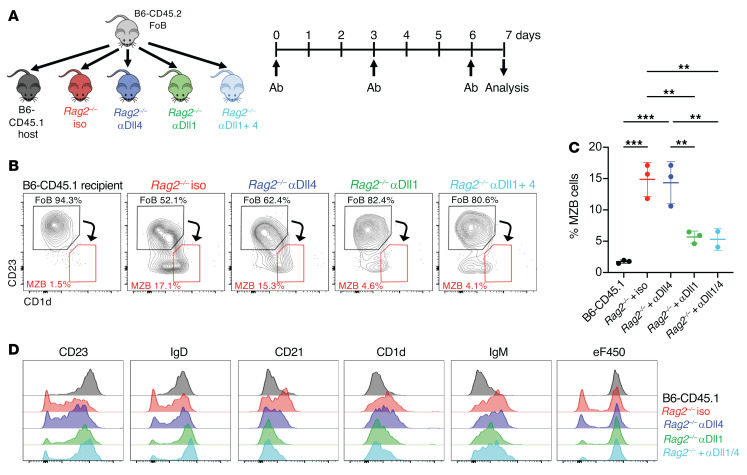
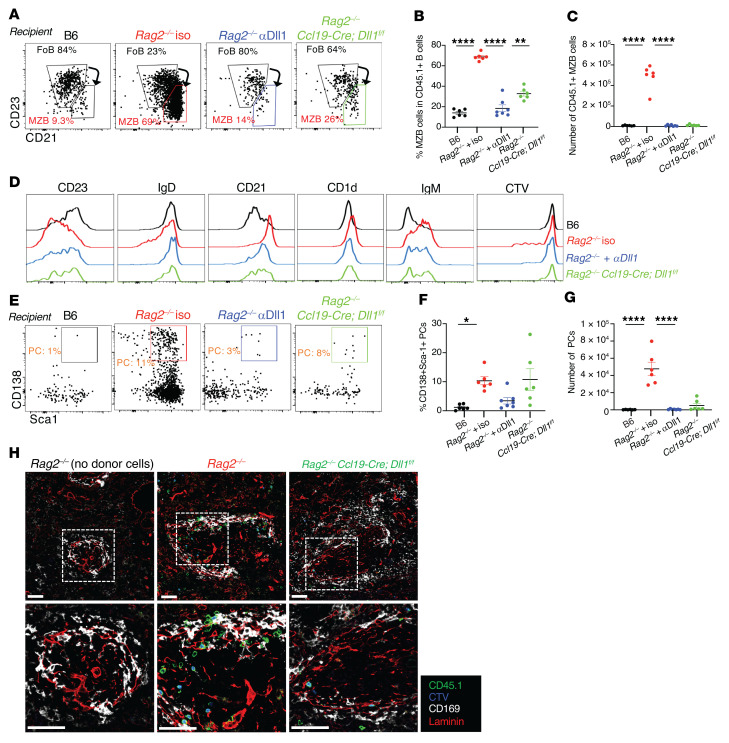
In lymphopenic environments, secondary lymphoid organs regulate the size of B and T cell compartments by supporting the homeostatic proliferation of mature lymphocytes. The molecular mechanisms underlying these responses and their functional consequences remain incompletely understood. To evaluate homeostasis of the mature B cell pool during lymphopenia, we turned to an adoptive transfer model of purified follicular B cells into Rag2-/- mouse recipients. Highly purified follicular B cells transdifferentiated into marginal zone-like B cells when transferred into Rag2-/- lymphopenic hosts but not into wild-type hosts. In lymphopenic spleens, transferred B cells gradually lost their follicular phenotype and acquired characteristics of marginal zone B cells, as judged by cell surface phenotype, expression of integrins and chemokine receptors, positioning close to the marginal sinus, and an ability to rapidly generate functional plasma cells. Initiation of follicular to marginal zone B cell transdifferentiation preceded proliferation. Furthermore, the transdifferentiation process was dependent on Notch2 receptors in B cells and expression of Delta-like 1 Notch ligands by splenic Ccl19-Cre+ fibroblastic stromal cells. Gene expression analysis showed rapid induction of Notch-regulated transcripts followed by upregulated Myc expression and acquisition of broad transcriptional features of marginal zone B cells. Thus, naive mature B cells are endowed with plastic transdifferentiation potential in response to increased stromal Notch ligand availability during lymphopenia.

Keywords: Adaptive immunity; Immunoglobulins; Immunology.


Figures

Figure 1
Figure 1. Follicular B cells adoptively transferred into lymphopenic hosts progressively acquire a marginal zone B cell phenotype.
Highly purified congenically marked B6-CD45.1+ FoB cells were adoptively transferred (i.v.) into B6 or Rag2–/– hosts. Flow cytometry was performed on recipient spleen on days 2, 4, and 8 after transfer. (A) Experimental model. (B) Flow cytometric identification of donor-derived CD45.1+ cells recovered from B6 and Rag2–/– mice 8 days after transfer, gated on single live lymphocytes. (C) Absolute number of CD45.1+ donor-derived lymphocytes at days 2, 4, and 8 after transfer in B6 (black) or Rag2–/– (red) recipients. Data shown as mean ± SEM. (D) Analysis of adoptively transferred CD45.1+ FoB cells 2, 4, and 8 days after transfer by CD23 and CD1d expression in B6 (left) and Rag2–/– (right) recipients. Arrows depict shifts in cell surface phenotype. (E) Percentage of CD45.1+ cells that acquired a MZB cell phenotype by days 2, 4, and 8. Each data point represents an individual mouse. *P < 0.05, ***P < 0.001, and ****P < 0.0001, by 2-way ANOVA.
Figure 2
Figure 2. Follicular B cells transferred into lymphopenic hosts acquire a marginal zone B cell phenotype and then proliferate.
Highly purified congenically marked B6-CD45.1+ FoB cells were labeled with CTV and adoptively transferred (i.v.) into B6 or Rag2–/– hosts. Flow cytometry was performed on recipient spleen on days 2, 4, and 8 after transfer. (A) Histograms depicting cell surface expression of markers and CTV dilution in CD45.1+ B cells recovered from B6 (black) and Rag2–/– (red) recipients. One representative sample of 3–4 mice is shown. (B) Quantification of the MFI for the indicated markers. Each data point represents an individual mouse. *P < 0.05, ***P < 0.001, and ****P < 0.0001, by 2-way ANOVA.
Figure 3
Figure 3. Follicular B cells transferred into lymphopenic hosts localize to marginal zone–like structures in splenic follicles and acquire integrin and chemoattractant receptor expression of marginal zone B cells.
Congenically marked CD45.1+ FoB cells were labeled with CTV and adoptively transferred into B6 or Rag2–/– hosts. Flow cytometry and immunofluorescence microscopy were then performed on recipient spleens. (A) Immunofluorescence microscopy of spleen sections of B6 and Rag2–/– recipients at the indicated time points after adoptive transfer, with labeled CD45.1+ cells (green), CTV (blue), CD169 (white), and laminin (red). Proliferating cells that dilute CTV appear lighter in color. Dotted regions are magnified in the second row of images. One representative sample out of 4 is shown. Scale bars:50 μm. (BD) Histograms depict the expression of LFA-1, S1Pr1, CXCR5, and CXCR4 among resting donor FoB or MZB cells from B6-CD45.1 donor mice (light/dark gray) or CD45.1+ B cells recovered from B6 (black) and Rag2–/– (red) recipients on day 8 after transfer (B and D) and on days 2 and 4 (C). Graphs quantify the MFI of indicated surface markers among CD45.1+ B cells recovered from B6 or Rag2–/– recipients. Data are shown as the mean ± SEM. **P < 0.01 and ****P < 0.0001, by 2-tailed Student’s t test. (E) Donor-derived CD45.1+CD19+ B cells recovered from Rag2–/– recipients at day 8 after transfer and freshly sorted B6-CD45.1 MZB and FoB cells were stimulated in culture with CpG DNA for 2 days. Antibody secretion from live cells was assessed by ELISpot. Representative wells are displayed and the number of antibody-secreting cells (ASCs) per 1000 live cells in culture is shown (individual data points indicate the mean ± SEM). ***P < 0.001, by 1-way ANOVA, Tukey’s post test. (BE) Each data point represents an individual mouse.
Figure 4
Figure 4. Transdifferentiated B cells give rise to functional plasma cells in lymphopenic mice.
Congenically marked B6-C20-CD45.1+ FoB cells (Igha) were adoptively transferred into B6 or Rag2–/– hosts. (A) CTV-labeled CD45.1+ donor-derived cells were assessed at day 8 after transfer for CD19 expression and cell division (CTV dilution). (B) CD45.1+CD19 cells sorted from Rag2–/– recipient spleens at day 8 after transfer were plated in a serial dilution ELISpot assay. Numbers of CD45.1+ cells sorted by CD19 expression in each mouse are shown with representative ELISpot wells. Each data point represents an individual mouse. (C) Flow cytometry performed on recipient splenocytes 30 days after transfer. CD45.1+ mature FoB and MZB-like cell populations as detected in the spleen of B6 (top) and Rag2–/– (bottom) adoptive transfer recipients on day 30. One representative of 4 is shown. (D) Percentages of CD45.1+ lymphocytes, CD19+ B cells, and MZB cells, respectively. Data shown as mean ± SEM. (E) CD138+Sca-1+ plasma cells (PCs, left) and B220+CD138+ and B220CD138+ PCs (right) detected in B6 and Rag2–/– recipient spleens at day 30 after transfer. (F) Percentages of CD138+ total PCs (left) and B220 PCs (right). (G) Quantification of donor-derived serum IgMa concentration in B6 (black) and Rag2–/– (red) recipients at the indicated time points after transfer. (D, F, and G) *P < 0.05, ***P < 0.001, and ****P < 0.0001, by 2-way ANOVA. Each data point represents an individual mouse.
Figure 5
Figure 5. Follicular B cells adoptively transferred into a lymphopenic environment attain a full marginal zone B cell transcriptome and upregulate a broad Notch signature.
Congenically marked B6-CD45.1 FoB cells were labeled with CTV and i.v. transferred to either B6 or Rag2–/– hosts. RNA-Seq was then performed on B cells twice-sorted from animals euthanized after 4 and 8 days, sorting first on CD45.1/2 and second on follicular or marginal zone B cell gates (d8) or intermediate gates (d4) (see Supplemental Figure 2). (A) Principal component analysis of all samples with colors indicating transfer groups and times and shapes indicating cell-type sort gates. (B) Expression of a MZB/FoB signature — defined as genes differentially expressed between host B6 MZB and FoB cells (adjusted P value < 0.01, log2 fold change > 2) — is shown for all samples as the z score across each row. Samples in columns are hierarchically clustered by Spearman’s correlation. (C) Venn diagrams displaying differential gene testing results of the indicated comparisons. Shown are the number of genes differential (adjusted P value < 0.01, log2 fold change > 2) without respect to direction. (D) Volcano plots indicating the magnitude and significance of gene expression changes between indicated groups for all (gray), and highlighted (black/red) empirically defined MZB cell Notch2-regulated genes (genes significantly downregulated in MZB cells after 24 hours of anti-N2 antibody blockade) (28). Red indicates significance (adjusted P < 0.05; log2 fold change > 1). (BD) Differential expression was calculated by empirical Bayes method with Benjamini-Hochberg correction with indicated cutoffs. (E and F) Log2 transcripts per million (TPM) are shown for indicated genes as 2-gene correlation (E) and selected individual genes (F). Adoptive transfer groups are shown by color, and sort gate is indicated by shape.
Figure 6
Figure 6. Notch2 signals are required for the transdifferentiation of follicular B cells into marginal zone–like B cells in lymphopenic recipients.
Congenically marked CD45.1+ FoB cells were labeled with CTV and adoptively transferred into B6 or Rag2–/– hosts treated with isotype control or anti-Notch2 antibodies on days 0, 3, and 6 after transfer. (A) Representative flow cytometry plots depicting live CD45.1+CD19+CD93 donor-derived mature B cells recovered at day 8 from B6 or indicated Rag2–/– recipients. (B) Percentage of CD45.1+ MZB cells at day 8 in each recipient group. Data shown as mean ± SEM. (C) Histograms depicting cell surface expression of markers and CTV dilution among donor-derived CD45.1+ B cells in B6 (black), Rag2–/– recipients treated with isotype control antibodies (Iso, red), or Rag2–/– recipients treated with anti-Notch2 antibodies (green). Results are representative of 2 independent experiments. (D) Quantification of the MFI for the indicated markers. (B and D) *P < 0.05, ***P < 0.001, and ****P < 0.0001, by 1-way ANOVA. Each data point represents an individual mouse.
Figure 7
Figure 7. B cell homeostatic responses to lymphopenia depends on Delta-like 1 Notch ligands.
Congenically marked CD45.2+ FoB cells were labeled with eF450 and adoptively transferred into B6-CD45.1 or Rag2–/– recipients treated with isotype control or anti-Dll1, anti-Dll4, or both antibodies at days 0, 3, and 6 after transfer. Flow cytometric analysis of recipient spleens was performed at day 8 after transfer. (A) Experimental model. (B) Representative flow cytometry plots gated on CD45.2+CD19+CD93 live donor-derived B cells recovered at day 8 from B6-CD45.1 mice or CD19+CD93 B cells from indicated Rag2–/– recipient groups. (C) Percentage of donor-derived marginal zone–like B cells at day 8 in each recipient group. Each data point represents an individual mouse. Data shown as mean ± SEM. (D) Histograms depicting cell surface expression of the indicated markers and eF450 dilution among donor-derived B cells from indicated B6-CD45.1 or Rag2–/– recipients. **P < 0.01 and ****P < 0.0001, by 1-way ANOVA.
Figure 8
Figure 8. Stroma-derived Dll1 Notch ligands drive B cell transdifferentiation and plasma cell differentiation in lymphopenic recipients.
B6 versus Rag2–/– versus Rag2–/– crossed to Ccl19-Cre Dll1fl/fl hosts were treated with isotype control or anti-Dll1 antibodies at days 0, 3, and 6 after transfer of purified B6-CD45.1 FoB cells. Flow cytometry and immunofluorescence imaging were performed on recipient splenocytes at day 8 after transfer. (A) Representative flow cytometry plots depicting live CD45.1+CD19+CD93 donor-derived mature B cells recovered at day 8 from B6 or indicated Rag2–/– recipients. (B) Percentage and (C) absolute numbers of CD45.1+ MZB cells at day 8 in each recipient group. (D) Histograms depicting cell surface expression of markers and CTV dilution on donor derived CD45.1+ B cells in B6 (black), Rag2–/– (red), or indicated Rag2–/– recipients. (E) Representative flow cytometry plots showing live donor-derived CD138+ plasma cells at day 8 in B6 or indicated Rag2–/– recipients. (F) Percentage and (G) absolute numbers of donor-derived plasma cells at day 8 in each recipient group. (H) Immunofluorescence microscopy of spleen sections of B6, Rag2–/–, and Rag2–/– Ccl19-Cre Dll1fl/fl recipients at day 8 after adoptive transfer, with labeled CD45.1+ cells (green), CTV (blue), CD169 (white), and laminin (red). Dotted regions are magnified in the second row of images. Scale bars: 50 μm. Data are from 2 independent experiments. (B, F, and G) *P < 0.05, **P < 0.01, and ****P < 0.0001, by 1-way ANOVA. Each data point represents an individual mouse.

References

    1. Cabatingan MS, et al. Naive B lymphocytes undergo homeostatic proliferation in response to B cell deficit. J Immunol. 2002;169(12):6795–6805. doi: 10.4049/jimmunol.169.12.6795. - DOI - PubMed
    1. Kumararatne DS, MacLennan IC. Cells of the marginal zone of the spleen are lymphocytes derived from recirculating precursors. Eur J Immunol. 1981;11(11):865–869. doi: 10.1002/eji.1830111104. - DOI - PubMed
    1. Surh CD, Sprent J. Regulation of mature T cell homeostasis. Semin Immunol. 2005;17(3):183–191. doi: 10.1016/j.smim.2005.02.007. - DOI - PubMed
    1. Min B. Spontaneous T cell proliferation: a physiologic process to create and maintain homeostatic balance and diversity of the immune system. Front Immunol. 2018;9:547. doi: 10.3389/fimmu.2018.00547. - DOI - PMC - PubMed
    1. Takada K, Jameson SC. Naive T cell homeostasis: from awareness of space to a sense of place. Nat Rev Immunol. 2009;9(12):823–832. doi: 10.1038/nri2657. - DOI - PubMed

Publication types