. 2022 Jun 14;18(6):3948-3960.
doi: 10.1021/acs.jctc.2c00083. Epub 2022 May 17.

A Bottom-Up Coarse-Grained Model for Nucleosome-Nucleosome Interactions with Explicit Ions

Affiliations

A Bottom-Up Coarse-Grained Model for Nucleosome-Nucleosome Interactions with Explicit Ions

Tiedong Sun et al. J Chem Theory Comput. .

Abstract

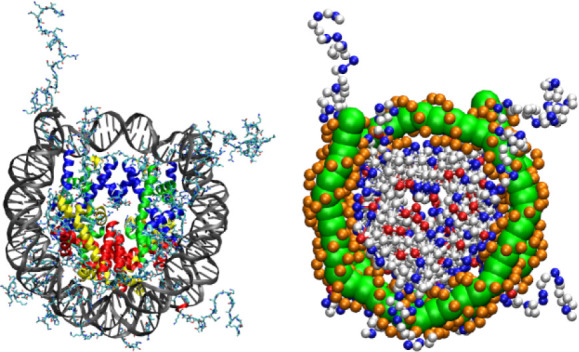
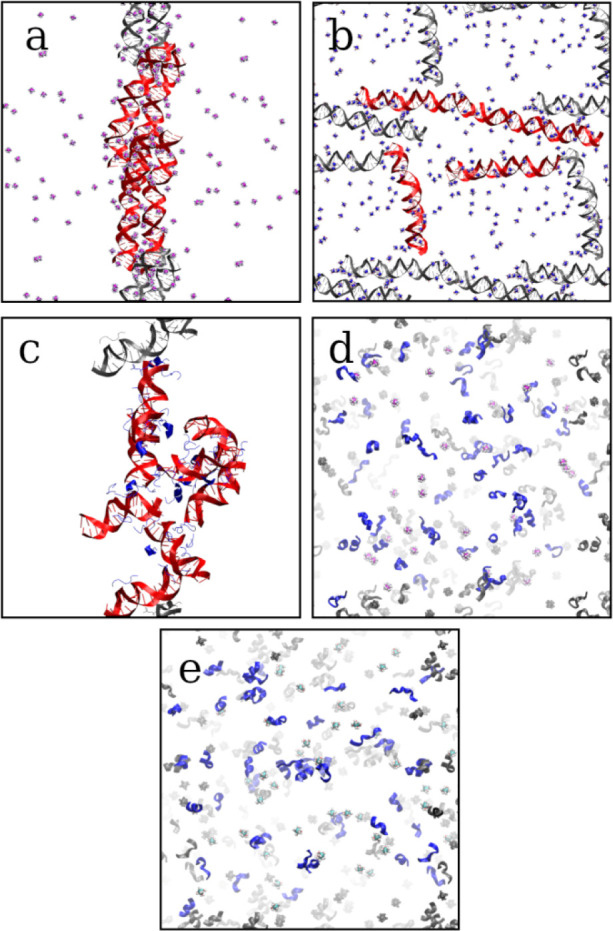
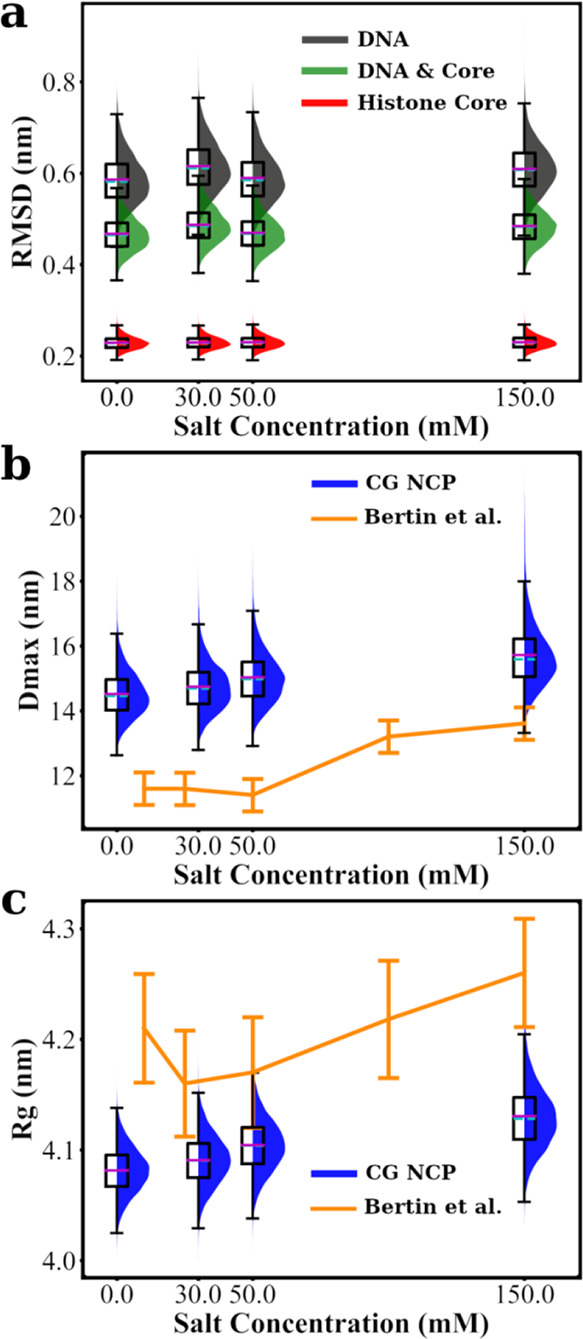
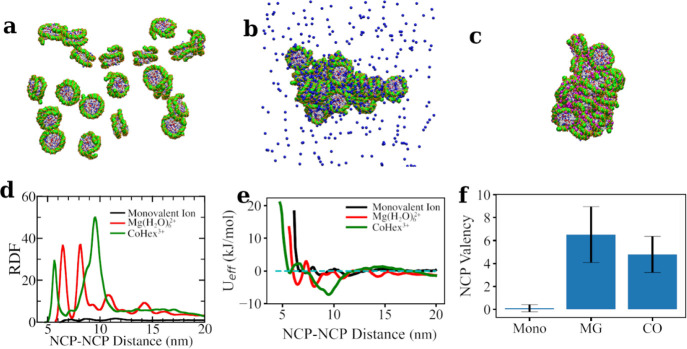
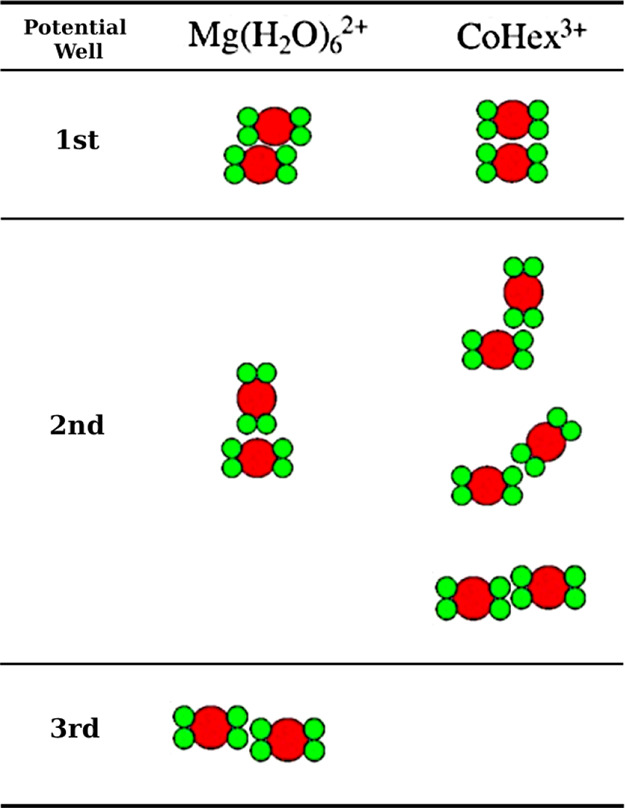
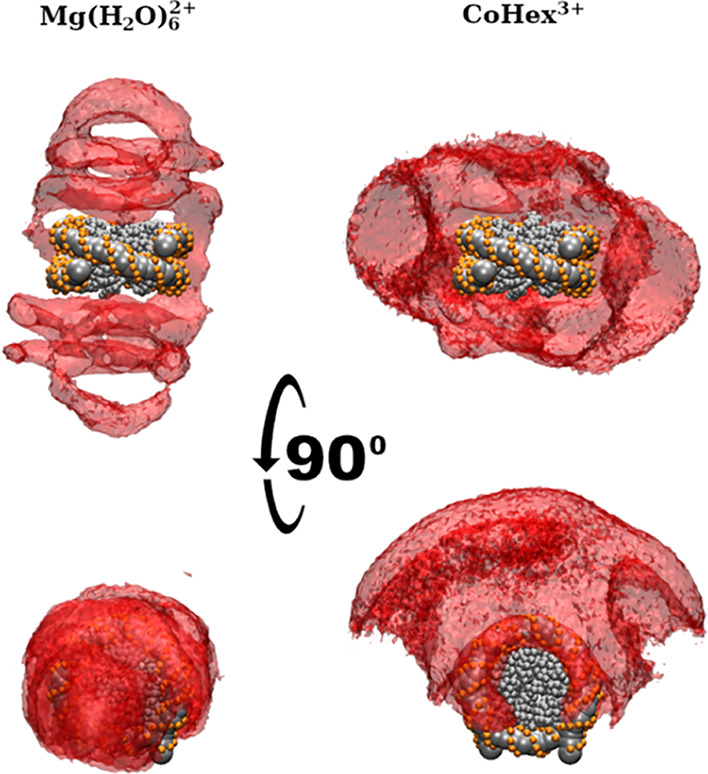
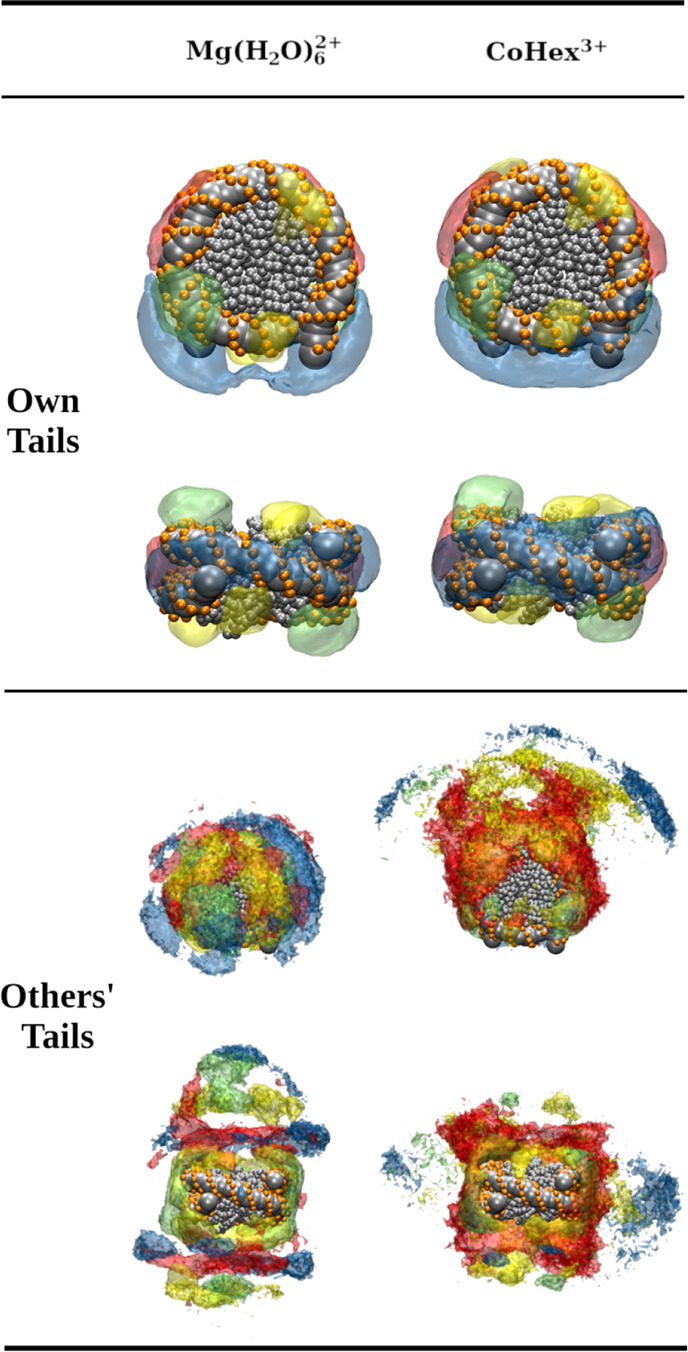
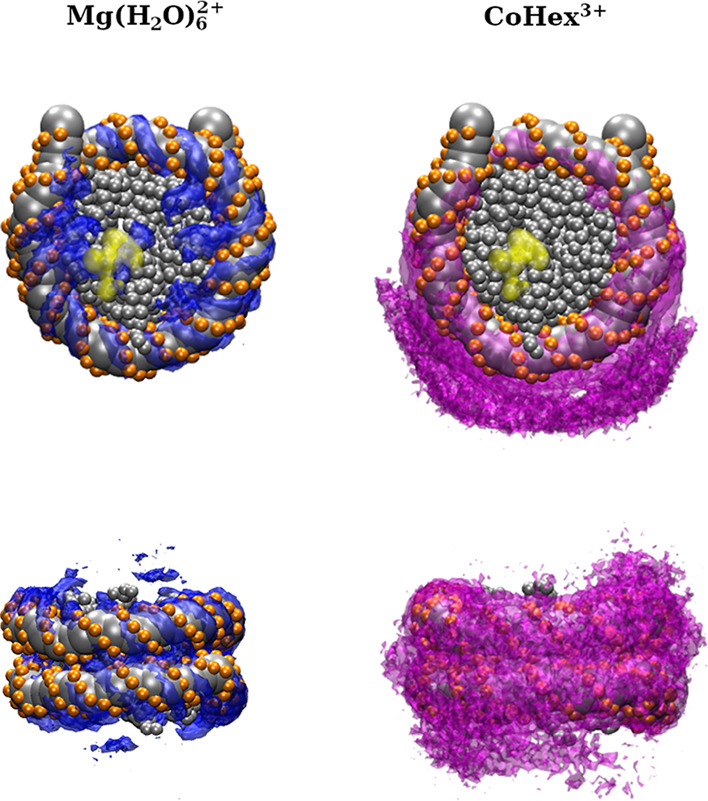
The nucleosome core particle (NCP) is a large complex of 145-147 base pairs of DNA and eight histone proteins and is the basic building block of chromatin that forms the chromosomes. Here, we develop a coarse-grained (CG) model of the NCP derived through a systematic bottom-up approach based on underlying all-atom MD simulations to compute the necessary CG interactions. The model produces excellent agreement with known structural features of the NCP and gives a realistic description of the nucleosome-nucleosome attraction in the presence of multivalent cations (Mg(H2O)62+ or Co(NH3)63+) for systems comprising 20 NCPs. The results of the simulations reveal structural details of the NCP-NCP interactions unavailable from experimental approaches, and this model opens the prospect for the rigorous modeling of chromatin fibers.


Conflict of interest statement

The authors declare no competing financial interest.

Figures

Figure 1
Figure 1
All-atom representation (left) and CG representation (right) of the NCP. The all-atom representation is built using the NCP crystal structure (PDB: 1KX5), where the globular domains of histone proteins are in colors; DNA is colored gray. The CG NCP structure is shown with positively and negatively charged amino acids colored in blue and red, respectively. Uncharged amino acid beads are displayed as white spheres. The beads representing the phosphate groups in DNA are in orange, while the central DNA beads are shown as green balls.
Figure 2
Figure 2
Representative snapshots of (a) DNA-Co, (b) DNA-Mg, (c) DNA-Peptide, (d) Peptide-Co, and (e) Peptide-Mg subsystems showing configurations at the end of simulations. DNA is colored red, while peptide chains are colored blue. Periodic images are colored gray.
Figure 3
Figure 3
Root mean square fluctuation of block-averaged RDF relative to the final RDF for DNA-Co (top) and DNA-Peptide (bottom) subsystems. Final RDF is calculated with the last 500 ns of each trajectory.
Figure 4
Figure 4
Selected short-range potential functions obtained by the IMC method from different subsystems. See Figure S3 in the Supporting Information for a complete set of such potential terms.
Figure 5
Figure 5
Structural features of CG NCP. Structural properties obtained in equilibrium simulation of a single NCP are presented with box plots, including the RMSD relative to the crystal structure (a), maximal dimension (Dmax in b), and radius of gyration (Rg in c). The edges on each box plot represent the 25th and 75th percentile. Mean values and medians are shown as magenta and cyan lines in the boxes, respectively. Whiskers are extended for 1.5 times the interquartile range in each direction. A shaded distribution curve is plotted alongside each box to illustrate the shape of the distribution for each dataset. RMSD values are calculated and combined for DNA and histone core (as defined in Table S2). Dmax and Rg are plotted together with experimental data from ref (61). All properties are shown as functions of salt concentration.
Figure 6
Figure 6
CG MD simulations of the systems with 20 NCPs and K+, Mg(H2O)62+ (7.1 mM), and CoHex3+ (4.7 mM) cations. Snapshots of typical equilibrium states in K-20NCP (a), Mg-20NCP (b), and Co-20NCP (c) simulations are shown. Histone tails and monovalent ions are omitted in the snapshots for clarity. Mg(H2O)62+ ions are shown as blue balls, whereas CoHex3+ ions are in magenta. (d) The histone core–histone core RDF. NCP–NCP interaction shows different modes as indicated by the RDF. (e) The NCP–NCP effective potentials derived from the RDFs are displayed in panel (d). (f) NCP valency is calculated according to eq 6. Error bars are standard deviations.
Figure 7
Figure 7
Summary of NCP–NCP binding modes in the multivalent ion-induced NCP aggregates. The most populated NCP–NCP contacts correspond to the minima in the core–core effective potential function (Figure 6e). The NCP is shown as simplified shapes representing its cross section with green circles for the DNA wrapped around the histone core (red circle).
Figure 8
Figure 8
SDFs of DNA in multivalent ion-induced NCP aggregates. In the Mg-20NCP (left) and Co-20NCP (right) systems, NCP–NCP stacking is revealed by the densities above and below the central NCP. In the Mg-20NCP system, the “arcs” above and beneath the central NCP indicate a population of perpendicular NCP–NCP orientations. In the Co-20NCP system, the densities of the NCP lateral side opposite reflect contacts between DNA on the lateral surface of the wedge-shaped NCP cylinder. The absence of the SDF density at the DNA entry–exit location of the NCP indicates that most particles orient this part toward the condensate surface. See the Supporting Information for 3D animations.
Figure 9
Figure 9
SDFs of the histone tails around the NCP calculated from the equilibrated parts of the CG MD trajectories in the Mg-20NCP and Co-20NCP systems. Threshold values used to draw the transparent isosurfaces are the same for both systems. The SDFs of the H3 tails are colored blue, the H4 tails are green, the H2A tails are yellow, and the H2B tails are red; the DNA and core histone beads of the central NCP are shown as gray spheres. The top and side views of the central NCP are shown. See the Supporting Information for the 3D animation of these distributions.
Figure 10
Figure 10
Top view (top row) and side view (bottom row) of the distribution of multivalent ions surrounding the NCP. Yellow regions in the top view panels indicate the approximate positions of the acidic patch.

Similar articles

Cited by

References

    1. Zhou K.; Gaullier G.; Luger K. Nucleosome structure and dynamics are coming of age. Nat. Struct. Mol. Biol. 2019, 26, 3–13. 10.1038/s41594-018-0166-x. - DOI - PMC - PubMed
    1. Luger K.; Richmond T. J. The histone tails of the nucleosome. Curr. Opin. Genet. Dev. 1998, 8, 140–146. 10.1016/s0959-437x(98)80134-2. - DOI - PubMed
    1. Chen P.; Li W.; Li G. Structures and functions of chromatin fibers. Annu. Rev. Biophys. 2021, 50, 95–116. 10.1146/annurev-biophys-062920-063639. - DOI - PubMed
    1. Maeshima K.; Tamura S.; Hansen J. C.; Itoh Y. Fluid-like chromatin: Toward understanding the real chromatin organization present in the cell. Curr. Opin. Cell Biol. 2020, 64, 77–89. 10.1016/j.ceb.2020.02.016. - DOI - PubMed
    1. Krietenstein N.; Rando O. J. Mesoscale organization of the chromatin fiber. Curr. Opin. Genet. Dev. 2020, 61, 32–36. 10.1016/j.gde.2020.02.022. - DOI - PubMed