. 2022 Jun 10;50(10):5834-5849.
doi: 10.1093/nar/gkac359.

Lineage-specific insertions in T-box riboswitches modulate antibiotic binding and action

Affiliations

Lineage-specific insertions in T-box riboswitches modulate antibiotic binding and action

Nikoleta Giarimoglou et al. Nucleic Acids Res. .

Abstract

T-box riboswitches (T-boxes) are essential RNA regulatory elements with a remarkable structural diversity, especially among bacterial pathogens. In staphylococci, all glyS T-boxes synchronize glycine supply during synthesis of nascent polypeptides and cell wall formation and are characterized by a conserved and unique insertion in their antiterminator/terminator domain, termed stem Sa. Interestingly, in Staphylococcus aureus the stem Sa can accommodate binding of specific antibiotics, which in turn induce robust and diverse effects on T-box-mediated transcription. In the present study, domain swap mutagenesis and probing analysis were performed to decipher the role of stem Sa. Deletion of stem Sa significantly reduces both the S. aureus glyS T-box-mediated transcription readthrough levels and the ability to discriminate among tRNAGly isoacceptors, both in vitro and in vivo. Moreover, the deletion inverted the previously reported stimulatory effects of specific antibiotics. Interestingly, stem Sa insertion in the terminator/antiterminator domain of Geobacillus kaustophilus glyS T-box, which lacks this domain, resulted in elevated transcription in the presence of tigecycline and facilitated discrimination among proteinogenic and nonproteinogenic tRNAGly isoacceptors. Overall, stem Sa represents a lineage-specific structural feature required for efficient staphylococcal glyS T-box-mediated transcription and it could serve as a species-selective druggable target through its ability to modulate antibiotic binding.


Figures

Figure 1.
Figure 1.
In silico analysis by sequence alignment of the antiterminator domain of representative staphylococcal species. For the alignment, the highly conserved nucleotides (80–100%) are indicated by dark blue color, the moderately conserved nucleotides (50–80%) are indicated with blue color, while the less conserved nucleotides (≤50%) are indicated with light blue color. The previously described antibiotic binding sites are indicated with orange arrows, the proteinogenic P1 tRNAGlyGCC tRNA protection sites are indicated with green arrows and the nonproteinogenic NP2 tRNAGlyUCC tRNA protection sites are indicated with blue arrows.
Figure 2.
Figure 2.
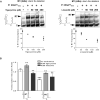
In vitro transcription antitermination assays of the wt and mutant T-boxes. Transcription elongation time plot of the wt S. aureus glyS T-box (A) and M1 (B) and wt2 and M2 (C) T-boxes in the absence or presence of S. aureus P1 tRNAGlyGCC. T and RT correspond to transcription termination and transcription readthrough, respectively. The secondary structure of each riboswitch tested is indicated on the top of readthrough assays; % readthrough transcription (represented by bars as well) is indicated in the bottom of the gels.
Figure 3.
Figure 3.
In vitro transcription antitermination assays of M1 T-box mutant in the presence of proteinogenic and nonproteinogenic tRNAGly. (A) In vitro tRNA-directed antitermination (readthrough) assay. Transcription elongation time plot of the M1 mutant T-box using two S. aureus tRNAGly isoacceptors either proteinogenic or nonproteinogenic (P1 tRNAGlyGCC, NP1 tRNAGlyUCC). The values for the graph were extracted after analysis of representative autoradiograms (insets) as described in the ‘Materials and Methods’ section. Error bars represent ±SD from corresponding experiments. T and RT in black correspond to transcription termination and transcription readthrough, respectively. Reaction time is 20 min. The secondary structure of M1 T-box is indicated on the left of the readthrough assay. (B) Schematic representation of in vivo glyS T-box-mediated transcription antitermination assay of the glyS T-box-dependent dTomato expression in E. coli. (C) Relative dTomato fluorescence of wt and mutant T-boxes under glycine starvation conditions, normalized to wt T-box-containing strain grown in minimal media supplemented with glycine in the presence of P1 tRNAGlyGCC or NP1 tRNAGlyUCC (data not shown). The secondary structure of each riboswitch tested is indicated at the bottom of the graph. The values and error bars represent mean and SD; n = 3 biologically independent samples. Significance stars represent ns: P > 0.05, *: P ≤ 0.05, **: P ≤ 0.01, ***: P ≤ 0.001 and ****: P ≤ 0.0001.
Figure 4.
Figure 4.
(A) Dose–response graphs showing the effect of increasing concentration of tigecycline and linezolid on the M1 T-box readthrough reaction, in vitro, in the presence of P1 tRNAGlyGCC. The values for the curves were extracted after analysis of representative autoradiograms, as described in the ‘Materials and Methods’ section. All reactions were performed twice in duplicates and error bars represent ±SD from the corresponding experiments. T and RT correspond to transcription termination and transcription readthrough, respectively. The secondary structure of the M1 T-box is indicated at the left of readthrough. Reaction time is 20 min. (B) Relative dTomato fluorescence of wt and T-box mutants under glycine starvation conditions, normalized to the wt T-box-containing strain grown in minimal media and supplemented with glycine (data not shown). Relative dTomato fluorescence of wt and T-box mutants was measured both in the presence and in the absence of IC50 concentrations of linezolid and tigecycline. The secondary structure of each riboswitch tested is indicated at the bottom of the graph. The values and error bars represent mean and SD; n = 3 biologically independent samples. Significance stars represent ns: P > 0.05, *: P ≤ 0.05, **: P ≤ 0.01, ***: P ≤ 0.001 and ****: P ≤ 0.0001.
Figure 5.
Figure 5.
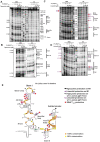
Chemical probing analysis of M1 T-box stem I in complex with the P1 tRNAGlyGCC, tigecycline and linezolid. Chemical probing of M1 mutant (20 pmol) in the presence or the absence of P1 tRNAGlyGCC (+ and 2+ refer to 100 and 200 pmol, respectively) and/or increasing concentrations of (A, B) tigecycline and (C, D) linezolid. Black arrows indicate tigecycline-induced protection sites and magenta arrows indicate linezolid-induced protection sites on M1. Red stars indicate P1 tRNAGlyGCC induced protection sites on M1. (E) Illustration of M1 secondary structure. The protection sites of P1 tRNAGlyGCC, tigecycline and linezolid on M1 are shown with red stars, black arrows and magenta arrows, respectively, while the protection sites induced by tigecycline and linezolid on the wt S. aureus glyS T-box are indicated with open black outlined arrows and open magenta outlined arrows, respectively. TbGl1 primer (green arrow) was used for stem I primer extension analysis, while TbGl6 (red arrow) primer was used for terminator/antiterminator stem primer extension analysis. The 100% conserved nucleotides are labeled in orange, while the 66% conserved nucleotides are labeled in yellow.
Figure 6.
Figure 6.
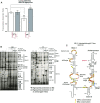
(A) Relative dTomato fluorescence of wt G. kaustophilus glyQ T-box and mutant M2 under glycine starvation conditions, normalized to the wt T-box-containing strain grown in minimal media and supplemented with glycine (data not shown). Relative dTomato fluorescence of wt and M2 was measured both in the presence and in the absence of IC50 concentrations of tigecycline. The secondary structure of each riboswitch tested is indicated at the bottom of the graph. The values and error bars represent mean and SD; n = 3 biologically independent samples. Significance stars represent ns: P > 0.05, *: P ≤ 0.05, **: P ≤ 0.01, ***: P ≤ 0.001 and ****: P ≤ 0.0001 (B) Chemical probing analysis of M2 T-box stem I in complex with the P1 tRNAGlyGCC and tigecycline. Chemical probing of M2 mutant (20 pmol) in the presence or the absence of P1 tRNAGlyGCC (+ and 2+ refer to 100 and 200 pmol, respectively) and/or increasing concentrations of tigecycline. Black arrows indicate tigecycline binding sites on M2. (C) Illustration of M2 secondary structure. The protection sites induced by tigecycline on M2 are shown with black arrows, while the protection sites induced by tigecycline on the wt S. aureus glyS T-box are shown with open black outlined arrows. Gkau_PE_234–251 primer (blue arrow) was used for terminator/antiterminator stem primer extension analysis. The 100% conserved nucleotides are labeled in orange, while the 66% conserved nucleotides are labeled in yellow.
Figure 7.
Figure 7.
Front (upper left), back (upper right) and top (below) views of a 3D computational model of the full-length B. subtilis glyQS T-box riboswitch in complex with tRNAGly (PDB: 6POM) with the proposed induced protections by tigecycline (orange), linezolid (magenta) and both (red) found in M1.

Similar articles

Cited by

References

    1. Grundy F.J., Henkin T.M.. tRNA as a positive regulator of transcription antitermination in B. subtilis. Cell. 1993; 74:475–482. - PubMed
    1. Henkin T.M. The T box riboswitch: a novel regulatory RNA that utilizes tRNA as its ligand. Biochim. Biophys. Acta: Gene Regul. Mech. 2014; 1839:959–963. - PMC - PubMed
    1. Gutierrez-Preciado A., Henkin T.M., Grundy F.J., Yanofsky C., Merino E.. Biochemical features and functional implications of the RNA-based T-box regulatory mechanism. Microbiol. Mol. Biol. Rev. 2009; 73:36–61. - PMC - PubMed
    1. Henkin T.M. Riboswitch RNAs: using RNA to sense cellular metabolism. Genes Dev. 2008; 22:3383–3390. - PMC - PubMed
    1. Zhang J., Ferré-D’Amaré A.R.. Structure and mechanism of the T-box riboswitches. Wiley Interdiscip. Rev. RNA. 2015; 6:419–433. - PMC - PubMed

Publication types