

Automatic contouring QA method using a deep learning-based autocontouring system
- PMID: 35580067
- PMCID: PMC9359039
- DOI: 10.1002/acm2.13647
Automatic contouring QA method using a deep learning-based autocontouring system
Abstract
Purpose: To determine the most accurate similarity metric when using an independent system to verify automatically generated contours.
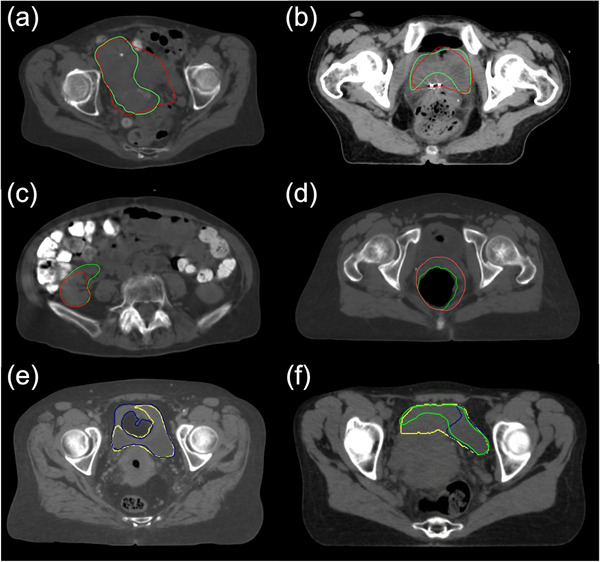
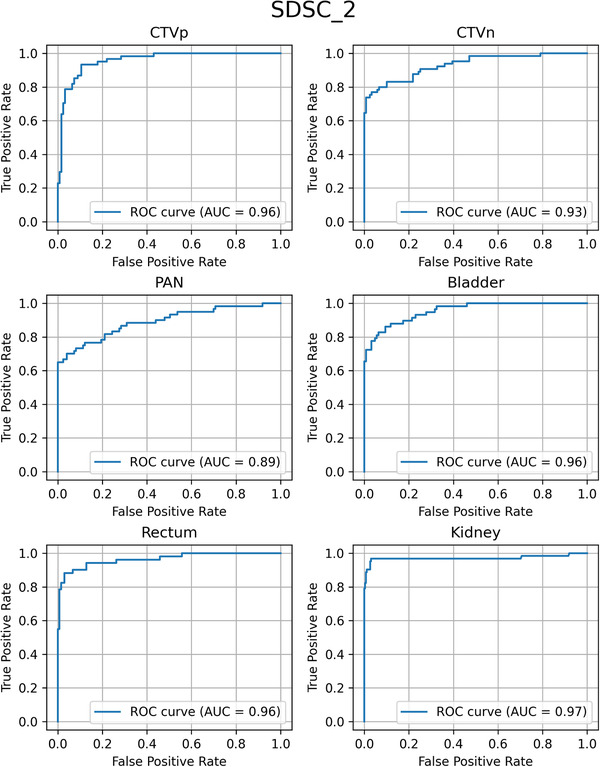
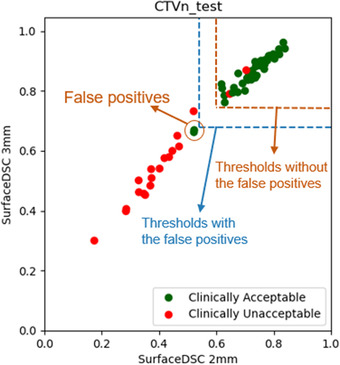
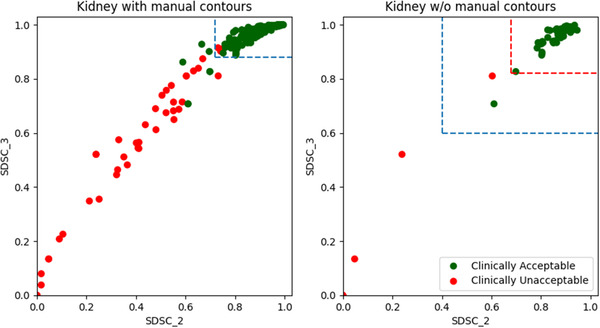
Methods: A reference autocontouring system (primary system to create clinical contours) and a verification autocontouring system (secondary system to test the primary contours) were used to generate a pair of 6 female pelvic structures (UteroCervix [uterus + cervix], CTVn [nodal clinical target volume (CTV)], PAN [para-aortic lymph nodes], bladder, rectum, and kidneys) on 49 CT scans from our institution and 38 from other institutions. Additionally, clinically acceptable and unacceptable contours were manually generated using the 49 internal CT scans. Eleven similarity metrics (volumetric Dice similarity coefficient (DSC), Hausdorff distance, 95% Hausdorff distance, mean surface distance, and surface DSC with tolerances from 1 to 10 mm) were calculated between the reference and the verification autocontours, and between the manually generated and the verification autocontours. A support vector machine (SVM) was used to determine the threshold that separates clinically acceptable and unacceptable contours for each structure. The 11 metrics were investigated individually and in certain combinations. Linear, radial basis function, sigmoid, and polynomial kernels were tested using the combinations of metrics as inputs for the SVM.
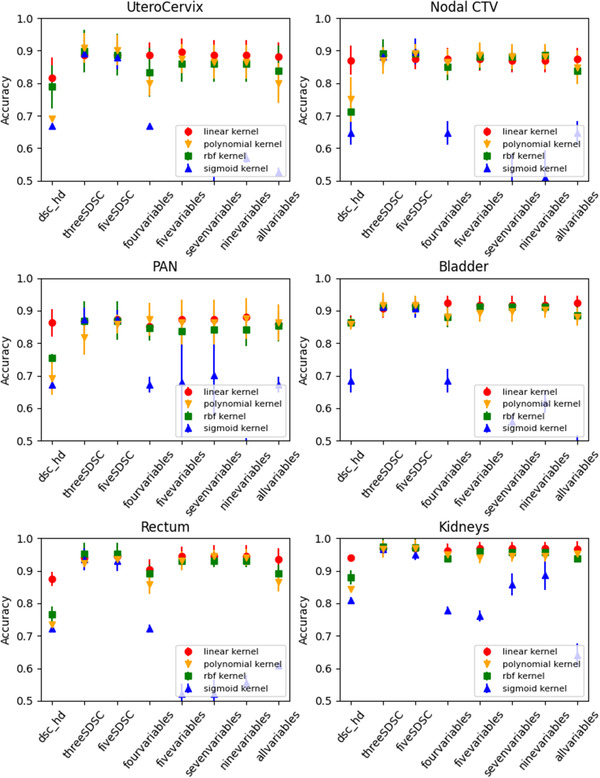
Results: The highest contouring error detection accuracies were 0.91 for the UteroCervix, 0.90 for the CTVn, 0.89 for the PAN, 0.92 for the bladder, 0.95 for the rectum, and 0.97 for the kidneys and were achieved using surface DSCs with a thickness of 1, 2, or 3 mm. The linear kernel was the most accurate and consistent when a combination of metrics was used as an input for the SVM. However, the best model accuracy from the combinations of metrics was not better than the best model accuracy from a surface DSC as an input.
Conclusions: We distinguished clinically acceptable contours from clinically unacceptable contours with an accuracy higher than 0.9 for the targets and critical structures in patients with cervical cancer; the most accurate similarity metric was surface DSC with a thickness of 1, 2, or 3 mm.
Keywords: auto-contour; deep learning; similarity metrics.
© 2022 The Authors. Journal of Applied Clinical Medical Physics published by Wiley Periodicals, LLC on behalf of The American Association of Physicists in Medicine.
Conflict of interest statement
This work was partially funded by the National Cancer Institute and Varian Medical Systems.
Figures


References
-
- Hui CB, Nourzadeh H, Watkins WT, et al. Automated OAR anomaly and error detection tool in radiation therapy. Int J Radiat Oncol Biol Phys. 2017;99(2):E554‐E555. 10.1016/j.ijrobp.2017.06.1932 - DOI
MeSH terms
LinkOut - more resources
Full Text Sources
