Clinical Trial
. 2022 Jul 1;10(7):856-870.
doi: 10.1158/2326-6066.CIR-21-0501.

Modified Manufacturing Process Modulates CD19CAR T-cell Engraftment Fitness and Leukemia-Free Survival in Pediatric and Young Adult Subjects

Affiliations
Clinical Trial

Modified Manufacturing Process Modulates CD19CAR T-cell Engraftment Fitness and Leukemia-Free Survival in Pediatric and Young Adult Subjects

Francesco Ceppi et al. Cancer Immunol Res. .

Abstract

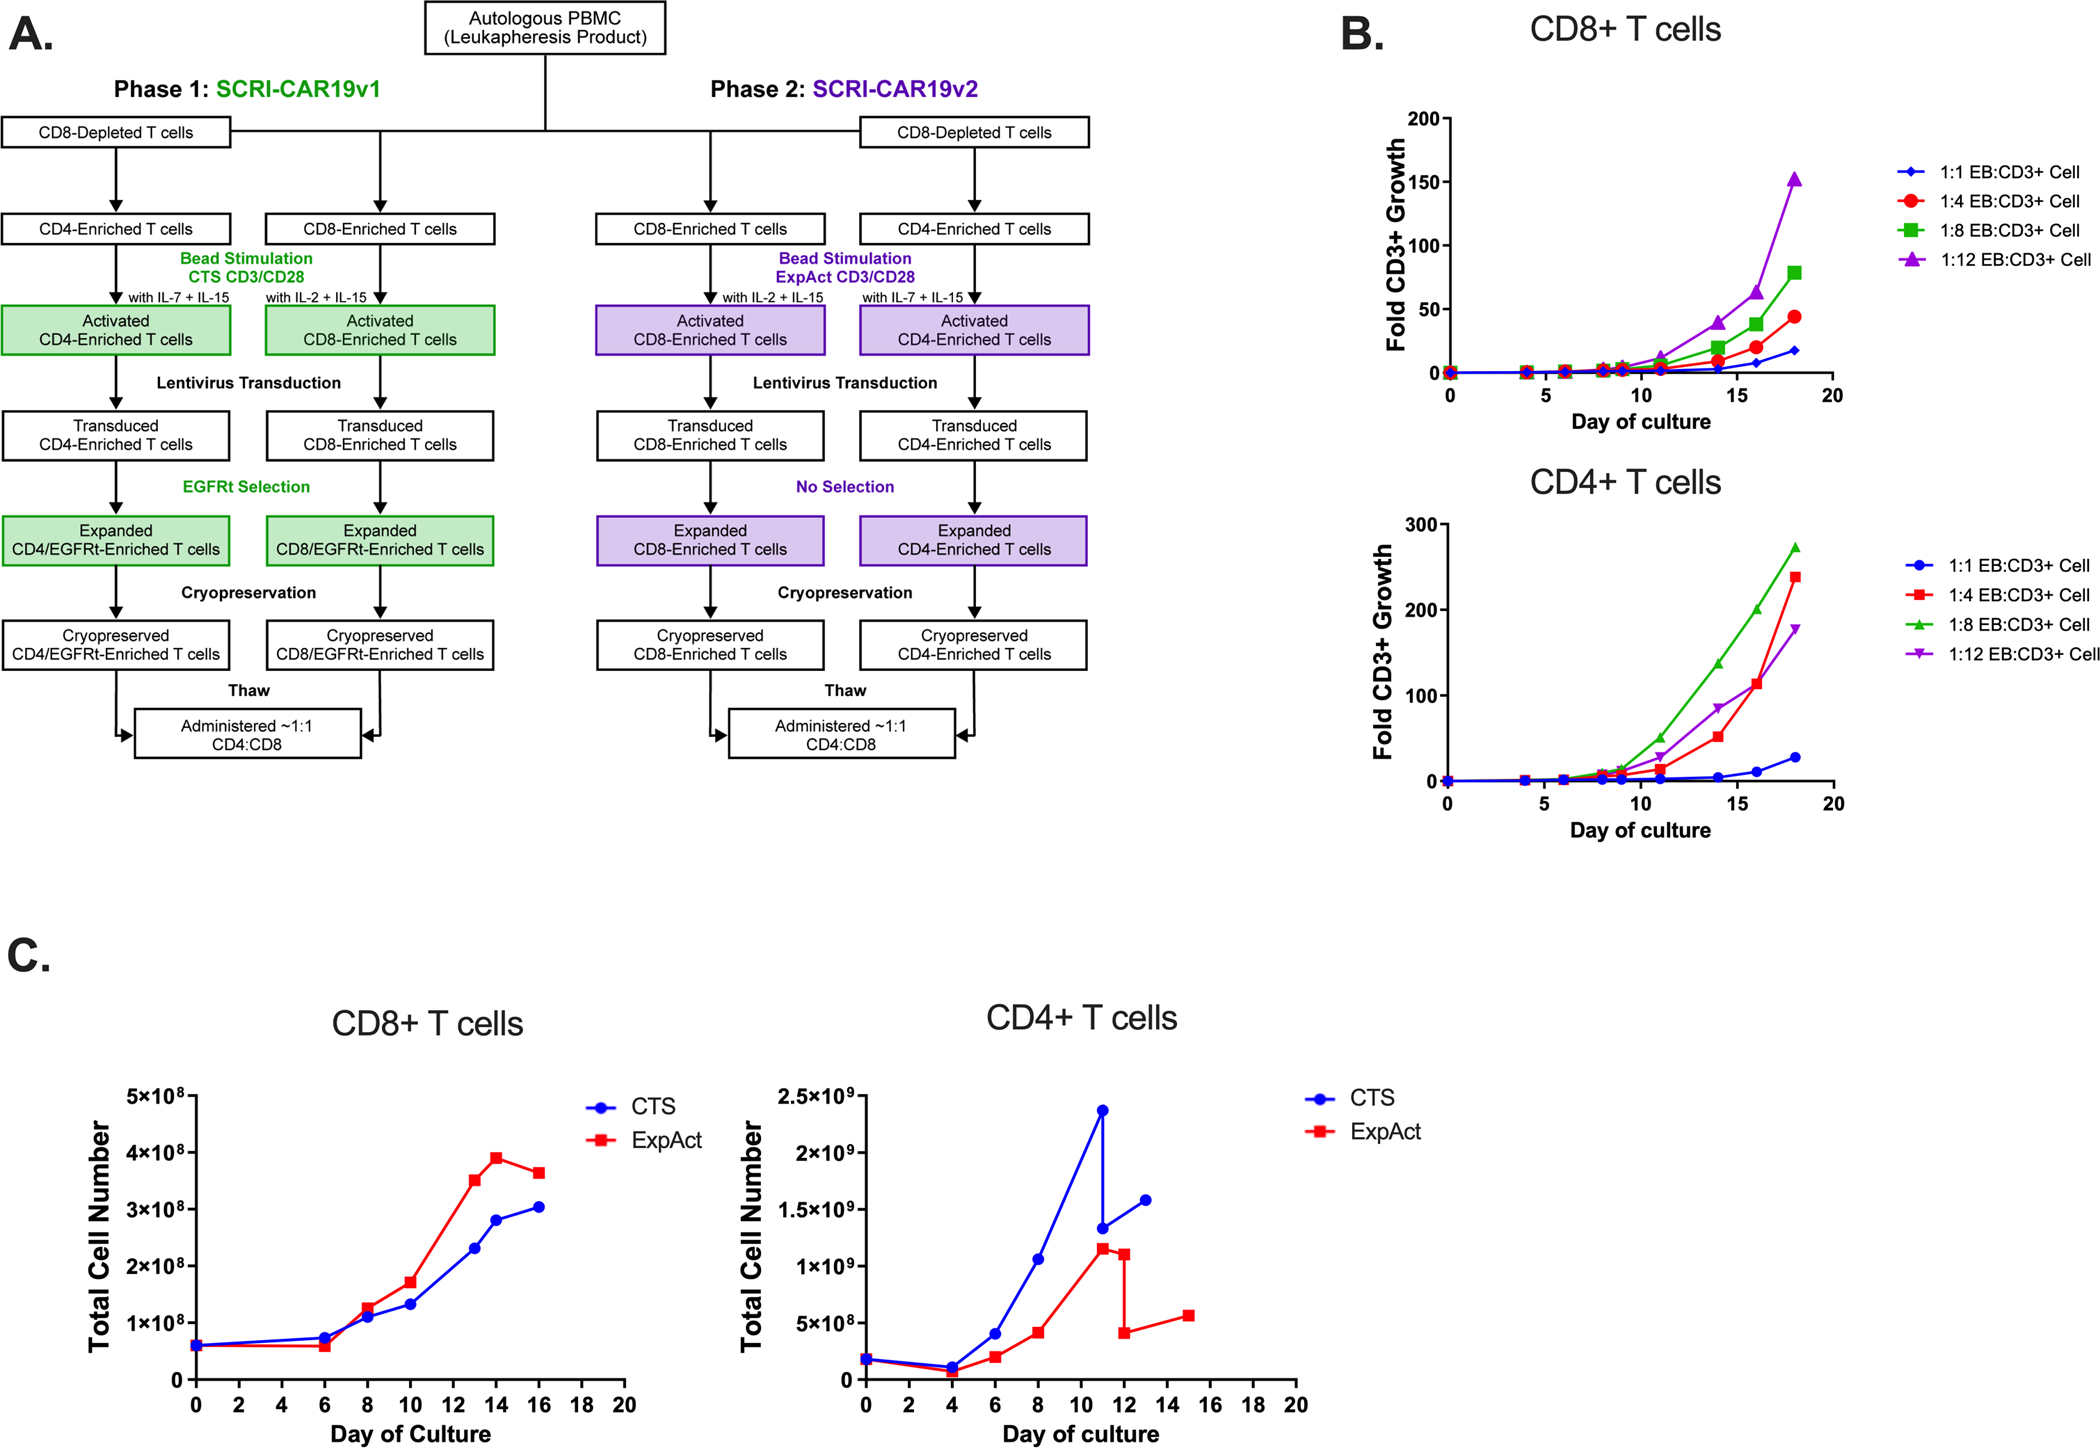
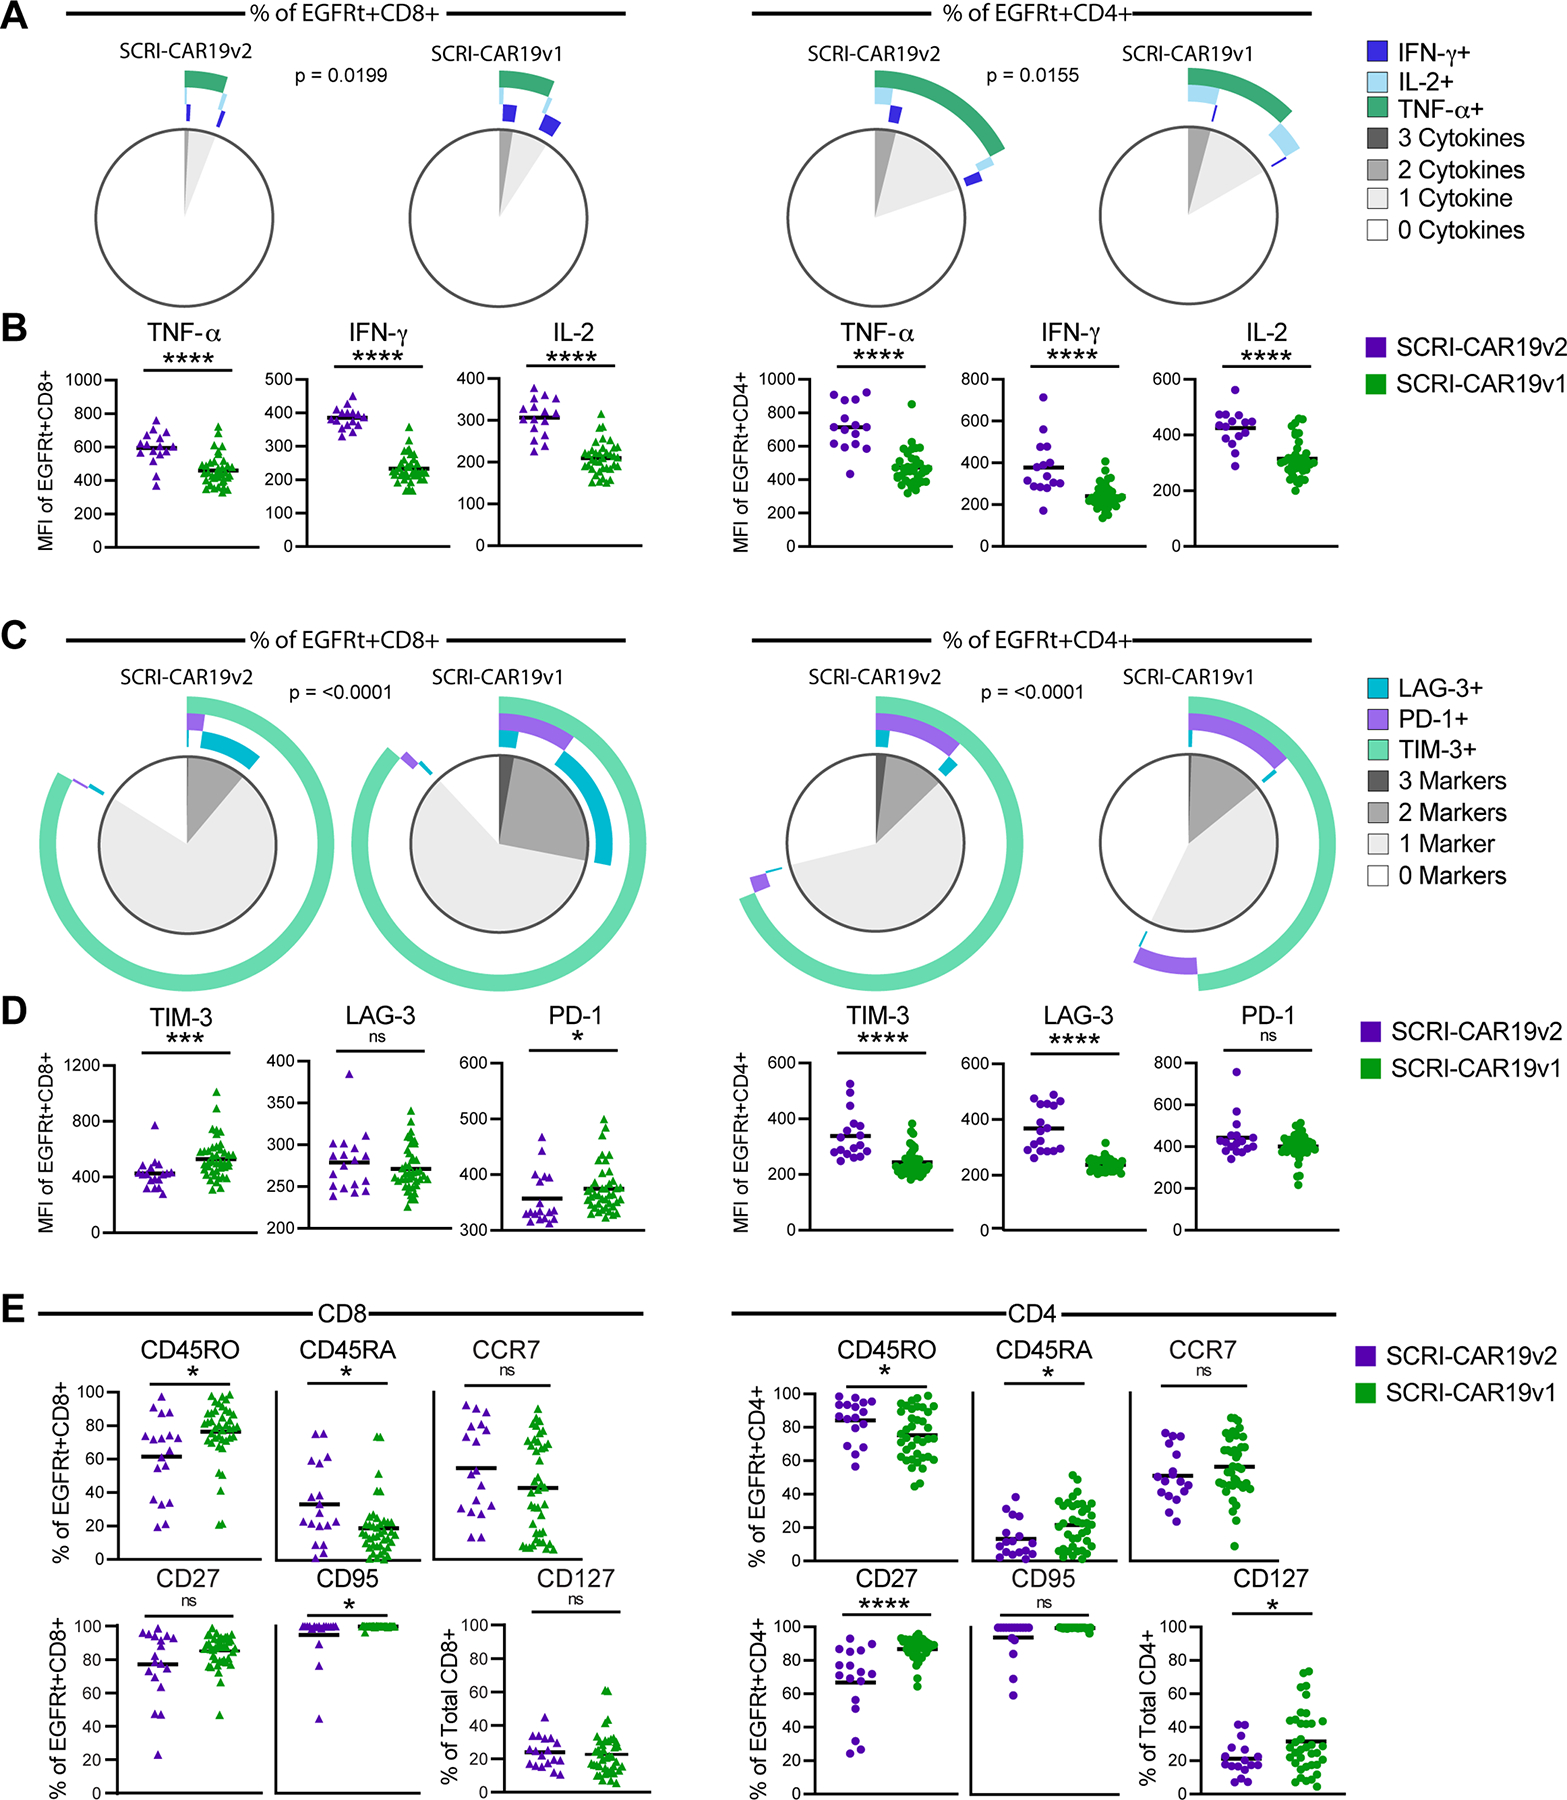
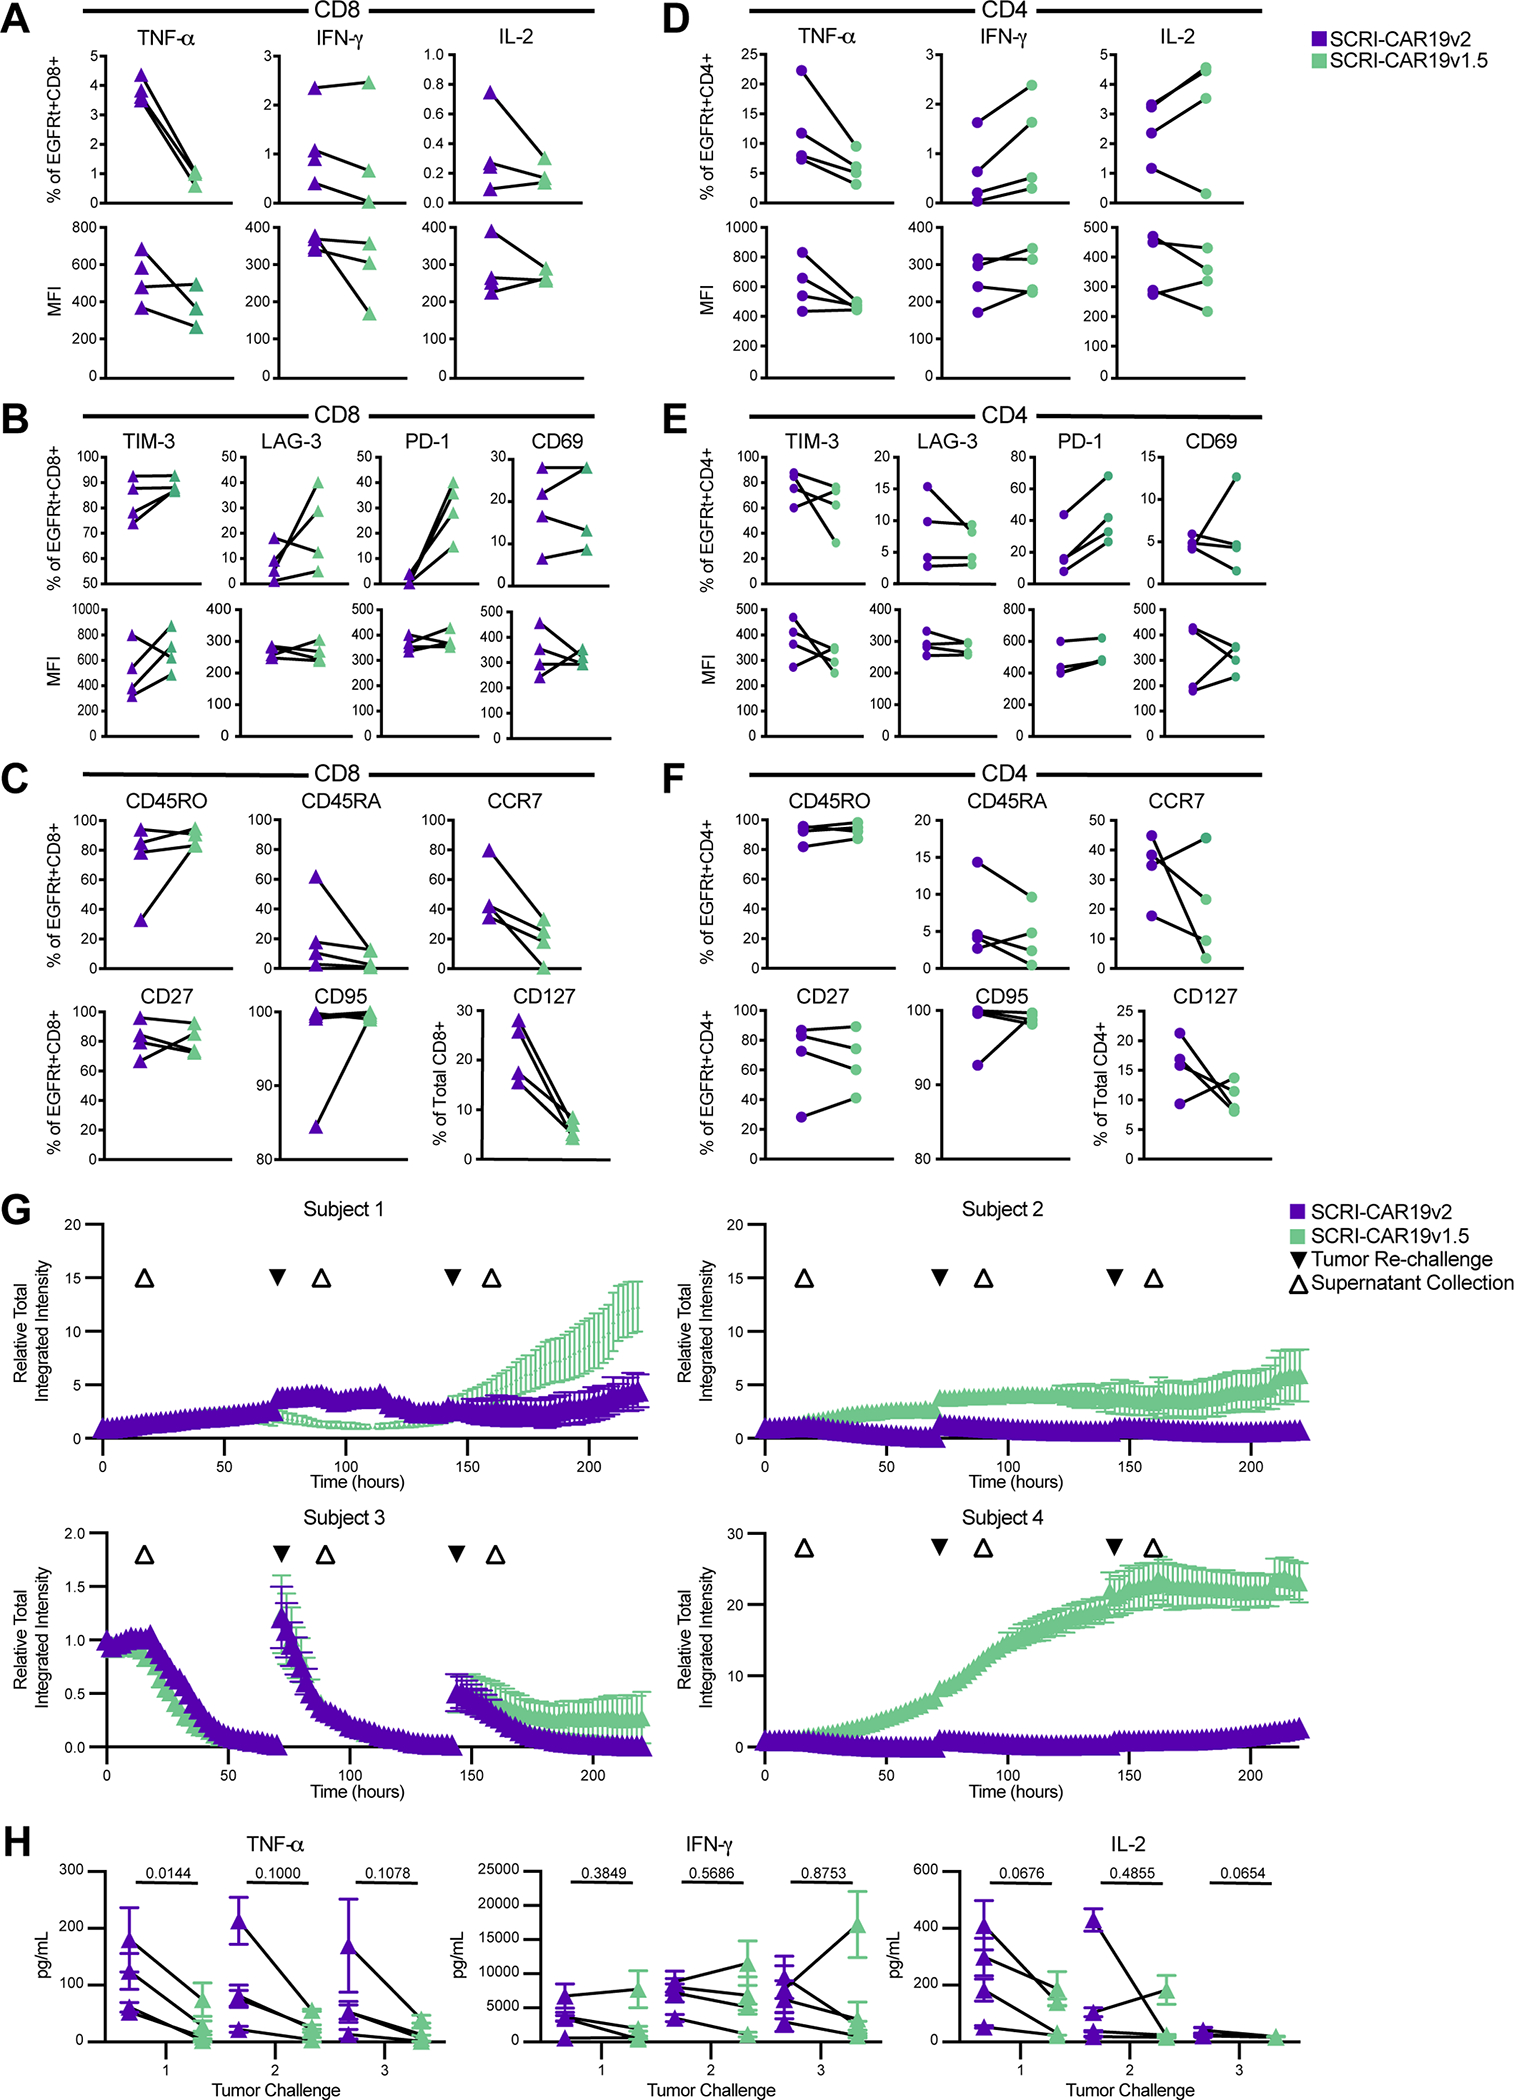
T cells modified to express a chimeric antigen receptor (CAR) targeting CD19 can induce potent and sustained responses in children with relapsed/refractory acute lymphoblastic leukemia (ALL). The durability of remission is related to the length of time the CAR T cells persist. Efforts to understand differences in persistence have focused on the CAR construct, in particular the costimulatory signaling module of the chimeric receptor. We previously reported a robust intent-to-treat product manufacturing success rate and remission induction rate in children and young adults with recurrent/refractory B-ALL using the SCRI-CAR19v1 product, a second-generation CD19-specific CAR with 4-1BB costimulation coexpressed with the EGFRt cell-surface tag (NCT02028455). Following completion of the phase I study, two changes to CAR T-cell manufacturing were introduced: switching the T-cell activation reagent and omitting midculture EGFRt immunomagnetic selection. We tested the modified manufacturing process and resulting product, designated SCRI-CAR19v2, in a cohort of 21 subjects on the phase II arm of the trial. Here, we describe the unanticipated enhancement in product performance resulting in prolonged persistence and B-cell aplasia and improved leukemia-free survival with SCRI-CAR19v2 as compared with SCRI-CAR19v1.


Figures

Figure 1.
Figure 1.. Process Development of SCRI-CAR19v2.
(A) Manufacturing schemas of SCRI-CAR19v1 and SCRI-CAR19v2. (B) Comparison of normal donor–derived cell product growth rates at small scale with varying ExpAct (EB) to CD3+ T-cell ratios for both CD8+ (top graph) and CD4+ T-cell (bottom graph) cultures (n=1). (C) Large scale experiments using a single normal donor comparing growth of CD4+ and CD8+ T cells manufactured with CTS beads versus ExpAct using the SCRI-CAR19v1 platform. Cell counts analyzed periodically throughout cell culture on indicated days post initiation. The blue line indicates use of CTS beads to CD8+ T cells at 3:1 ratio and the red line indicates ExpAct to CD8+ T cells at a 1:8 ratio. For CD4+ T-cell cultures, the blue line indicates CTS beads to T cells at a 3:1 ratio and the red line indicates ExpAct to T cells at a 1:4 ratio.
Figure 2.
Figure 2.. Durability of anti-leukemic response and CAR T–cell engraftment for subjects treated with SCRI-CAR19v2 versus SCRI-CAR19v1.
Kaplan-Meier curves of (A) Leukemia-Free Survival (LFS) (B) Event-Free Survival (EFS) (C) Overall Survival (OS), and (D) time to loss of B-cell aplasia (BCA), comparing subjects treated with SCRI-CAR19v2 (purple) versus SCRI-CAR19v1 (green). Subjects treated with SCRI-CAR19v2 had significantly better LFS (P=0.0091), EFS (P=0.043), and time to loss of BCA (P=0.019). No significant difference was observed in OS (P=0.26) between groups. P values were calculated via log-rank test with weights=1. (E) Mean absolute CAR T–cell engraftment (cells/μL) values at infusion and 10, 14, 21, and 63 days after T-cell infusion are plotted on the primary y-axis along with standard error of the mean. Mean CAR T–cell composition breakdown, namely %CD4+ and %CD8+ of total EGFRt+ cells, at 10, 14, 21, and 63 days after T-cell infusion are scaled to 100% and plotted on the secondary y-axis. (F) CAR T–cell composition breakdown at long term follow up (LTFU) visits ranging from 3 months (3M) to 54 months (54M) after T-cell infusion are plotted in scattered dots. The colors of the dots denote the corresponding LTFU visit timepoint and the sizes of the dots represent the total CAR T–cell engraftment in %EGFRt+ of CD3+ detected at each visit timepoint. Regions corresponding to more %CD8+ and %CD4+ in the CAR T-cell composition breakdown are highlighted for clarity.
Figure 3.
Figure 3.. Multiparameter flow cytometric analysis of SCRI-CAR19v2 versus SCRI-CAR19v1 CAR T cells.
Intracellular cytokine production in response to CD19 stimulation (A-B) and the phenotype of CAR (EGFRt+) T cells in unstimulated SCRI-CAR19v2 versus SCRI-CAR19v1 final products (C-E) was examined by flow cytometry. (A) Following 18h stimulation with CD19 antigen–bearing cells, poly-cytokine profiles of the CD8+EGFRt+ (left) and CD4+EGFRt+ (right) cells of SCRI-CAR19v2 versus SCRI-CAR19v1 products were determined using SPICE analysis software. (B) MFI of the individual cytokines examined in panel A. (C) Comparison of the percent of CD8+EGFRt+ and CD4+EGFRt+ cells in the CD8+ or CD4+ final product material with poly-activation marker expression, visualized via SPICE analysis. (D) MFI of the individual activation markers examined in panel C. (E) Percent of CD8+EGFRt+ and CD4+EGFRt+ cells expressing T-cell differentiation markers in the CD8+ (left) or CD4+ (right) final products. (SCRI-CAR19v2; CD8 n = 16–18 subjects; CD4 n = 15–17 subjects. SCRI-CAR19v1; CD8 n = 37–41 subjects; CD4 n = 37–38 subjects) (****, P ≤ 0.0001; ***, P ≤ 0.001; *, P ≤ 0.05). Significance determined by Mann-Whitney test.
Figure 4.
Figure 4.. Antigen-specific cytokine secretion by SCRI-CAR19v2 versus SCRI-CAR19v1 CAR T cells.
Following 18h stimulation with CD19-positive or -negative K562 cells, cytokine secretion by CD8+ (left) and CD4+ (right) products was determined by Luminex analysis of the culture supernatant. The antigen-specific cytokine production was determined by subtracting the response to CD19-negative control stimulation from the response to CD19-positive stimulation. (A) Heat map with dendrogram and (B) Principle component analysis (PCA) plot of cytokine secretion by SCRI-CAR19v2 (purple) and SCRI-CAR19v1 (green) CD8+ or CD4+ products. Log10 values of the cytokine production are used in these analyses. Analytes that were not detected in both SCRI-CAR19v2 and SCRI-CAR19v1 products were excluded. Last column of heat maps are pseudo-colored to indicate product designation. In panel A, unbiased hierarchical clustering analyses were carried out using “Ward.D” algorithm with Euclidean distance matrix on both products (rows) and analytes (columns). Data points in the PCA plots are colored with product designation and are grouped by the unbiased hierarchical clustering assignment on products (rows) presented in panel A. PCA analyses were conducted using covariance matrix. (C) Cytokine production (in pg/mL) represented by box plots displaying the median and 25th to 75th percentiles with whiskers extending to the minimum to maximum detected values. Only analytes with significantly different secretion between SCRI-CAR19v2 and SCRI-CAR19v1 products in either the CD8+ or CD4+ CAR T–cell populations are shown. (SCRI-CAR19v2; CD8 n = 14 subjects; CD4 n =17 subjects. SCRI-CAR19v1; CD8 n = 35 subjects; CD4 n = 38 subjects.****, P ≤ 0.0001; ***, P ≤ 0.001; **, P ≤ 0.01; *, P ≤ 0.05) Significance determined by Mann-Whitney test.
Figure 5.
Figure 5.. Participant-matched SCRI-CAR19v2 versus SCRI-CAR19v1.5 CAR Product Profiles.
Participant-matched CD8+ and CD4+ final products were generated for four PLAT-02 subjects. Following 18h stimulation with CD19-positive K562 cells, cytokine production was determined by intracellular cytokine staining. The cytokine production of stimulated cells as a percent of the CAR+ (EGFRt+) and the MFI of the cytokine levels is shown for both CD8+ cells (A) and CD4+ cells (D). Phenotypic attributes of CAR+ (EGFRt+) T cells in unstimulated SCRI-CAR19v2 and SCRI-CAR19v1.5 final product–matched pairs were assessed by flow cytometry. (B) Percent of CD8+EGFRt+ and (E) CD4+EGFRt+ cells expressing markers of activation or exhaustion as well as the MFI of the positive cells. (C) Percent of CD8+EGFRt+ and (F) CD4+EGFRt+ cells expressing markers of T-cell differentiation in the CD8+ and CD4+ final products. No significant difference was found in SCRI-CAR19v2 versus SCRI-CAR19v1.5 comparisons from panels A-F as determined by Wilcoxon test. (G) In vitro recursive tumor killing profiles of the four matched product pairs (50/50 mix of CD4+ and CD8+ products), when challenged 3x with K562-CD19-mCherry tumor cells. Increasing intensity indicates an increased growth of the mCherry tumor, inverse to tumor killing. Relative Total integrated intensity normalized per well at timepoint 0h, measured by an Incucyte live-cell imager every 2h. Plots represent the mean red Relative Total Integrated Intensity of triplicate wells for each SCRI-CAR19v1.5 and SCRI-CAR19v2 product. Vertical bars show SEM. Tumor re-challenges added at 72h and 144h (black triangles). Supernatant collections taken 18h after each challenge for cytokine analysis (white triangles). (H) Cytokine concentrations in supernatant of tumor killing assay 18h post-challenge for each product. Triangles represent the mean cytokine concentration in pg/mL of triplicates for a subject’s SCRI-CAR19v2 (purple) or SCRI-CAR19v1.5 (green) product. Vertical bars show SEM. Means associated with the same subject are connected (black lines). P-values reported are from paired t-tests using n=4 subject pairs.

References

    1. Swann JB and Smyth MJ, Immune surveillance of tumors. J Clin Invest, 2007. 117(5): p. 1137–46. - PMC - PubMed
    1. Blattman JN and Greenberg PD, Cancer immunotherapy: a treatment for the masses. Science, 2004. 305(5681): p. 200–5. - PubMed
    1. Lee DW, et al. , T cells expressing CD19 chimeric antigen receptors for acute lymphoblastic leukaemia in children and young adults: a phase 1 dose-escalation trial. Lancet, 2015. 385(9967): p. 517–28. - PMC - PubMed
    1. Maude SL, et al. , Chimeric antigen receptor T cells for sustained remissions in leukemia. N Engl J Med, 2014. 371(16): p. 1507–17. - PMC - PubMed
    1. Gardner RA, et al. , Intent-to-treat leukemia remission by CD19 CAR T cells of defined formulation and dose in children and young adults. Blood, 2017. 129(25): p. 3322–3331. - PMC - PubMed

Publication types

Associated data