

Impact of natural selection on global patterns of genetic variation and association with clinical phenotypes at genes involved in SARS-CoV-2 infection
- PMID: 35580180
- PMCID: PMC9173769
- DOI: 10.1073/pnas.2123000119
Impact of natural selection on global patterns of genetic variation and association with clinical phenotypes at genes involved in SARS-CoV-2 infection
Abstract
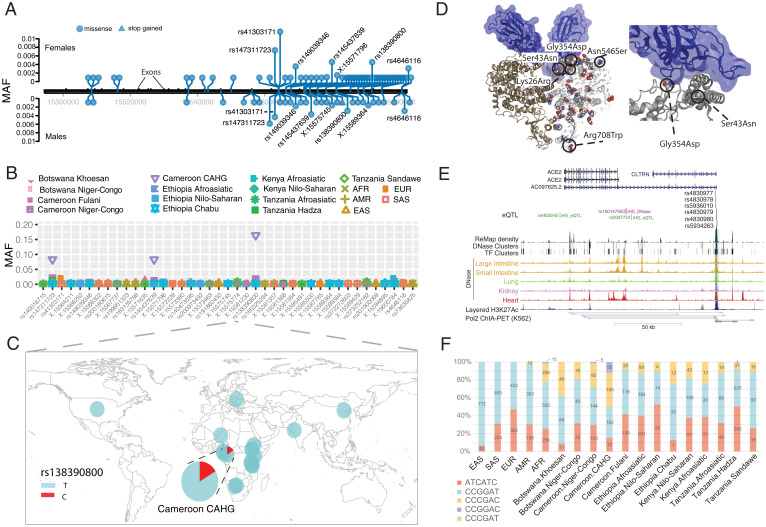
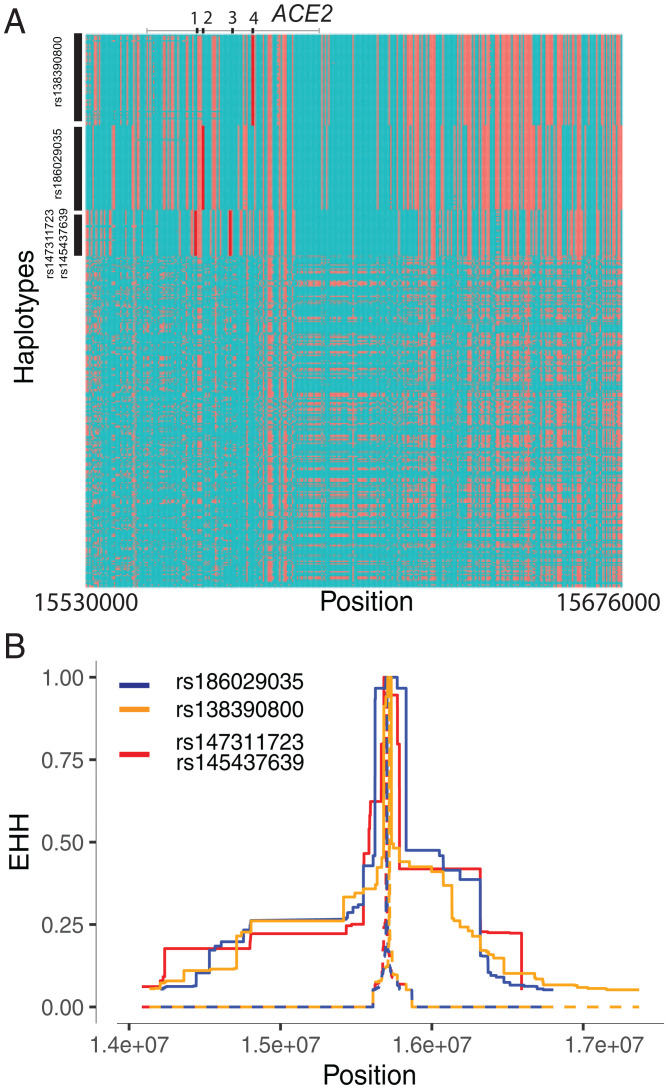
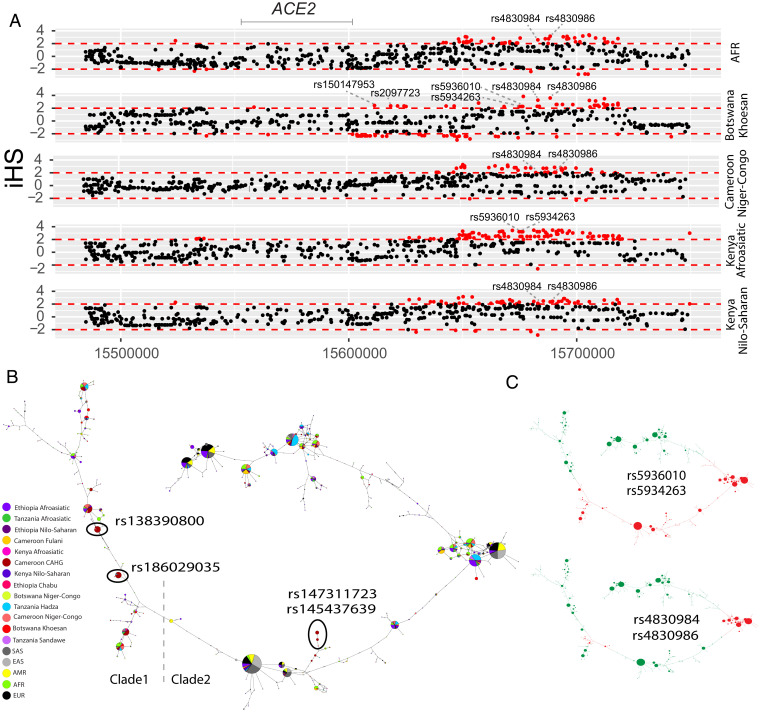
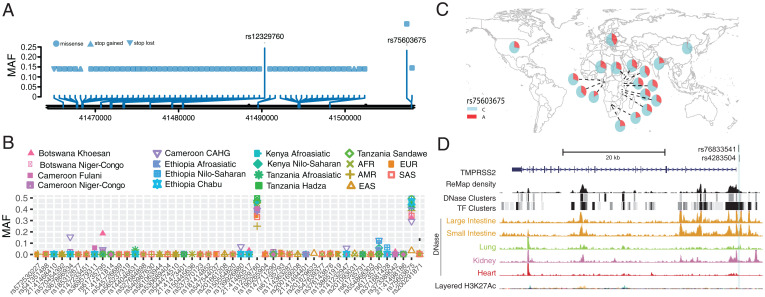
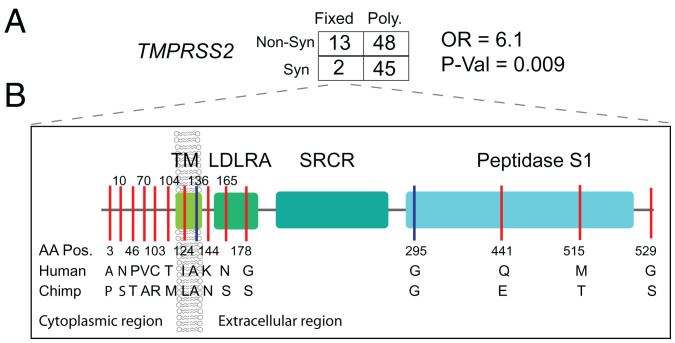
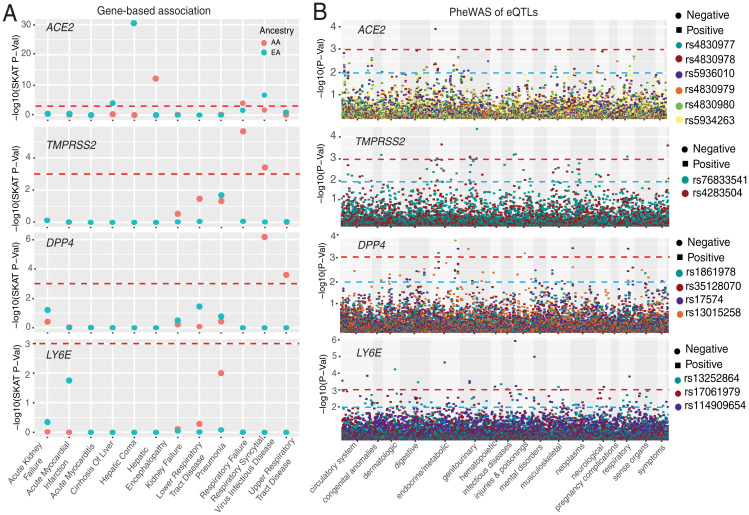
Human genomic diversity has been shaped by both ancient and ongoing challenges from viruses. The current coronavirus disease 2019 (COVID-19) pandemic caused by severe acute respiratory syndrome coronavirus 2 (SARS-CoV-2) has had a devastating impact on population health. However, genetic diversity and evolutionary forces impacting host genes related to SARS-CoV-2 infection are not well understood. We investigated global patterns of genetic variation and signatures of natural selection at host genes relevant to SARS-CoV-2 infection (angiotensin converting enzyme 2 [ACE2], transmembrane protease serine 2 [TMPRSS2], dipeptidyl peptidase 4 [DPP4], and lymphocyte antigen 6 complex locus E [LY6E]). We analyzed data from 2,012 ethnically diverse Africans and 15,977 individuals of European and African ancestry with electronic health records and integrated with global data from the 1000 Genomes Project. At ACE2, we identified 41 nonsynonymous variants that were rare in most populations, several of which impact protein function. However, three nonsynonymous variants (rs138390800, rs147311723, and rs145437639) were common among central African hunter-gatherers from Cameroon (minor allele frequency 0.083 to 0.164) and are on haplotypes that exhibit signatures of positive selection. We identify signatures of selection impacting variation at regulatory regions influencing ACE2 expression in multiple African populations. At TMPRSS2, we identified 13 amino acid changes that are adaptive and specific to the human lineage compared with the chimpanzee genome. Genetic variants that are targets of natural selection are associated with clinical phenotypes common in patients with COVID-19. Our study provides insights into global variation at host genes related to SARS-CoV-2 infection, which have been shaped by natural selection in some populations, possibly due to prior viral infections.
Keywords: African diversity; SARS-CoV-2/COVID-19; genetic variation; natural selection; phenotype association.
Conflict of interest statement
The authors declare no competing interest.
Figures
Update of
-
Impact of natural selection on global patterns of genetic variation, and association with clinical phenotypes, at genes involved in SARS-CoV-2 infection.medRxiv [Preprint]. 2021 Aug 7:2021.06.28.21259529. doi: 10.1101/2021.06.28.21259529. medRxiv. 2021. Update in: Proc Natl Acad Sci U S A. 2022 May 24;119(21):e2123000119. doi: 10.1073/pnas.2123000119. PMID: 34230933 Free PMC article. Updated. Preprint.
-
Impact of natural selection on global patterns of genetic variation, and association with clinical phenotypes, at genes involved in SARS-CoV-2 infection.Res Sq [Preprint]. 2021 Jul 27:rs.3.rs-673011. doi: 10.21203/rs.3.rs-673011/v1. Res Sq. 2021. Update in: Proc Natl Acad Sci U S A. 2022 May 24;119(21):e2123000119. doi: 10.1073/pnas.2123000119. PMID: 34341784 Free PMC article. Updated. Preprint.
Similar articles
-
Impact of natural selection on global patterns of genetic variation, and association with clinical phenotypes, at genes involved in SARS-CoV-2 infection.medRxiv [Preprint]. 2021 Aug 7:2021.06.28.21259529. doi: 10.1101/2021.06.28.21259529. medRxiv. 2021. Update in: Proc Natl Acad Sci U S A. 2022 May 24;119(21):e2123000119. doi: 10.1073/pnas.2123000119. PMID: 34230933 Free PMC article. Updated. Preprint.
-
Impact of natural selection on global patterns of genetic variation, and association with clinical phenotypes, at genes involved in SARS-CoV-2 infection.Res Sq [Preprint]. 2021 Jul 27:rs.3.rs-673011. doi: 10.21203/rs.3.rs-673011/v1. Res Sq. 2021. Update in: Proc Natl Acad Sci U S A. 2022 May 24;119(21):e2123000119. doi: 10.1073/pnas.2123000119. PMID: 34341784 Free PMC article. Updated. Preprint.
-
Impact of Genetic Variability in ACE2 Expression on the Evolutionary Dynamics of SARS-CoV-2 Spike D614G Mutation.Genes (Basel). 2020 Dec 24;12(1):16. doi: 10.3390/genes12010016. Genes (Basel). 2020. PMID: 33374416 Free PMC article.
-
SARS-CoV-2 Entry Related Viral and Host Genetic Variations: Implications on COVID-19 Severity, Immune Escape, and Infectivity.Int J Mol Sci. 2021 Mar 17;22(6):3060. doi: 10.3390/ijms22063060. Int J Mol Sci. 2021. PMID: 33802729 Free PMC article. Review.
-
Polymorphisms and mutations of ACE2 and TMPRSS2 genes are associated with COVID-19: a systematic review.Eur J Med Res. 2022 Feb 22;27(1):26. doi: 10.1186/s40001-022-00647-6. Eur J Med Res. 2022. PMID: 35193695 Free PMC article.
Cited by
-
Pharmacogenomics at the post-pandemic: If not now, then when?Front Pharmacol. 2022 Sep 26;13:1013527. doi: 10.3389/fphar.2022.1013527. eCollection 2022. Front Pharmacol. 2022. PMID: 36225567 Free PMC article. No abstract available.
-
The Spike Protein of SARS-coV2 19B (S) Clade Mirrors Critical Features of Viral Adaptation and Coevolution.Microorganisms. 2022 Oct 12;10(10):2017. doi: 10.3390/microorganisms10102017. Microorganisms. 2022. PMID: 36296293 Free PMC article.
-
Enhancing portability of trans-ancestral polygenic risk scores through tissue-specific functional genomic data integration.PLoS Genet. 2024 Aug 7;20(8):e1011356. doi: 10.1371/journal.pgen.1011356. eCollection 2024 Aug. PLoS Genet. 2024. PMID: 39110742 Free PMC article.
-
Adherence to COVID-19 preventive measures in Sub-Saharan Africa during the 1st year of the pandemic: Pooled analysis of the International Citizen Project on COVID-19 (ICPCovid) surveys.Front Public Health. 2022 Nov 8;10:1020801. doi: 10.3389/fpubh.2022.1020801. eCollection 2022. Front Public Health. 2022. PMID: 36424955 Free PMC article.
-
No evidence that ACE2 or TMPRSS2 drive population disparity in COVID risks.BMC Med. 2024 Aug 26;22(1):337. doi: 10.1186/s12916-024-03539-0. BMC Med. 2024. PMID: 39183295 Free PMC article.
References
-
- Yancy C. W., COVID-19 and African Americans. JAMA 323, 1891–1892 (2020). - PubMed
Publication types
MeSH terms
Substances
Grants and funding
- R01 HL120393/HL/NHLBI NIH HHS/United States
- R35 GM138201/GM/NIGMS NIH HHS/United States
- UL1 TR001878/TR/NCATS NIH HHS/United States
- R01 AR076241/AR/NIAMS NIH HHS/United States
- R01 LM010098/LM/NLM NIH HHS/United States
- R01 GM113657/GM/NIGMS NIH HHS/United States
- R01 GM138597/GM/NIGMS NIH HHS/United States
- U01 HL120393/HL/NHLBI NIH HHS/United States
- R01 DK104339/DK/NIDDK NIH HHS/United States
- HHSN268201800001C/HL/NHLBI NIH HHS/United States
- P30 ES013508/ES/NIEHS NIH HHS/United States
- R01 HL117626/HL/NHLBI NIH HHS/United States
- R35 GM134957/GM/NIGMS NIH HHS/United States
LinkOut - more resources
Full Text Sources
Medical
Research Materials
Miscellaneous
