. 2022 May 24;119(21):e2120887119.
doi: 10.1073/pnas.2120887119. Epub 2022 May 17.

DNA methylation clocks for dogs and humans

Affiliations

DNA methylation clocks for dogs and humans

Steve Horvath et al. Proc Natl Acad Sci U S A. .

Abstract

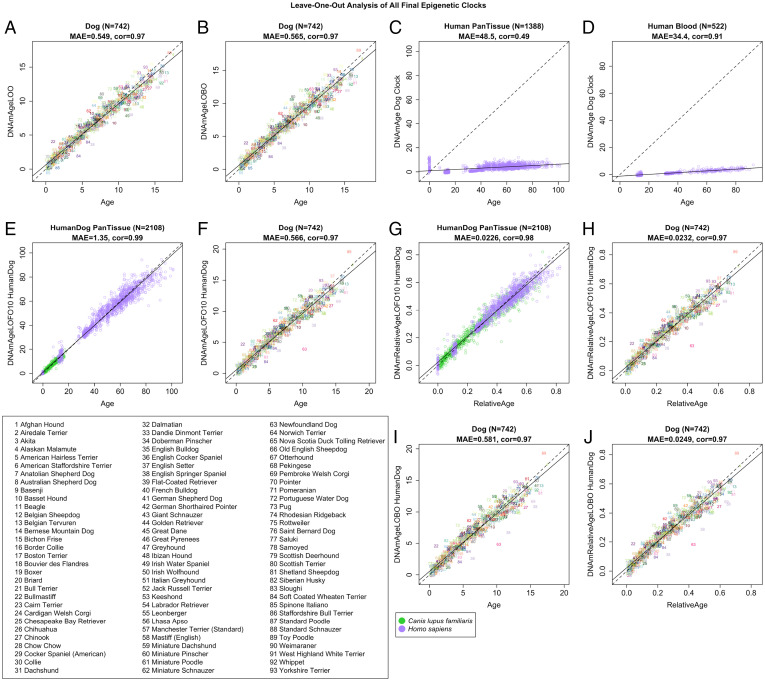
DNA methylation profiles have been used to develop biomarkers of aging known as epigenetic clocks, which predict chronological age with remarkable accuracy and show promise for inferring health status as an indicator of biological age. Epigenetic clocks were first built to monitor human aging, but their underlying principles appear to be evolutionarily conserved, as they have now been successfully developed for many mammalian species. Here, we describe reliable and highly accurate epigenetic clocks shown to apply to 93 domestic dog breeds. The methylation profiles were generated using the mammalian methylation array, which utilizes DNA sequences that are conserved across all mammalian species. Canine epigenetic clocks were constructed to estimate age and also average time to death. We also present two highly accurate human–dog dual species epigenetic clocks (R = 0.97), which may facilitate the ready translation from canine to human use (or vice versa) of antiaging treatments being developed for longevity and preventive medicine. Finally, epigenome-wide association studies here reveal individual methylation sites that may underlie the inverse relationship between breed weight and lifespan. Overall, we describe robust biomarkers to measure aging and, potentially, health status in canines.

Keywords: Canis familiaris; aging; dog; epigenetic clock; methylation.


Conflict of interest statement

Competing interest statement: S.H. is a founder of the nonprofit Epigenetic Clock Development Foundation who plans to license several patents from his employer University of California (UC) Regents. These patents list S.H. as an inventor. R.T.B. is the Executive Director of the Epigenetic Clock Development Foundation.

Figures

Fig. 1.
Fig. 1.
Three epigenetic clocks accurately estimate age in dogs. Evaluation of the accuracy of the pure dog clock for age (AD), human–dog clock for chronological age (E, F, I), and human–dog clock for relative age (G, H, J). The panels differ by test set (human data, dog data, or both) and cross-validation schemes. We report three types of cross-validation schemes, as follows: LOO (A), LOBO (B, I, J), and species-balanced (LOFO10Balance) analysis of human-dog clocks for (E and F) chronological age and (G and H) relative age. Each panel reports the sample size (N), correlation coefficient (cor), and MAE.
Fig. 2.
Fig. 2.
Epigenetic clocks predict average time to death. (A) LOBO estimates of DNAm average time to death (in years) versus average time to death in years. For each dog, the average time to death was defined as the difference between the median lifespan of the respective breed (LifespanMedian) and chronological age. (B and C) Mean of LOBO DNAm average time to death adjusted for age at breed level versus median lifespan (B) or weight (C). (D) LOBO DNAm average time to death versus chronological age. The association between LOBO DNAm average time to death adjusted for age and the lifespan remains significant (P = 1.5 × 10⁻¹⁰) even after adjusting for average adult weight in a multivariate regression model. (E and F) Phylogenetically independent (Indep.) contrast (PIC)-generated LOBO DNAm average time to death adjusted for age level versus PIC generated lifespan (E) or adult weight (F), at the breed level. For each panel, we report the sample size (n = 742 blood samples or n = 93 dog breeds), Pearson correlation estimate (cor), and Student’s t test P value. Individual dogs are colored by breed as listed in the legend of Fig. 1.
Fig. 3.
Fig. 3.
EWAS of chronological age in humans and dogs. (A) Manhattan plots of EWAS of age in humans (n = 508, 12.5 to 92.04 chronological y) and dogs (n = 742, 0.1 to 17.5 chronological y). The analysis was limited to 20,622 CpGs that aligned to orthologous genes in both species. The EWAS was carried out using a correlation test (Fisher transformation of Pearson correlation) between cytosine methylation and age. The red and blue dashed lines correspond to significance levels of P = 0.001 and P = 10−6, respectively. (B) Scatter plot of aging effects (correlation test Z statistics) in humans versus dogs. The Z statistics was calculated by applying the Fisher z-transformation to the Pearson correlation between CpG methylation and age for each species. Positive and negative values of the Z statistic indicate an age-related increase or decrease in methylation, respectively. Red dots indicate shared CpGs, black dots indicate species-specific CpGs, and blue dots indicate divergent changes. (C) Venn diagram of the overlap of top 1,000 CpGs (500 per direction) in both species. (D) GREAT enrichment analysis (15) of top 500 age-related CpGs per direction in each species. Column headings specify age-related decrease or increase in methylation. GREAT analysis was limited to 20,622 probes conserved between humans (Hg19) and dogs (CanFam_Great Dane v.3.1). We provide justification for the use of the GREAT analysis framework in the SI Appendix, Notes S4 and S5. The reported terms are significant at P < 1 × 10⁻⁵. Analyzed datasets were gene ontology biological processes and MsigDB perturbation.
Fig. 4.
Fig. 4.
EWAS of breed characteristics. (A) Manhattan plots of the EWAS results. Coordinates were estimated based on the alignment of the mammalian array probes to the CanFam_GreatDane.UMICH_Zoey_3.1.100 genome assembly. Red dots correspond to a positive association between DNAm at a given CpG and each breed trait, whereas blue dots represent a negative correlation. The red dashed line indicates a significance threshold of P < 10−3; the blue line corresponds to the Bonferroni-corrected significance level of P < 1 × 10⁻⁶. The top 15 CpGs were labeled according to their neighboring genes. (B) Location of the top CpGs in each tissue relative to the closest gene transcriptional start site. Enrichment per location type was compared to the assay background using Fisher’s exact test. The numbers on bars indicate proportion change OR. P < 0.05 (*negative OR, #positive OR), ***P < 0.001, ####P < 0.0001. (C) The Venn diagram shows the overlap of top CpGs associated with chronological age, breed median lifespan, average weight, and average height. Student’s t test statistic for age was used to select the top 500 positively and top 500 negatively age-related CpGs. (D) Sector plot of EWAS of breed lifespan versus weight. Red dots mark shared significant CpGs; black dots indicate significant trait-specific CpGs. Dashed lines indicate the significance threshold: P < 1 × 10⁻³ (red) and P > 0.05 (blue). The Z scores are Fisher’s z-transformation of Pearson correlation coefficients for each outcome.
Fig. 5.
Fig. 5.
Gene set enrichment analysis of CpGs related to age, breed lifespan, and breed weight of dogs. Gene set enrichment analysis was conducted on 20,622 CpGs that map to orthologous genes of the human Hg19 and Great Dane genome assembly using the GREAT tool (15). Each panel represents the top two enriched datasets from each category (gene ontology, mouse phenotypes, promoter motifs, and MsigDB perturbation) (P < 10−10). P values were log-transformed for easier visualization. The panel for human GWAS enrichment represents the significant results from the genomic-region-based enrichment analysis between 1) the top 2.5% genomic regions involved in GWAS of complex traits-associated genes and 2) up to the top 500 increased/decreased CpGs for each EWAS.
Fig. 6.
Fig. 6.
Hypergeometric overlap analysis between the top CpGs identified in our EWAS studies (columns) and two panels of CpGs (rows), as follows: 1) universal chromatin state analysis (26) and 2) PRC1 and PRC2 binding from ENCODE ChipSeq datasets (27). We display 18 universal chromatin states that show significant enrichment/depletion in EWAS of age, median breed lifespan, breed weight, or breed height (hypergeometric P < 1.0 × 10⁻⁶) and the PRC annotations. For each EWAS, we annotated up to the top 500 CpGs with positive and negative Z scores, respectively (P < 0.01). Each cell indicates the OR (Top value) and P value (Bottom value). The cell color is based on −log10 (P value) multiplied by the sign of OR > 1. Red denotes OR > 1; blue denotes OR < 1. The barplot (at y axis) depicts the proportion of PRC2 binding ranges from zero to one. The legend indicates chromatin states based on their group category and PRC group. The y axis lists chromatin state or PRC binding category with the number of mammalian array CpGs inside parentheses.

References

    1. Kaeberlein M., Creevy K. E., Promislow D. E. L., The dog aging project: Translational geroscience in companion animals. Mamm. Genome 27, 279–288 (2016). - PMC - PubMed
    1. Gilmore K. M., Greer K. A., Why is the dog an ideal model for aging research? Exp. Gerontol. 71, 14–20 (2015). - PubMed
    1. Hayward J. J., et al. , Complex disease and phenotype mapping in the domestic dog. Nat. Commun. 7, 10460 (2016). - PMC - PubMed
    1. Sándor S., Kubinyi E., Genetic pathways of aging and their relevance in the dog as a natural model of human aging. Front. Genet. 10, 948 (2019). - PMC - PubMed
    1. Wang T., et al. , Quantitative translation of dog-to-human aging by conserved remodeling of the DNA methylome. Cell Syst. 11, 176–185.e6 (2020). - PMC - PubMed

Publication types

LinkOut - more resources