. 2022 Jul:84:102624.
doi: 10.1016/j.jhealeco.2022.102624. Epub 2022 May 14.

Trading spaces: Medicare's regulatory spillovers on treatment setting for non-Medicare patients

Affiliations

Trading spaces: Medicare's regulatory spillovers on treatment setting for non-Medicare patients

Michael Geruso et al. J Health Econ. 2022 Jul.

Abstract

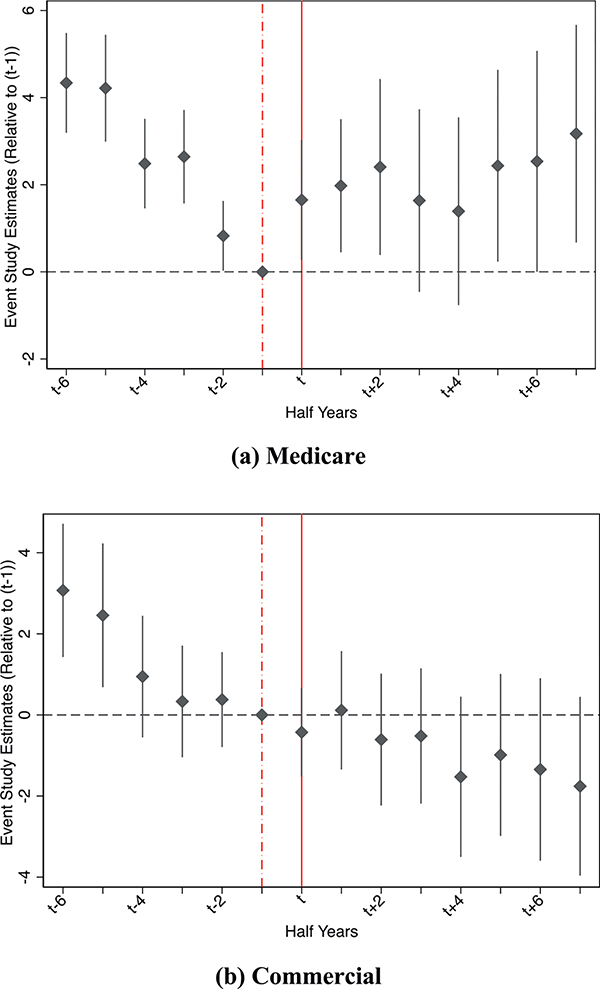
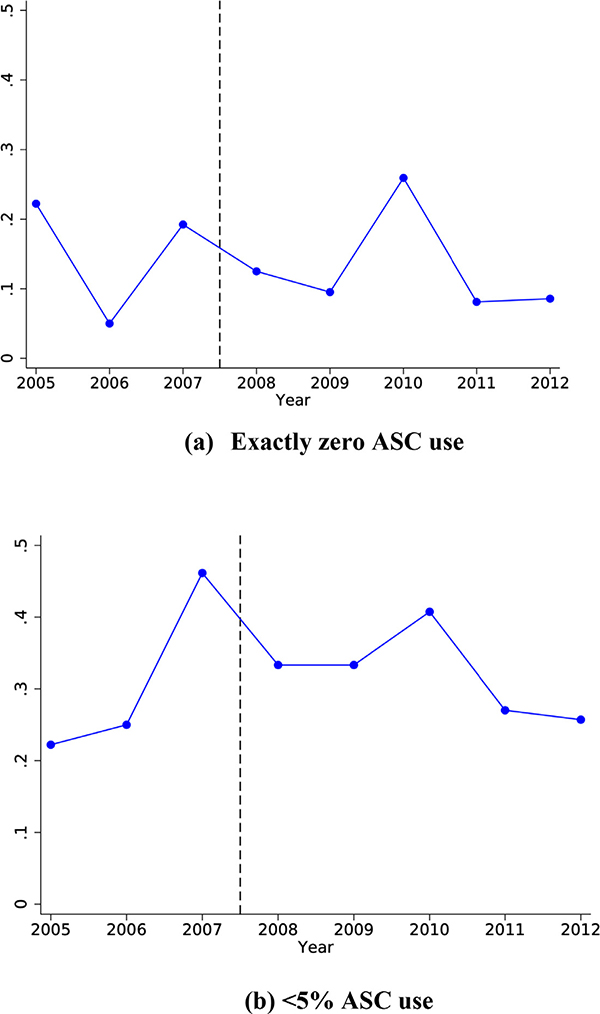
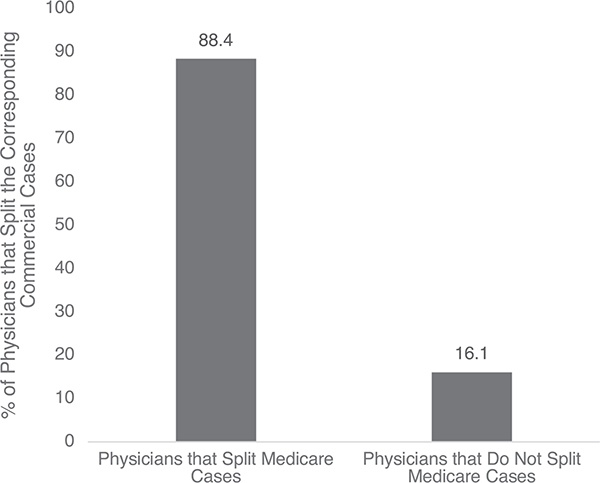
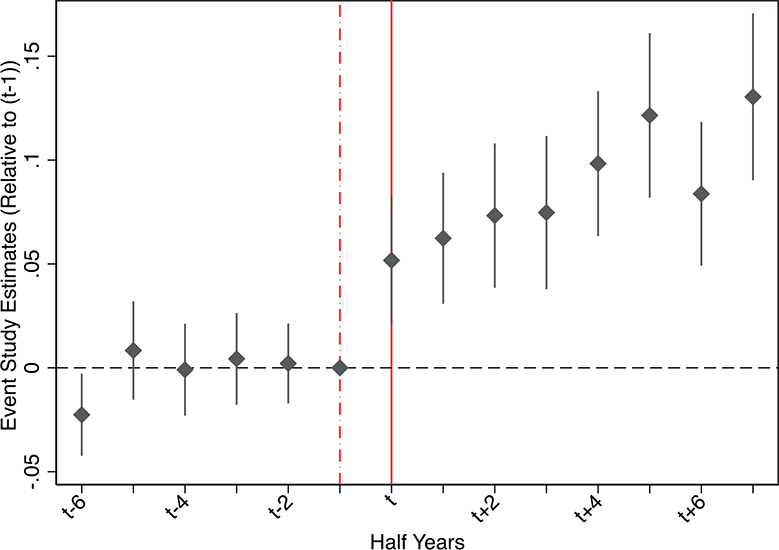
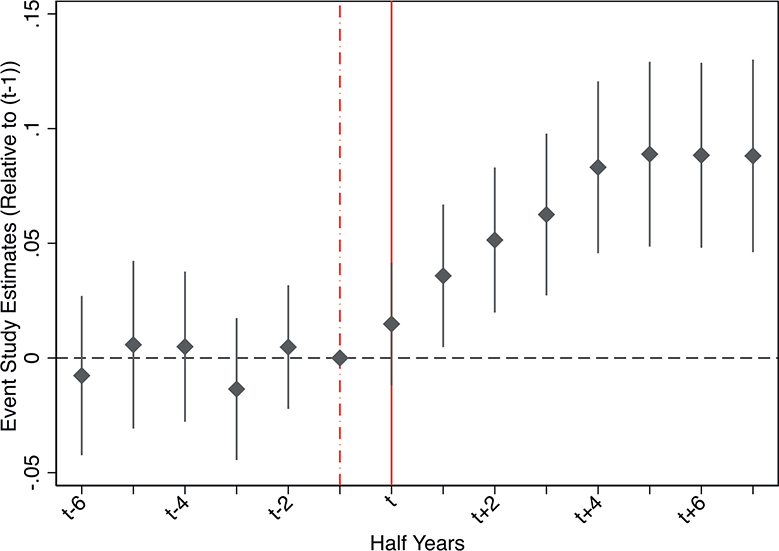
Medicare pricing is known to indirectly influence provider prices and care provision for non-Medicare patients; however, Medicare's regulatory externalities beyond fee-setting are less well understood. We study how physicians' outpatient surgery choices for non-Medicare patients responded to Medicare removing a ban on ambulatory surgery center (ASC) use for a specific procedure. Following the rule change, surgeons began reallocating both Medicare and commercially insured patients to ASCs. Specifically, physicians became 70% more likely to use ASCs for the policy-targeted procedure among their non-Medicare patients. These novel findings demonstrate that Medicare rulemaking affects physician behavior beyond the program's statutory scope.

Keywords: Ambulatory surgery center; Healthcare regulation; Medicare; Physician.


Conflict of interest statement

Conflict of interest: We have not conflicts.

Figures

Fig. B1.
Fig. B1.. Cross-Sectional Correspondence for Intensive Margin ASC Use Within-Physician and Across Payers.
Notes: The data are from the universe of ambulatory procedure discharge records in Florida in 2007. The plot shows the intensive margin correspondence across payers for all procedure-physician combinations. The horizontal axis consists of 10 equal bins formed by dividing the range of commercial payer ASC shares (0–100%) into 10 percentage point increments. The vertical axis measures the percent of the physician-procedures performed in ASCs, separately for Medicare and commercial patients. We limit to physician-procedure pairs with non-zero activity within both treatment settings. We also exclude relatively rare procedures for a given physician (i.e., those in the bottom quartile of the volume distribution—less than 14 cases in total).
Fig. B2.
Fig. B2.. Laparoscopic Cholecystectomy Volumes in Florida 2005–2011 by Payer.
Notes: The data are from the universe of ambulatory procedure discharge records in Florida 2005–2011. The data are at the year-quarter level.
Fig. B3.
Fig. B3.. Separate Event Study Estimates for the Control Group and Treatment Group by Payer.
Notes: Control group corresponds to that used in the main event studies displayed in Figs. 2 and 3. Of note, the top right panel (Medicare LC Surgeons) is not a precise zero for the pre-period coefficients due to a very small number of LC procedures reported as taking place within an ASC and for a Medicare patient. This may reflect misclassification of these cases or, at least in theory, could reflect a small minority of LC surgeons receiving special permission to perform select Medicare LC cases in the ASC––even though the ASC will receive no subsequent payment from Medicare. One such scenario could be an LC surgeon with a significant ownership stake in the ASC and therefore extensive discretion in such a decision.
Fig. B4.
Fig. B4.. Direct Effect of Medicare Policy Change That Allowed LC Surgeries in ASC Settings When Imposing a Balanced Panel of Medicare LC Cases for the Treatment Group.
Notes: The treatment group is all LC surgeons consistently observed over our 2005–2011 period in the commercial market. “Splitter” indicates that the physician provides at least some of the relevant procedure cases at both ASC and HOPD settings. The control group is composed of all provider-procedure combinations among non-LC physicians observed over our analytic window. Time periods are in half-year increments. The variables are constructed based only on traditional Medicare (i.e., fee-for-service) cases for the physicians in the sample. N=107,458. Unique provider-procedure fixed effects = 7733.
Fig. B5.
Fig. B5.
Sample Size Changes When Systematically Re-Estimating the DD Model Without One Control Group Principal Procedure.
Fig. B6.
Fig. B6.. Trends in Splitting for Non-LC Procedures among LC Surgeons by Payer.
Notes: Restricts to LC surgeons belonging to our main analytic sample underlying Table 3 and their corresponding non-LC outpatient procedures (i.e., all other services these surgeons provide to the Medicare or commercial market in a given time period). LC surgeons are further stratified by their regulatory response type from the main spillover analysis (Table 3).
Fig. B7.
Fig. B7.. Trends in Extensive Margin Use of ASCs with Lap Technology for Non-LC Procedures among LC Surgeons by Payer.
Notes: Restricts to LC surgeons belonging to our main analytic sample underlying Table 3 and their corresponding non-LC outpatient procedures (i.e., all other services these surgeons provide to the Medicare or commercial market in a given time period). LC surgeons are further stratified by their regulatory response type from the main spillover analysis (Table 3).
Fig. B8.
Fig. B8.. Event Study Estimates for the Medicare Regulation Intensive Margin Effect: Percent of Procedures Performed in ASCs (Inverse Hyperbolic Sine Transformation).
Notes: Treatment and control setup mirrors the main analyses.
Fig. B9.
Fig. B9.. Event Study Estimates for the Medicare Regulation Intensive Margin Effect: Percent of Procedures Performed in ASCs (Outcome Defined in Levels).
Notes: Treatment and control setup mirrors the main analyses.
Fig. C1.
Fig. C1.. Trends in Extensive Margin Use for LC Procedures at the Payer Level within the Marketscan Database, 2005–2012.
Notes: Panel (a) outcome is defined as share with precisely zero ASC cases for LCs. Panel (b) relaxes the threshold to <5% ASC use for LC procedures among enrollees.
Fig. 1.
Fig. 1.. Cross-Sectional Correspondence in Splitting Cases Between ASCs and HOPDs Within-Physicians, Across Their Medicare and Commercial Patients.
Notes: The data are from the universe of ambulatory procedure discharge records in Florida, and observations are at the physician-by-procedure level. Splitting is defined as having positive volume at both ASC and HOPD treatment settings for the physician-procedure pair. The data are restricted to 2007 and principal procedures recorded in the discharge records.
Fig. 2.
Fig. 2.. Direct Effect of Medicare Policy Change That Allowed LC Surgeries in ASC Settings.
Notes: The treatment group is all LC surgeons consistently observed over our 2005–2011 period in the commercial market. “Splitter” indicates that the physician provides at least some of the relevant procedure cases at both ASC and HOPD settings. The control group is composed of all provider-procedure combinations among non-LC physicians observed over our analytic window. Time periods are in half-year increments. The variables are constructed based only on traditional Medicare (i.e., fee-for-service) cases for the physicians in the sample. N=107,458. Unique provider-procedure fixed effects = 7733.
Fig. 3.
Fig. 3.. Spillover Effect of Medicare Policy Change for Non-Medicare LC Patients.
Notes: The treatment group is all LC surgeons consistently observed over our 2005–2011 period. “Splitter” indicates that the physician provides at least some of the relevant procedure cases at both ASC and HOPD settings. The control group is composed of all provider-procedure combinations among non-LC physicians observed over our analytic window. Time periods are in half-year increments. The variables are constructed based on only commercially insured (i.e., private, non-Medicare payer) cases for the physicians in the sample. N=160,510. Unique provider-procedure fixed effects = 11,465. During the pre-period, the splitter prevalence rate for LC surgeons and LC cases in our analytic sample is 12%.
Fig. 4.
Fig. 4.. Robustness Checks Against Alternative Control Groups for the Direct (Medicare) DD Estimate
Notes: Panel A represents 358 re-estimations for the direct effect on LC Surgeons’ probability of splitting Medicare LC cases between ASC and HOPD settings. Control group procedures are dropped one-by-one across the iterations. Panel B includes the DD estimates for 1,000 iterations in which a randomly drawn 50% sample of non-LC principle procedures is used to form the control group.
Fig. 5.
Fig. 5.. Robustness Checks Against Alternative Control Groups for the Spillover (Commercial) DD Estimate.
Notes: Panel A represent 540 re-estimations for the spillover effect on LC Surgeons’ probability of splitting commercial payer LC cases between ASC and HOPD settings. Control group procedures are dropped one-by-one across the iterations. Panel B includes the DD estimates for 1,000 iterations in which a randomly drawn 50% sample of non-LC principle procedures is used to form the control group.

Similar articles

Cited by

References

    1. Aouad M, Brown TT, Whaley CM, 2019. Reference pricing: the case of screening colonoscopies. J. Health Econ. 65, 246–259. - PMC - PubMed
    1. Baicker K, Chernew ME, Robbins JA, 2013. The spillover effects of Medicare managed care: Medicare advantage and hospital utilization. J. Health Econ. 32 (6), 1289–1300. - PMC - PubMed
    1. Baicker K, Robbins JA, 2015. Medicare payments and system-level health care use: the spillover effects of Medicare managed care. Am. J. Health Econ. 1 (4), 399–431. - PMC - PubMed
    1. Baker LC, Bundorf MK, Kessler DP, 2019. Competition in outpatient procedure markets. Med. Care 57 (1), 36–41. - PubMed
    1. Barnett ML, Olenski A, and Sacarny A. 2020. “Common practice: spillovers from Medicare on private health care.” NBER Working Paper Series, w27270, http://www.nber.org/papers/w27270.