. 2022 Jun 20;32(12):2581-2595.e6.
doi: 10.1016/j.cub.2022.04.053. Epub 2022 May 16.

Myotubularin-related phosphatase 5 is a critical determinant of autophagy in neurons

Affiliations

Myotubularin-related phosphatase 5 is a critical determinant of autophagy in neurons

Jason P Chua et al. Curr Biol. .

Abstract

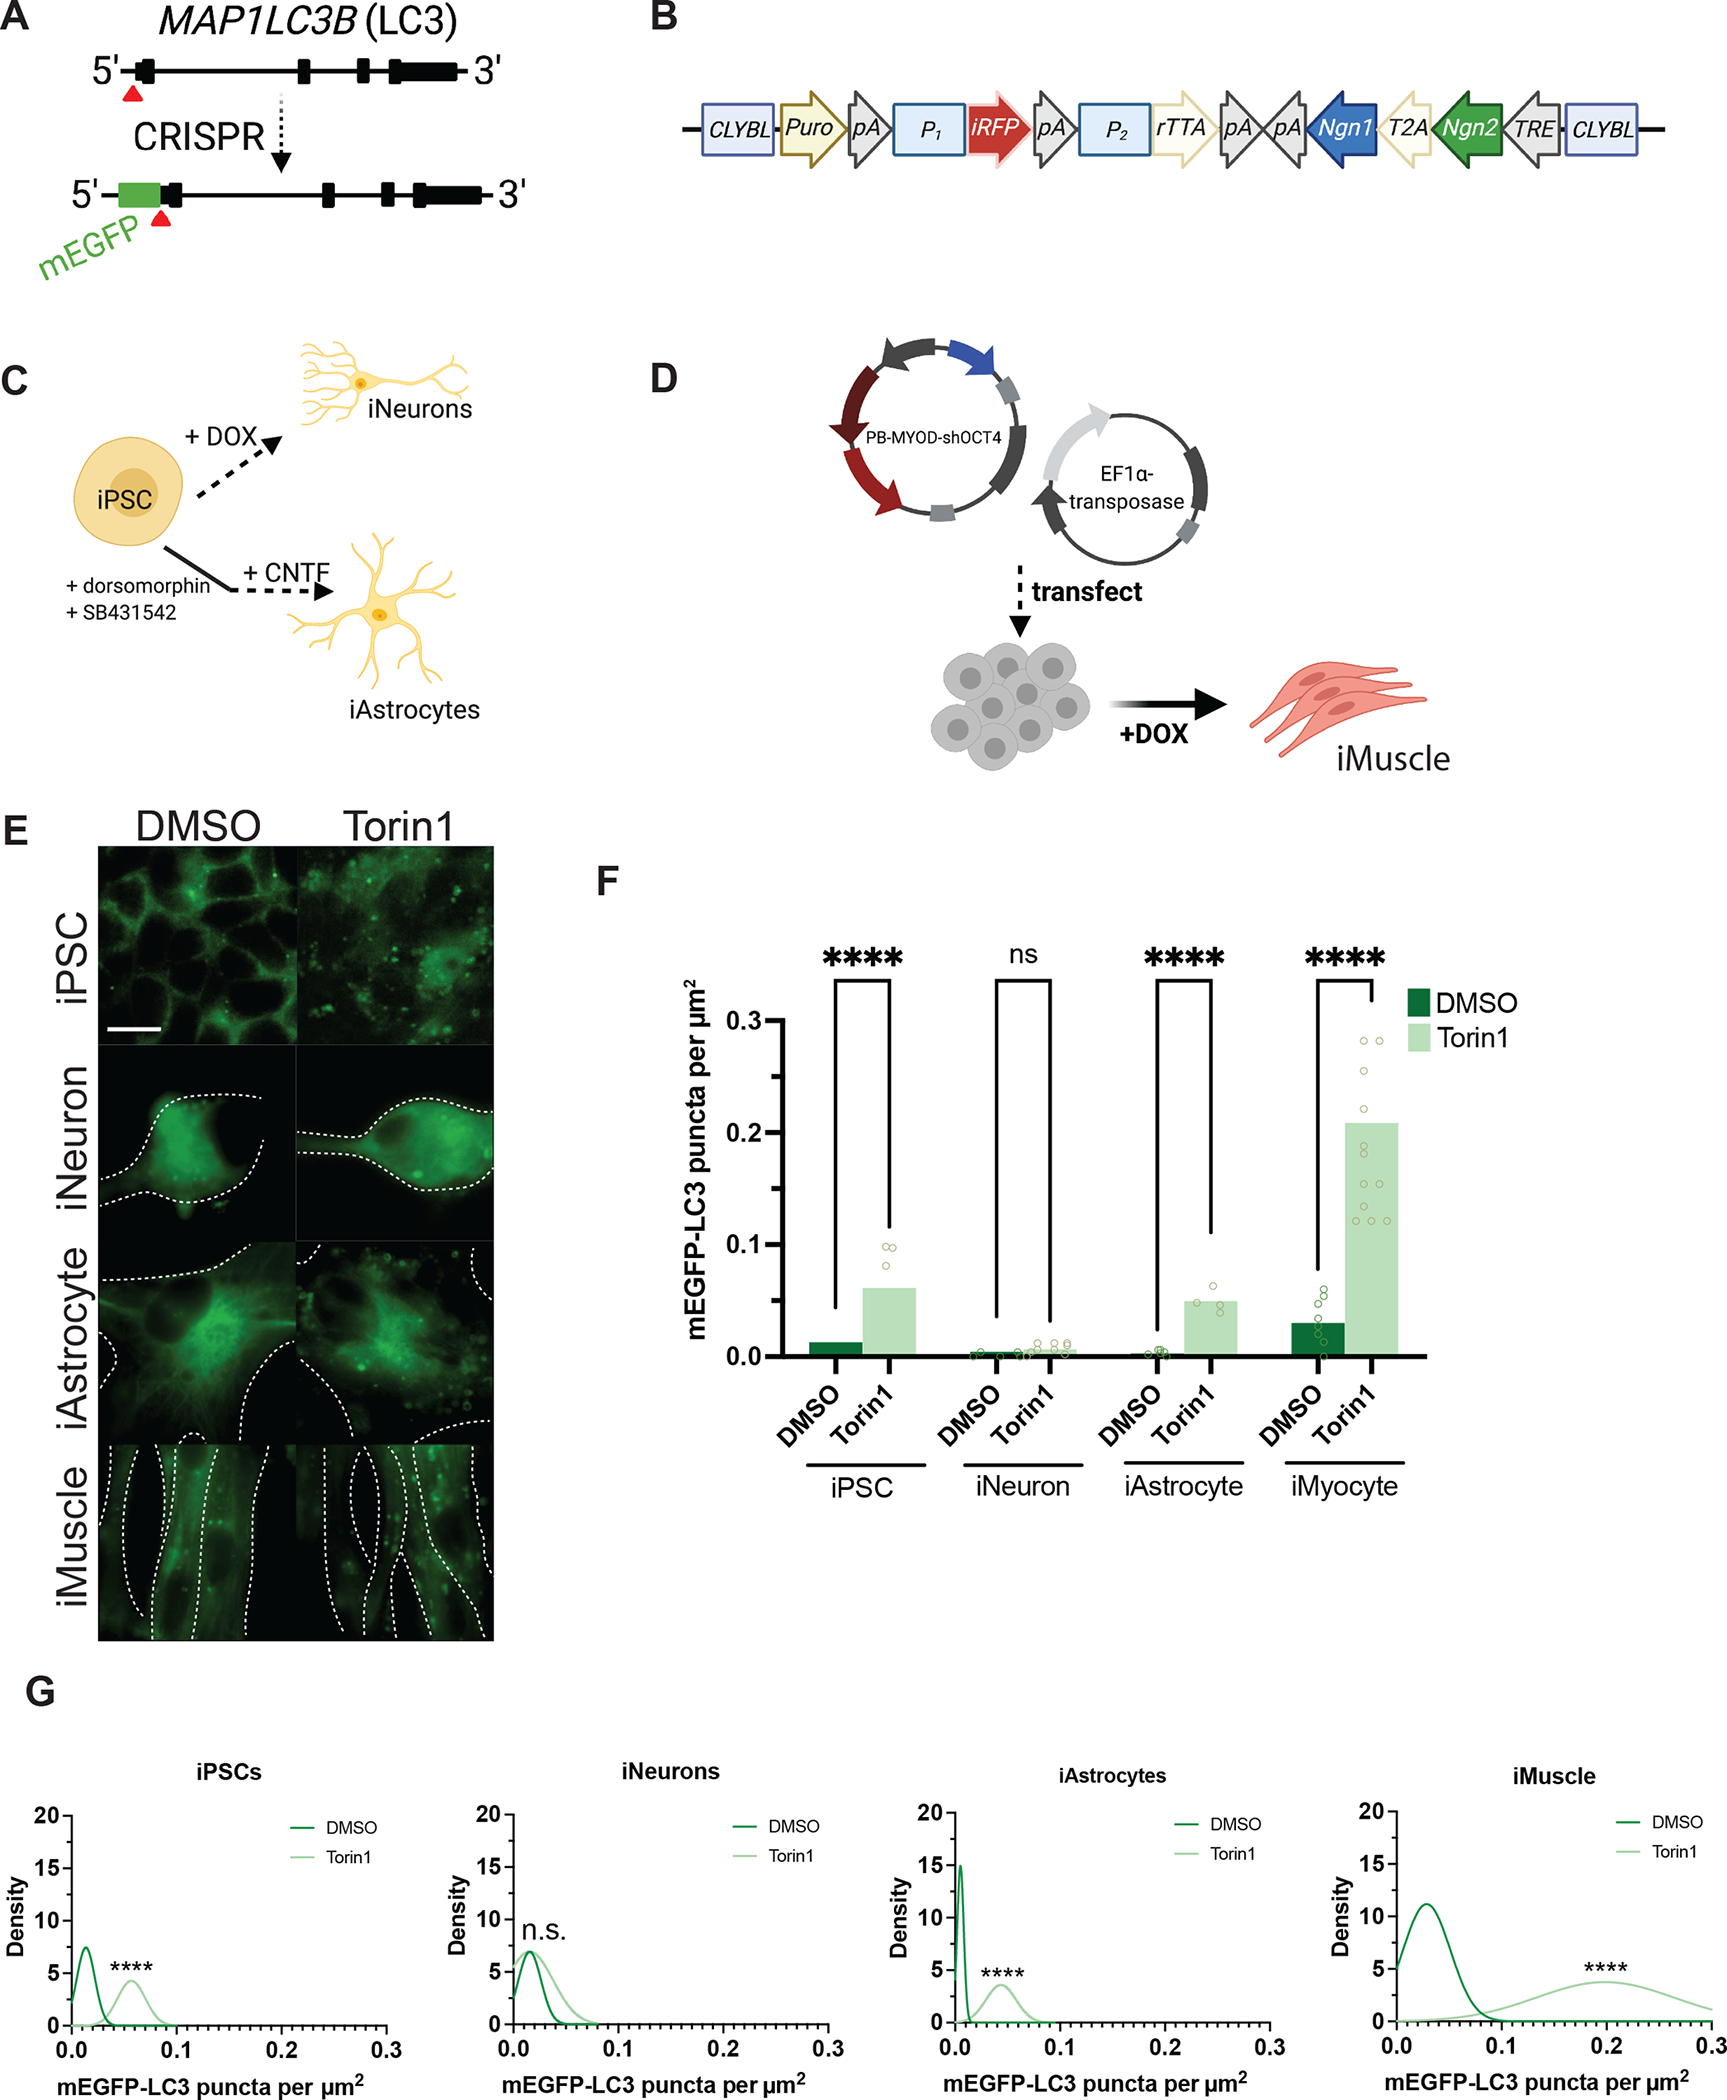
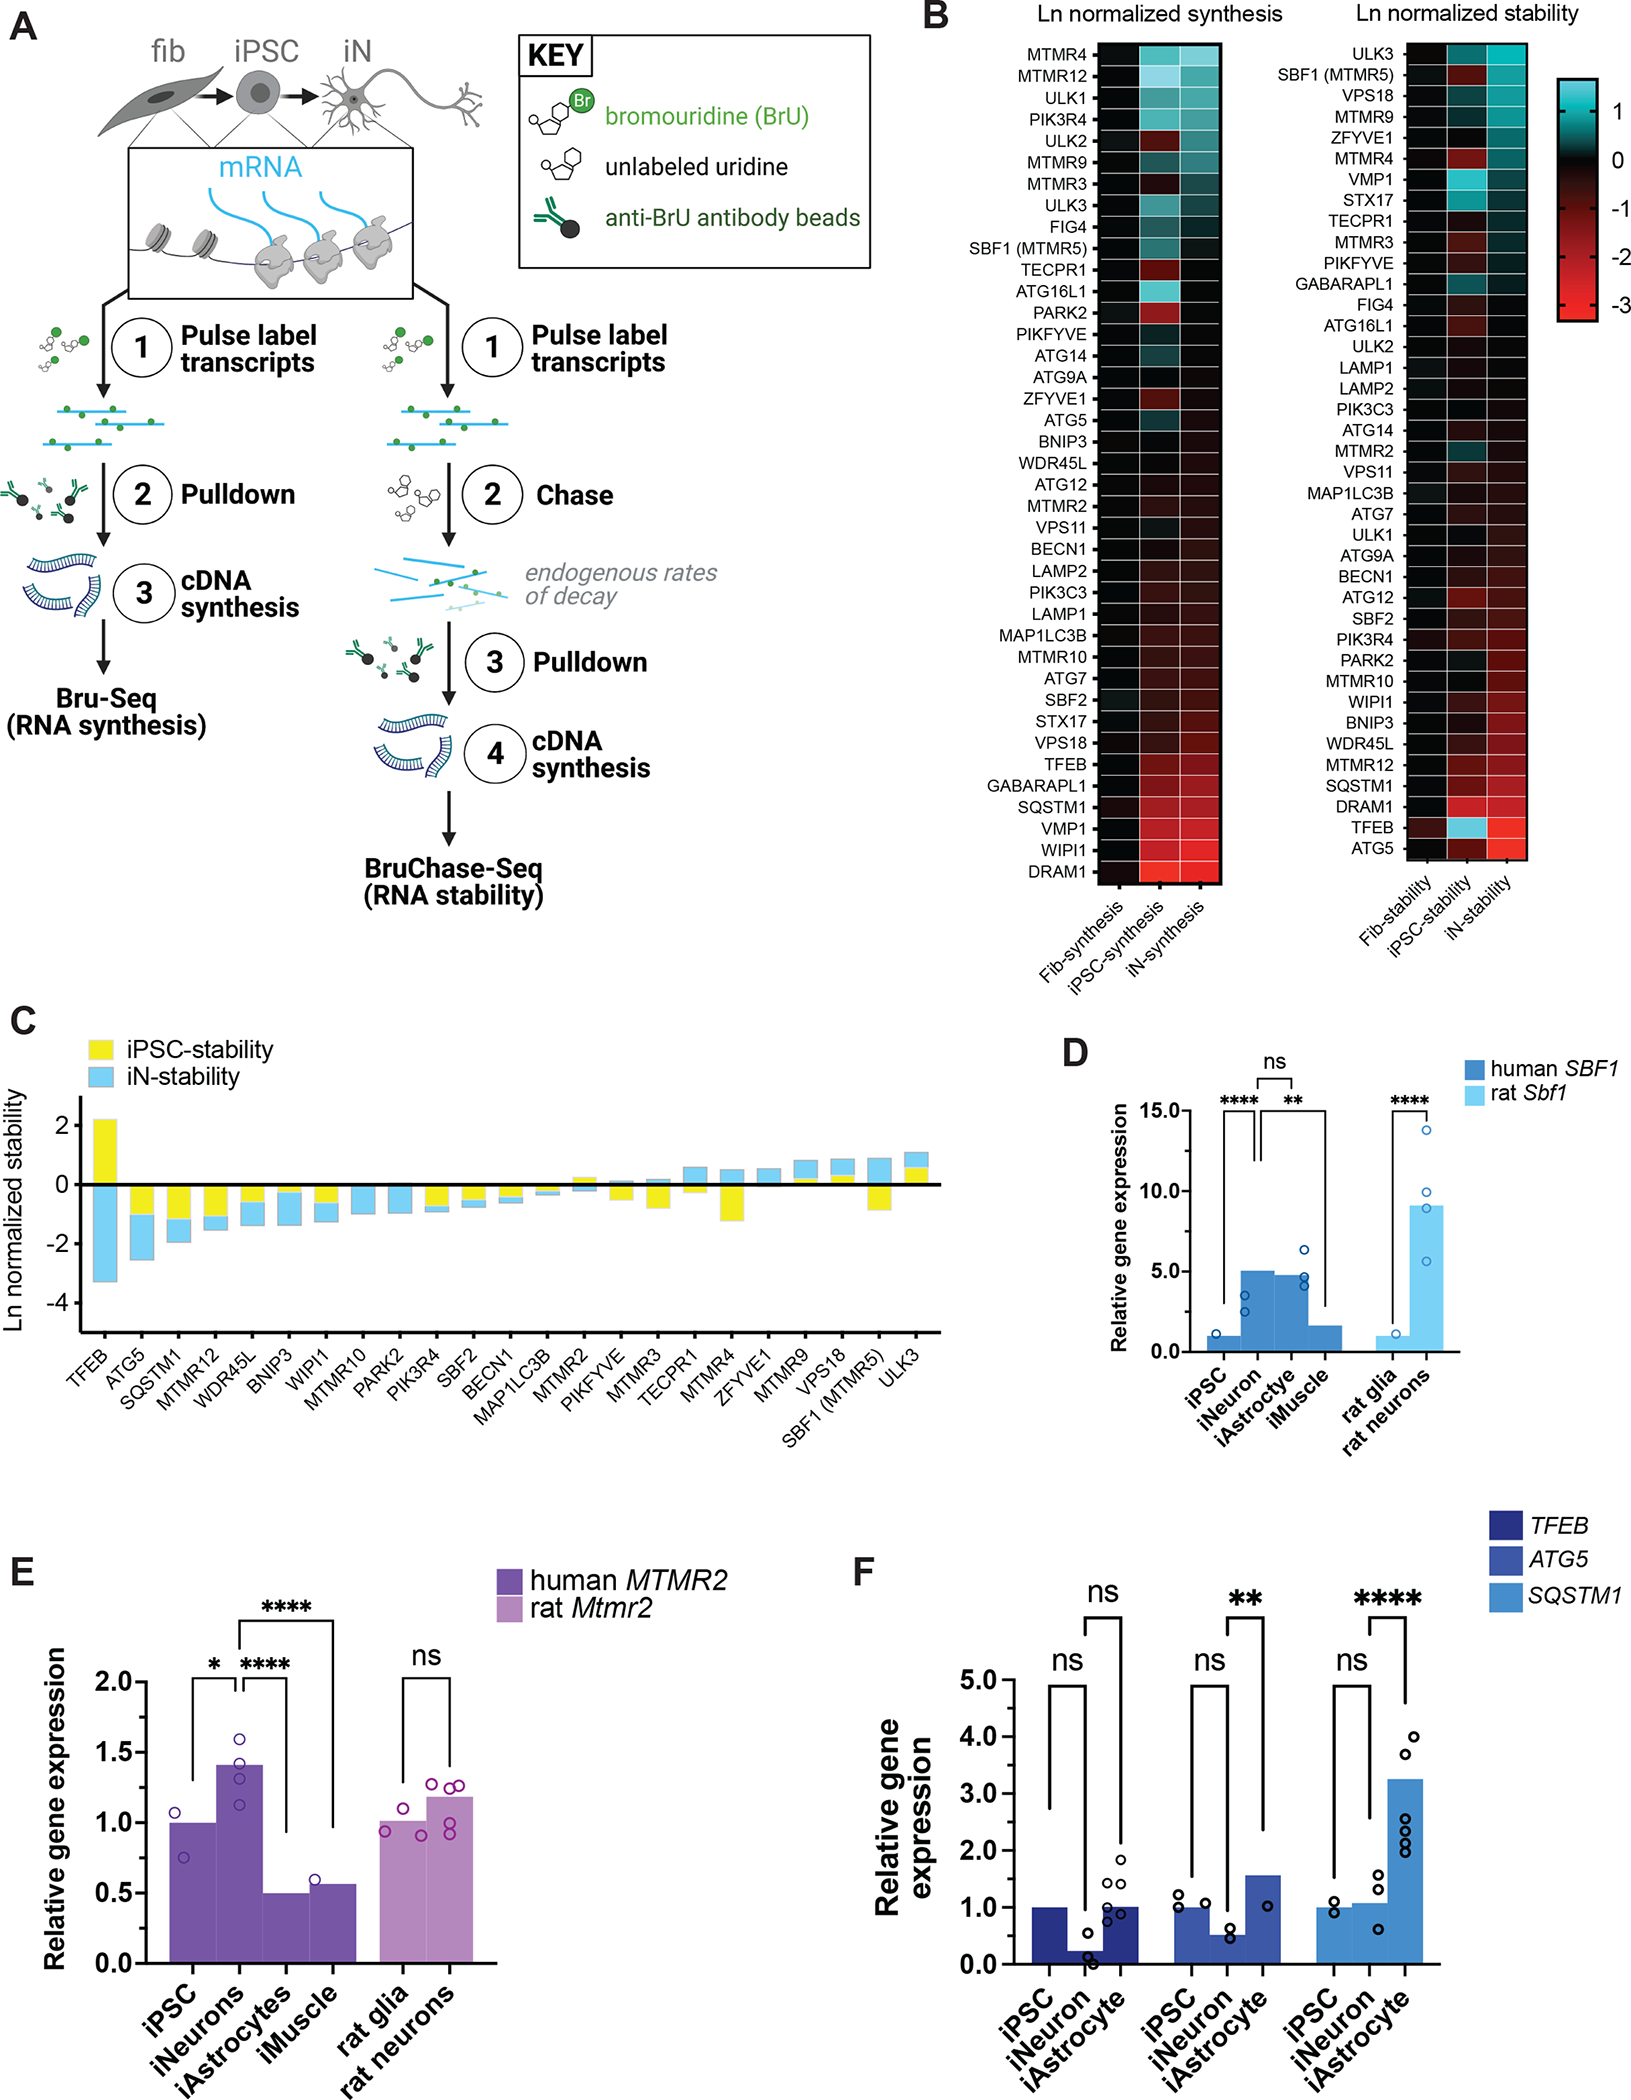
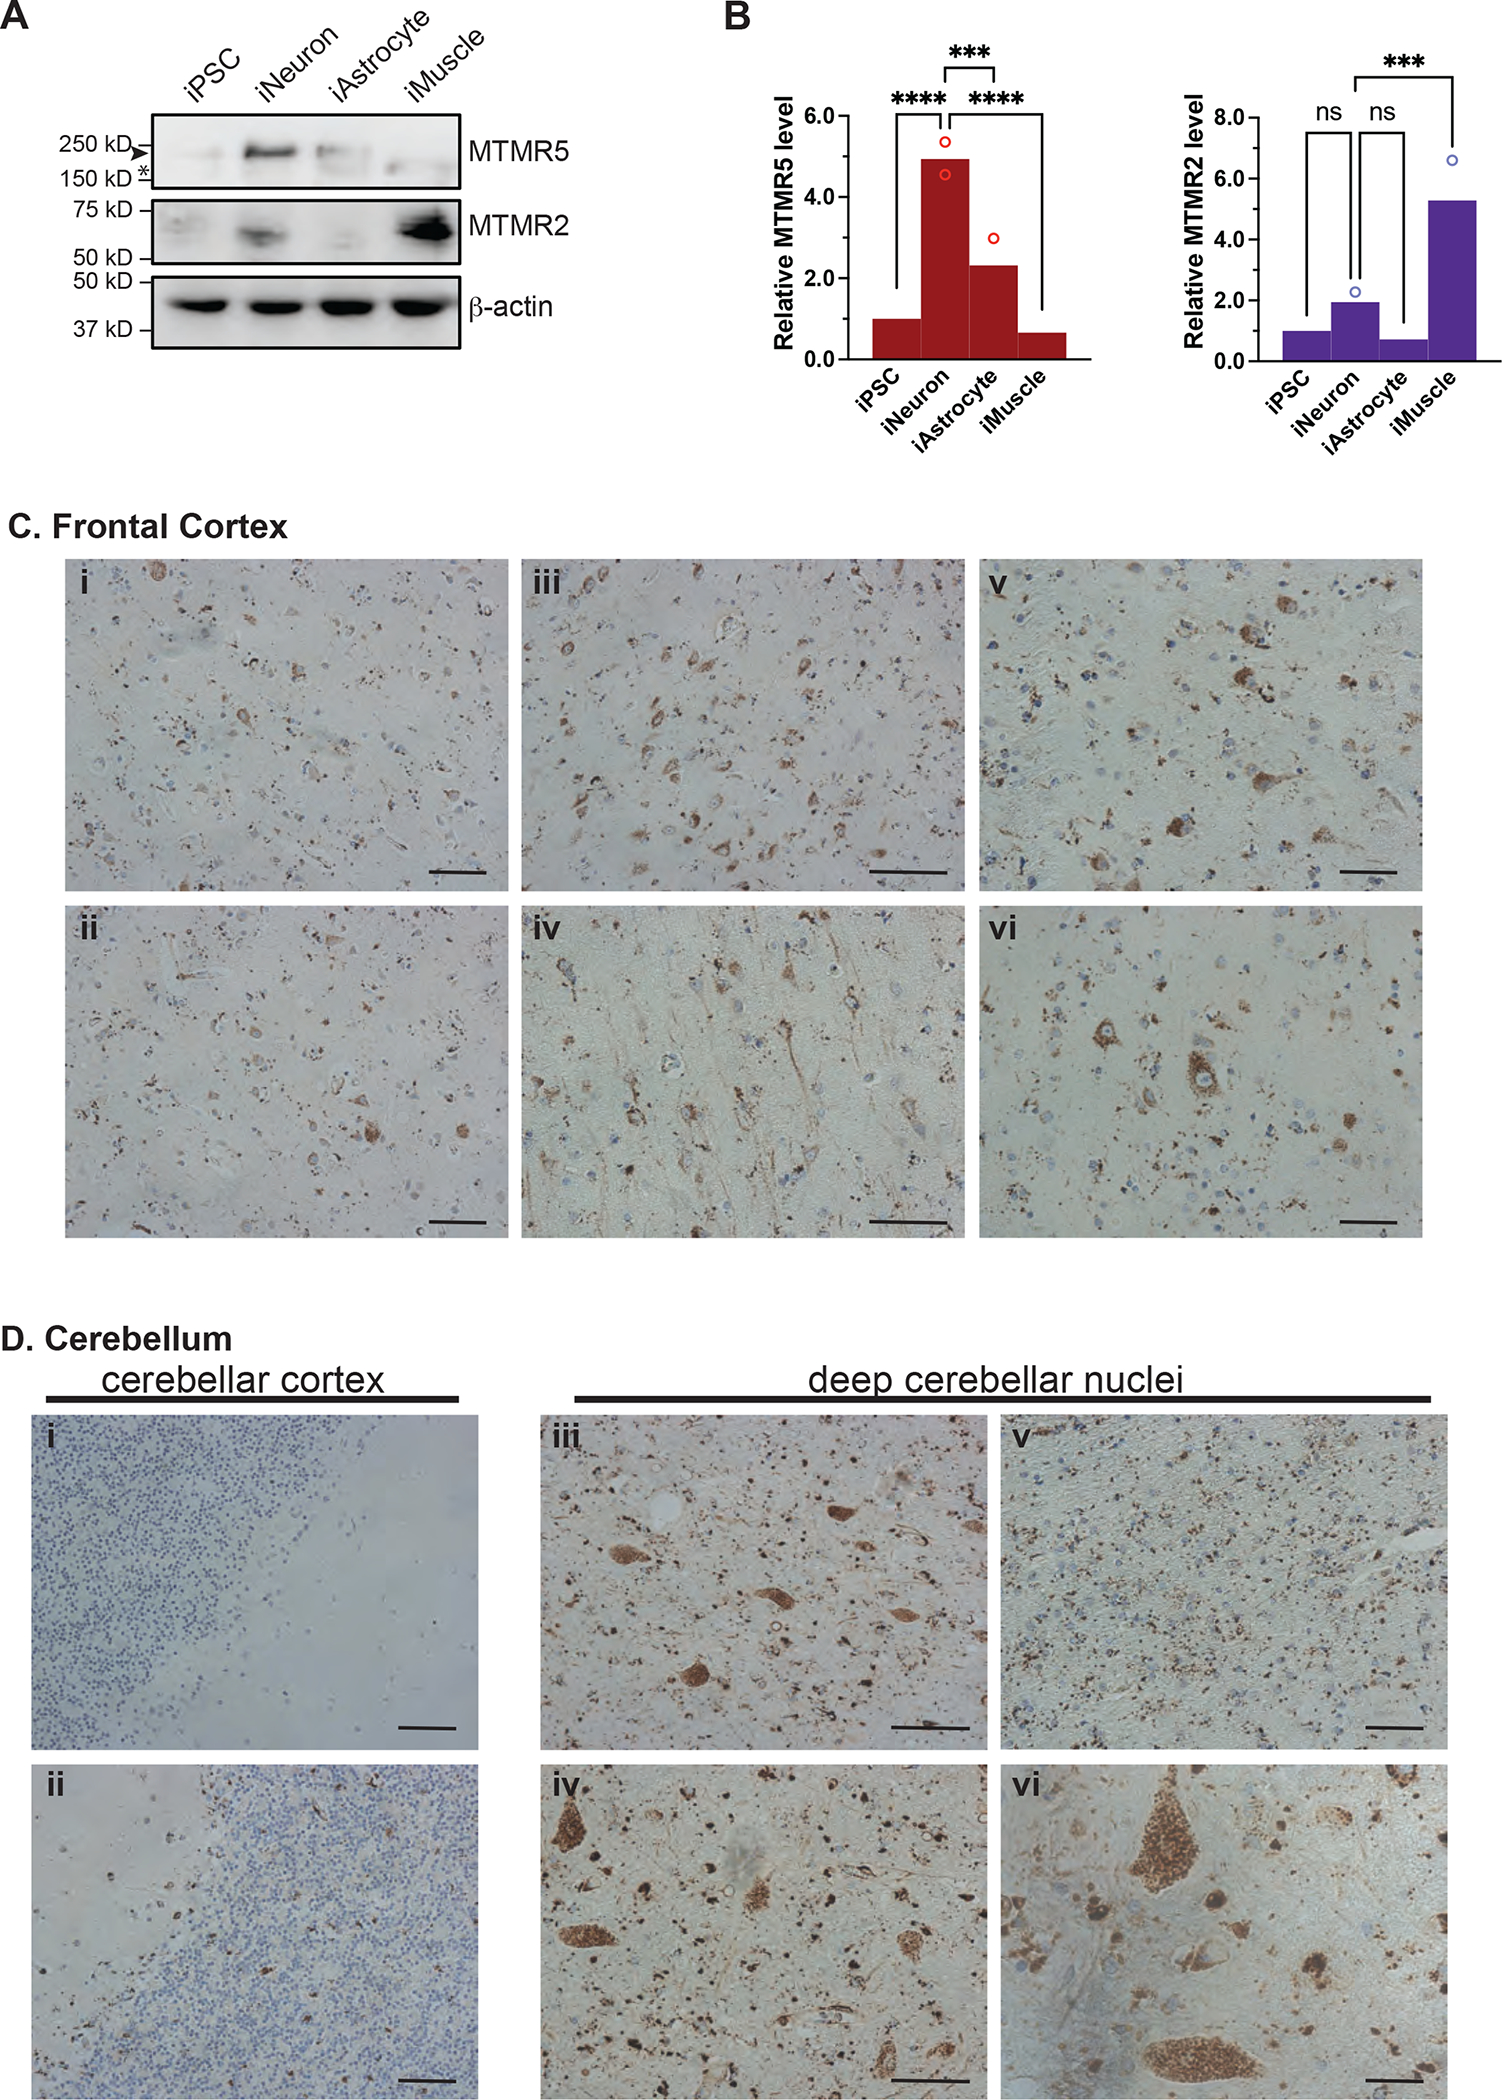
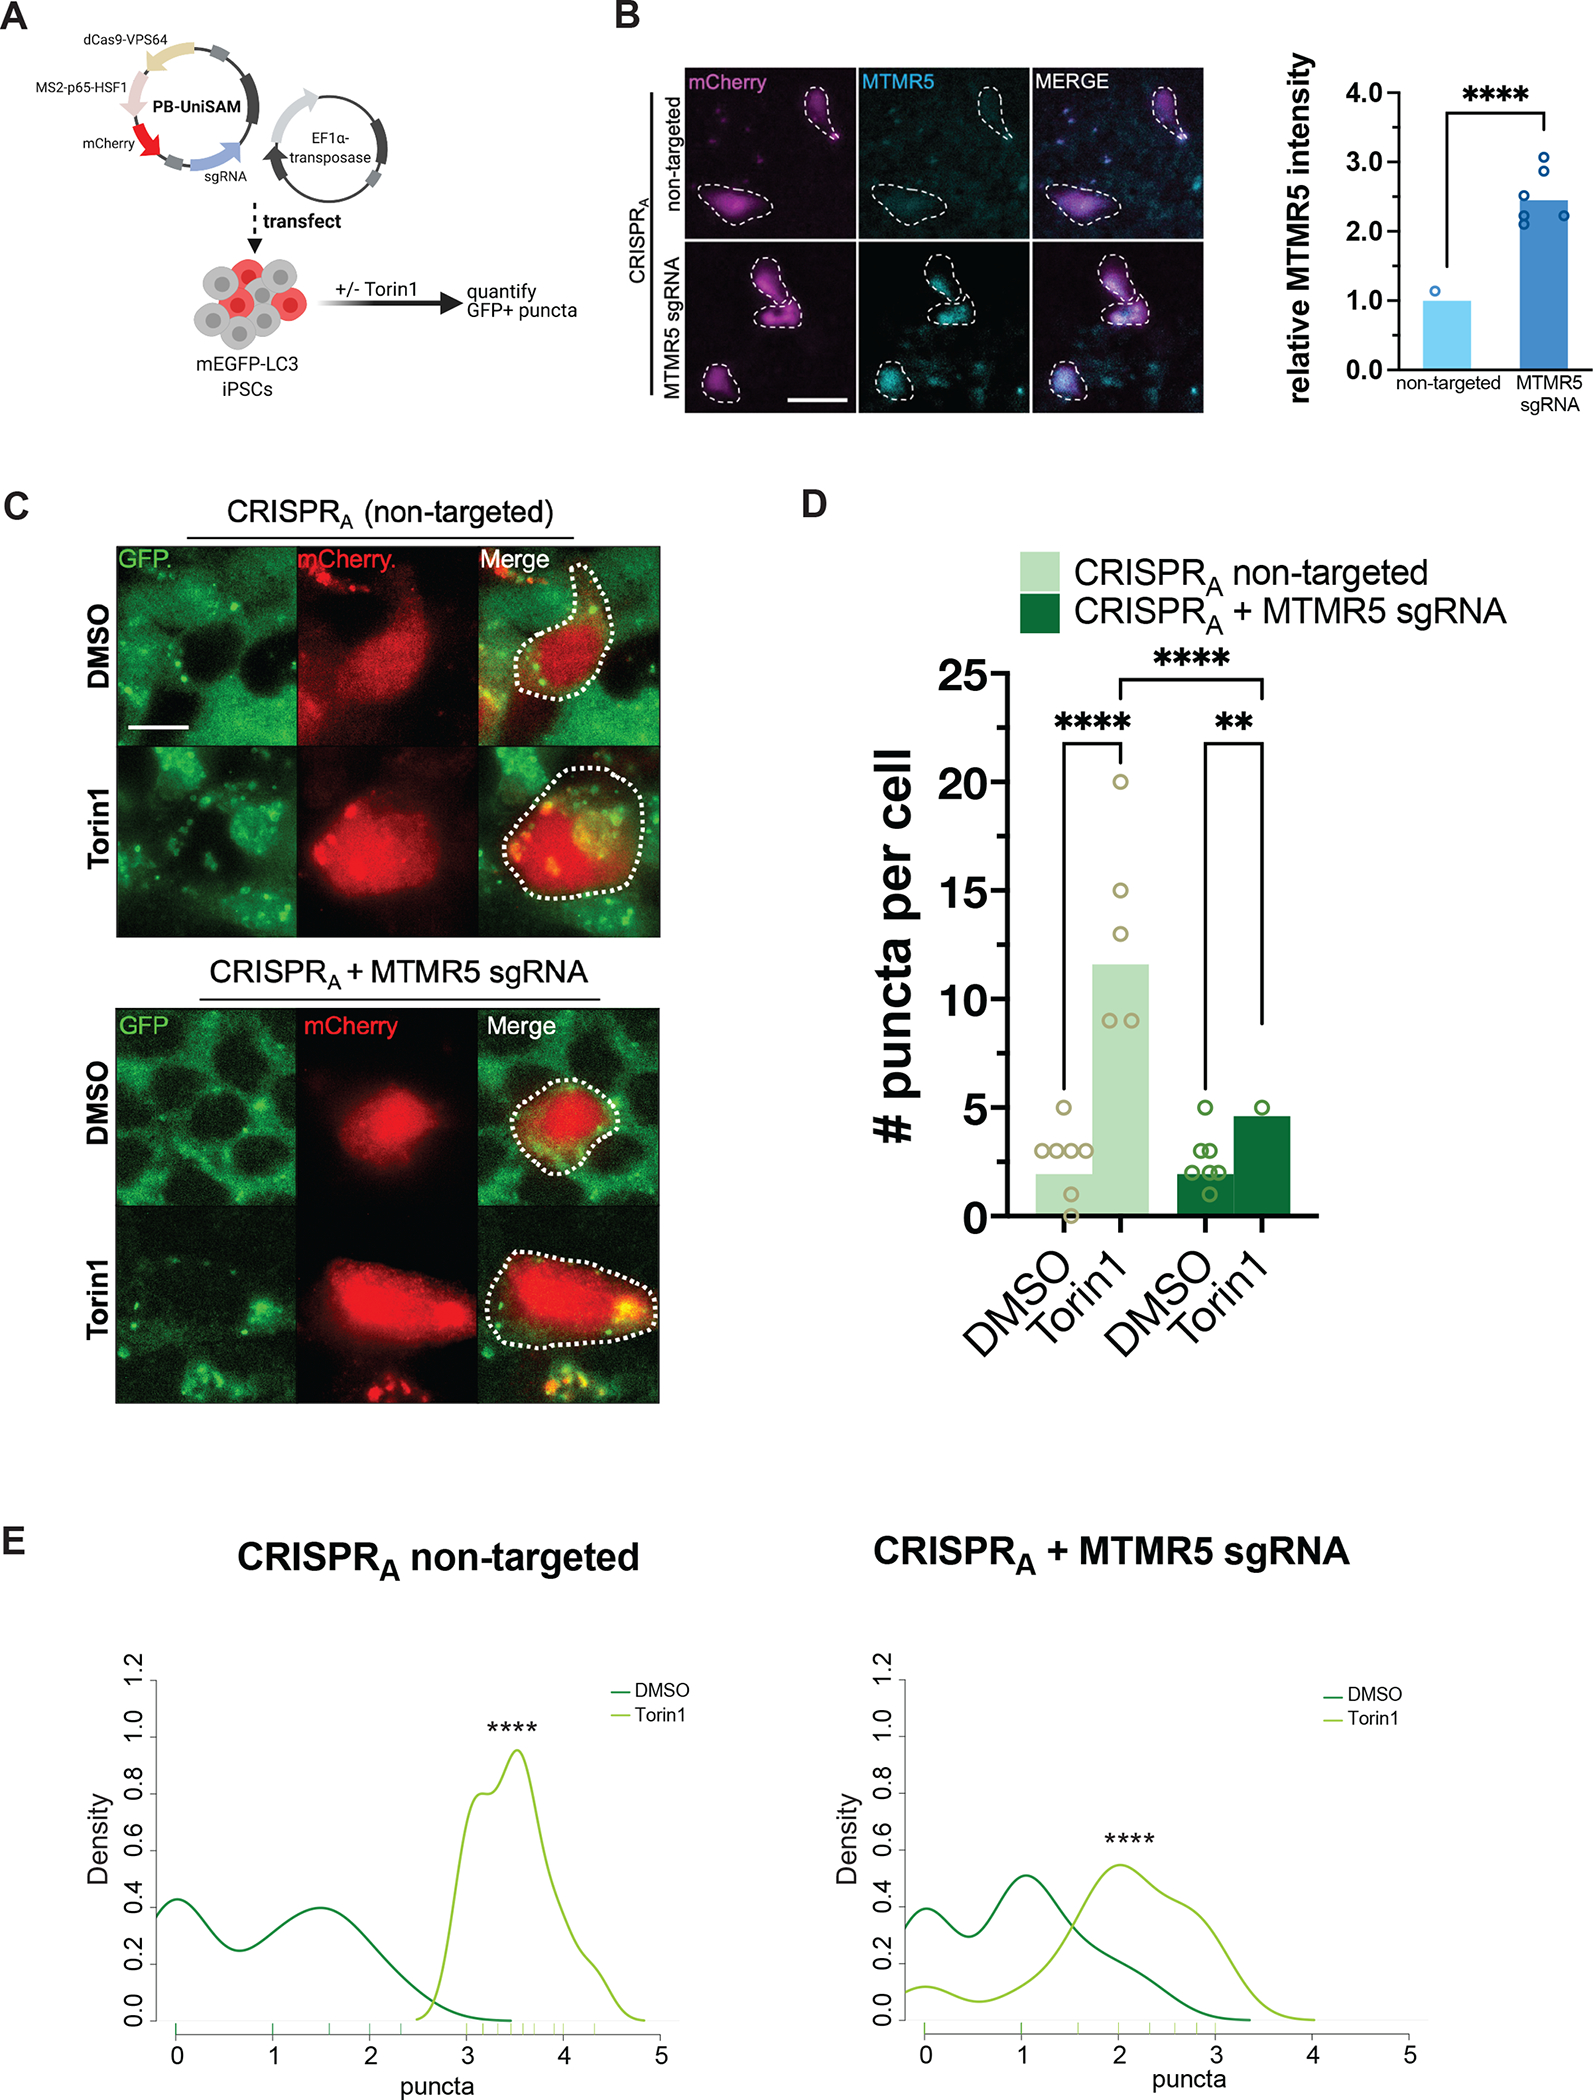
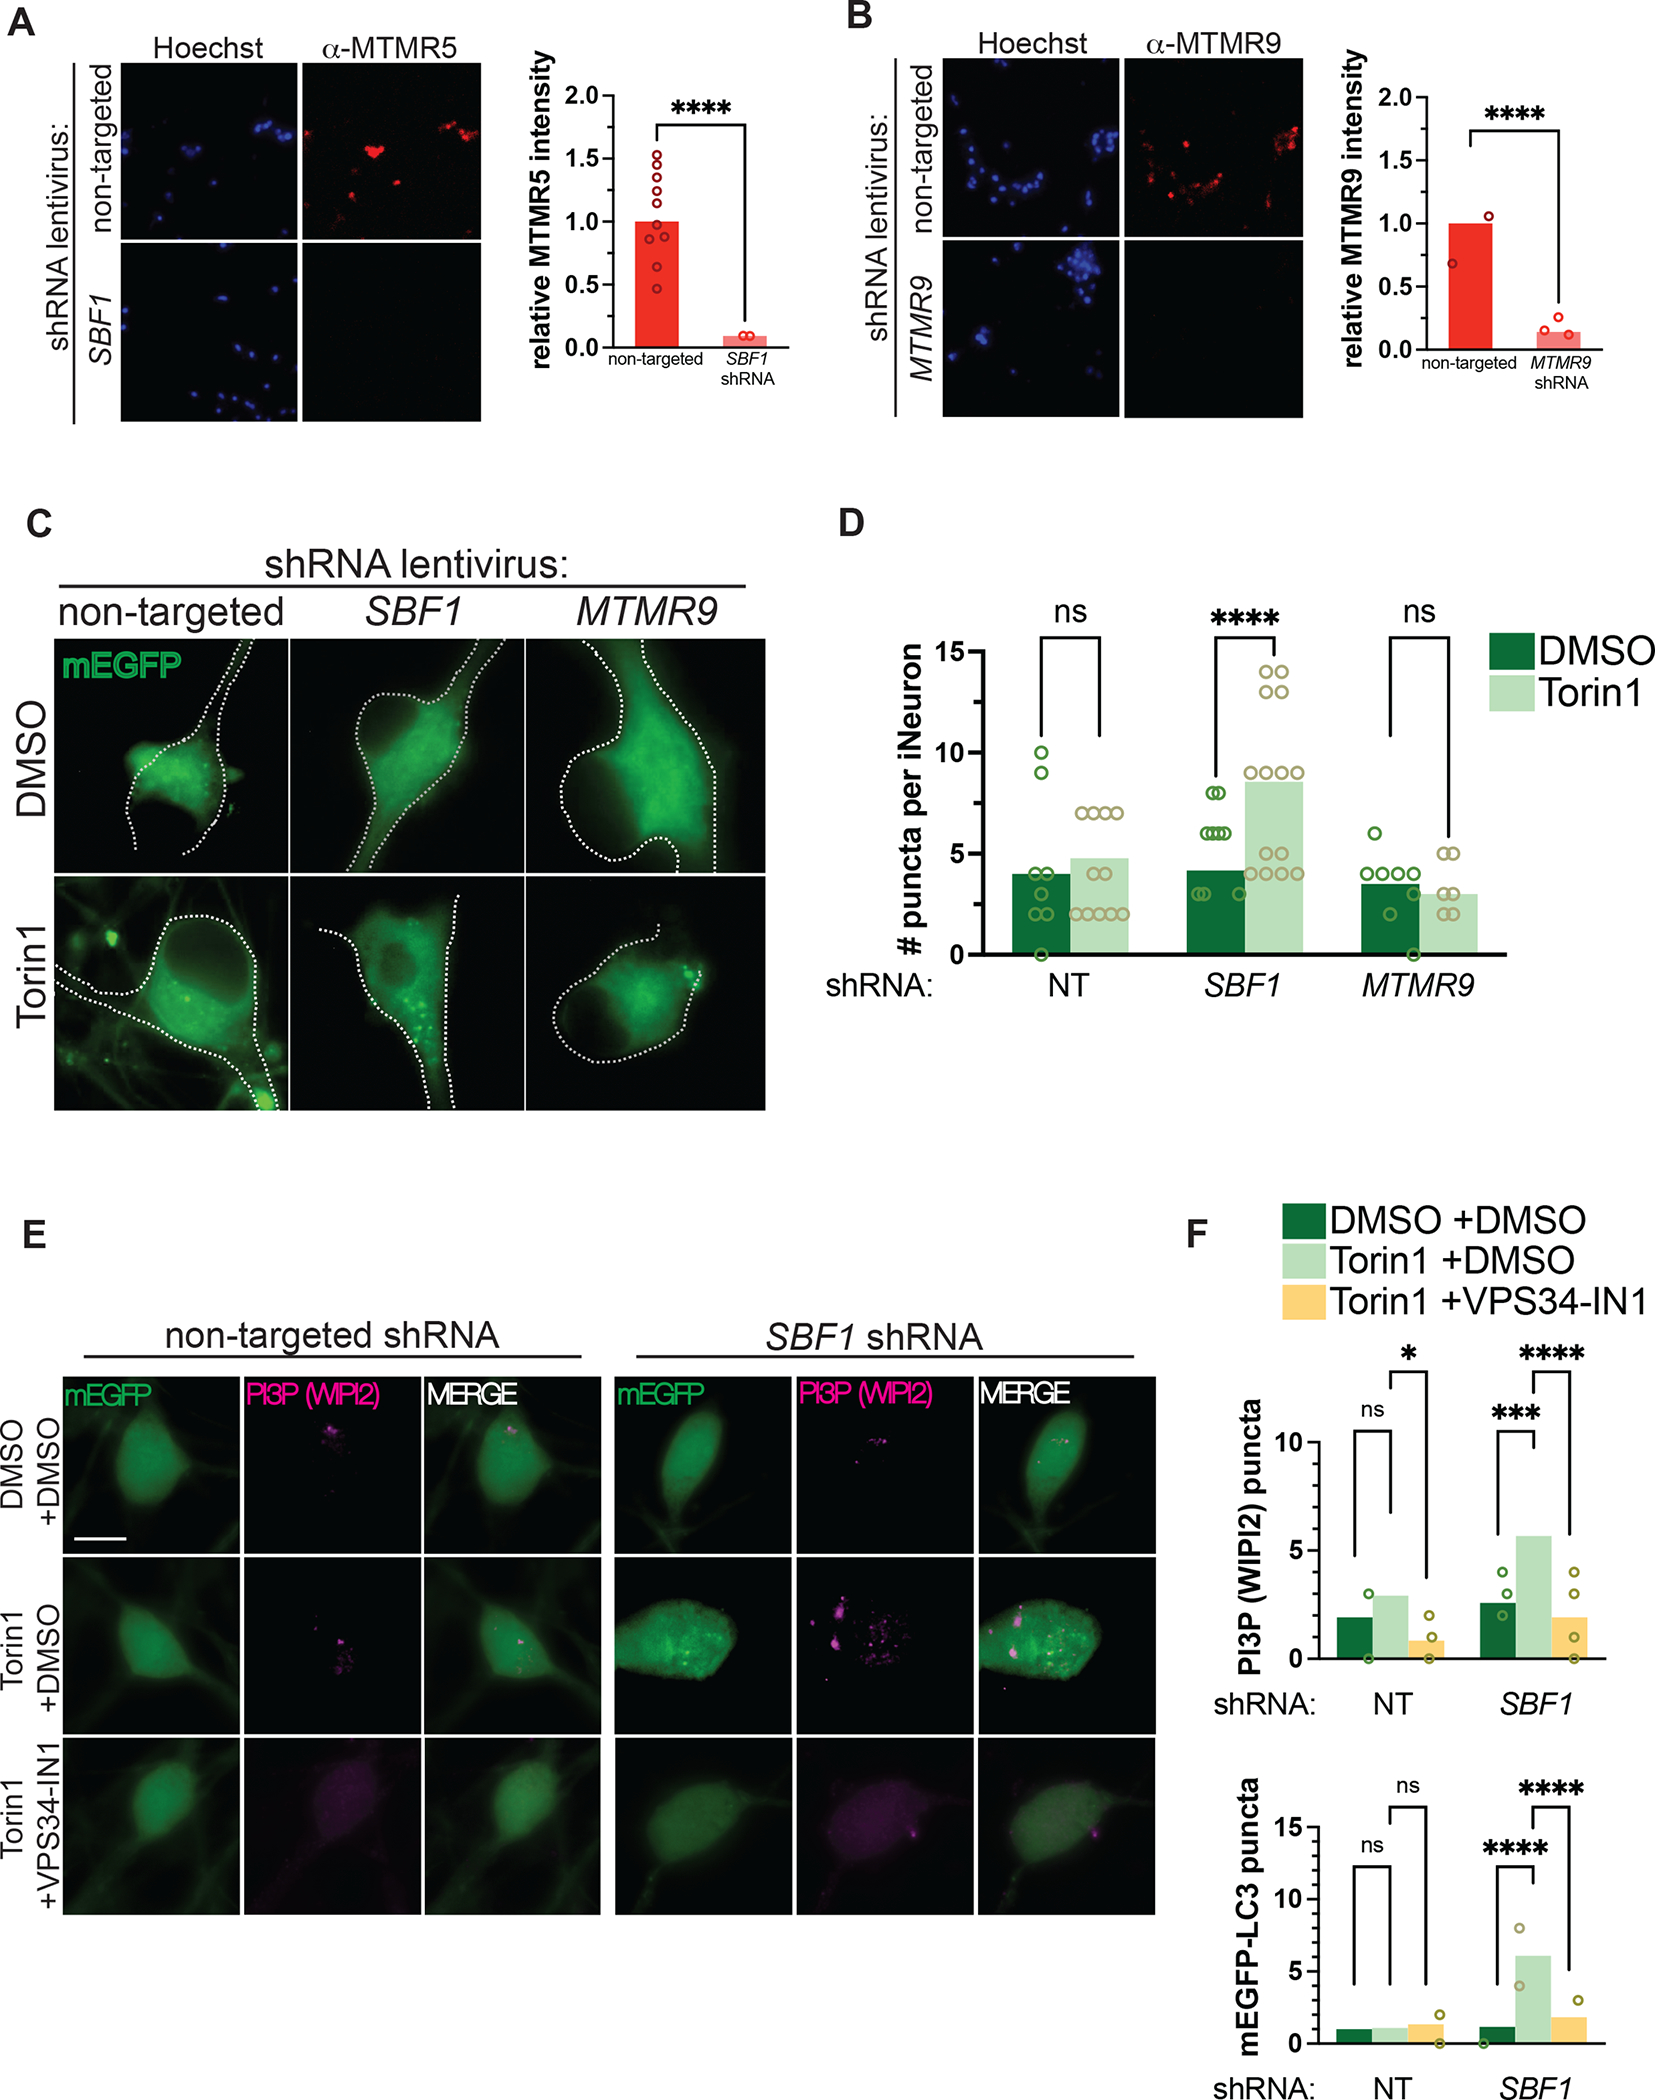
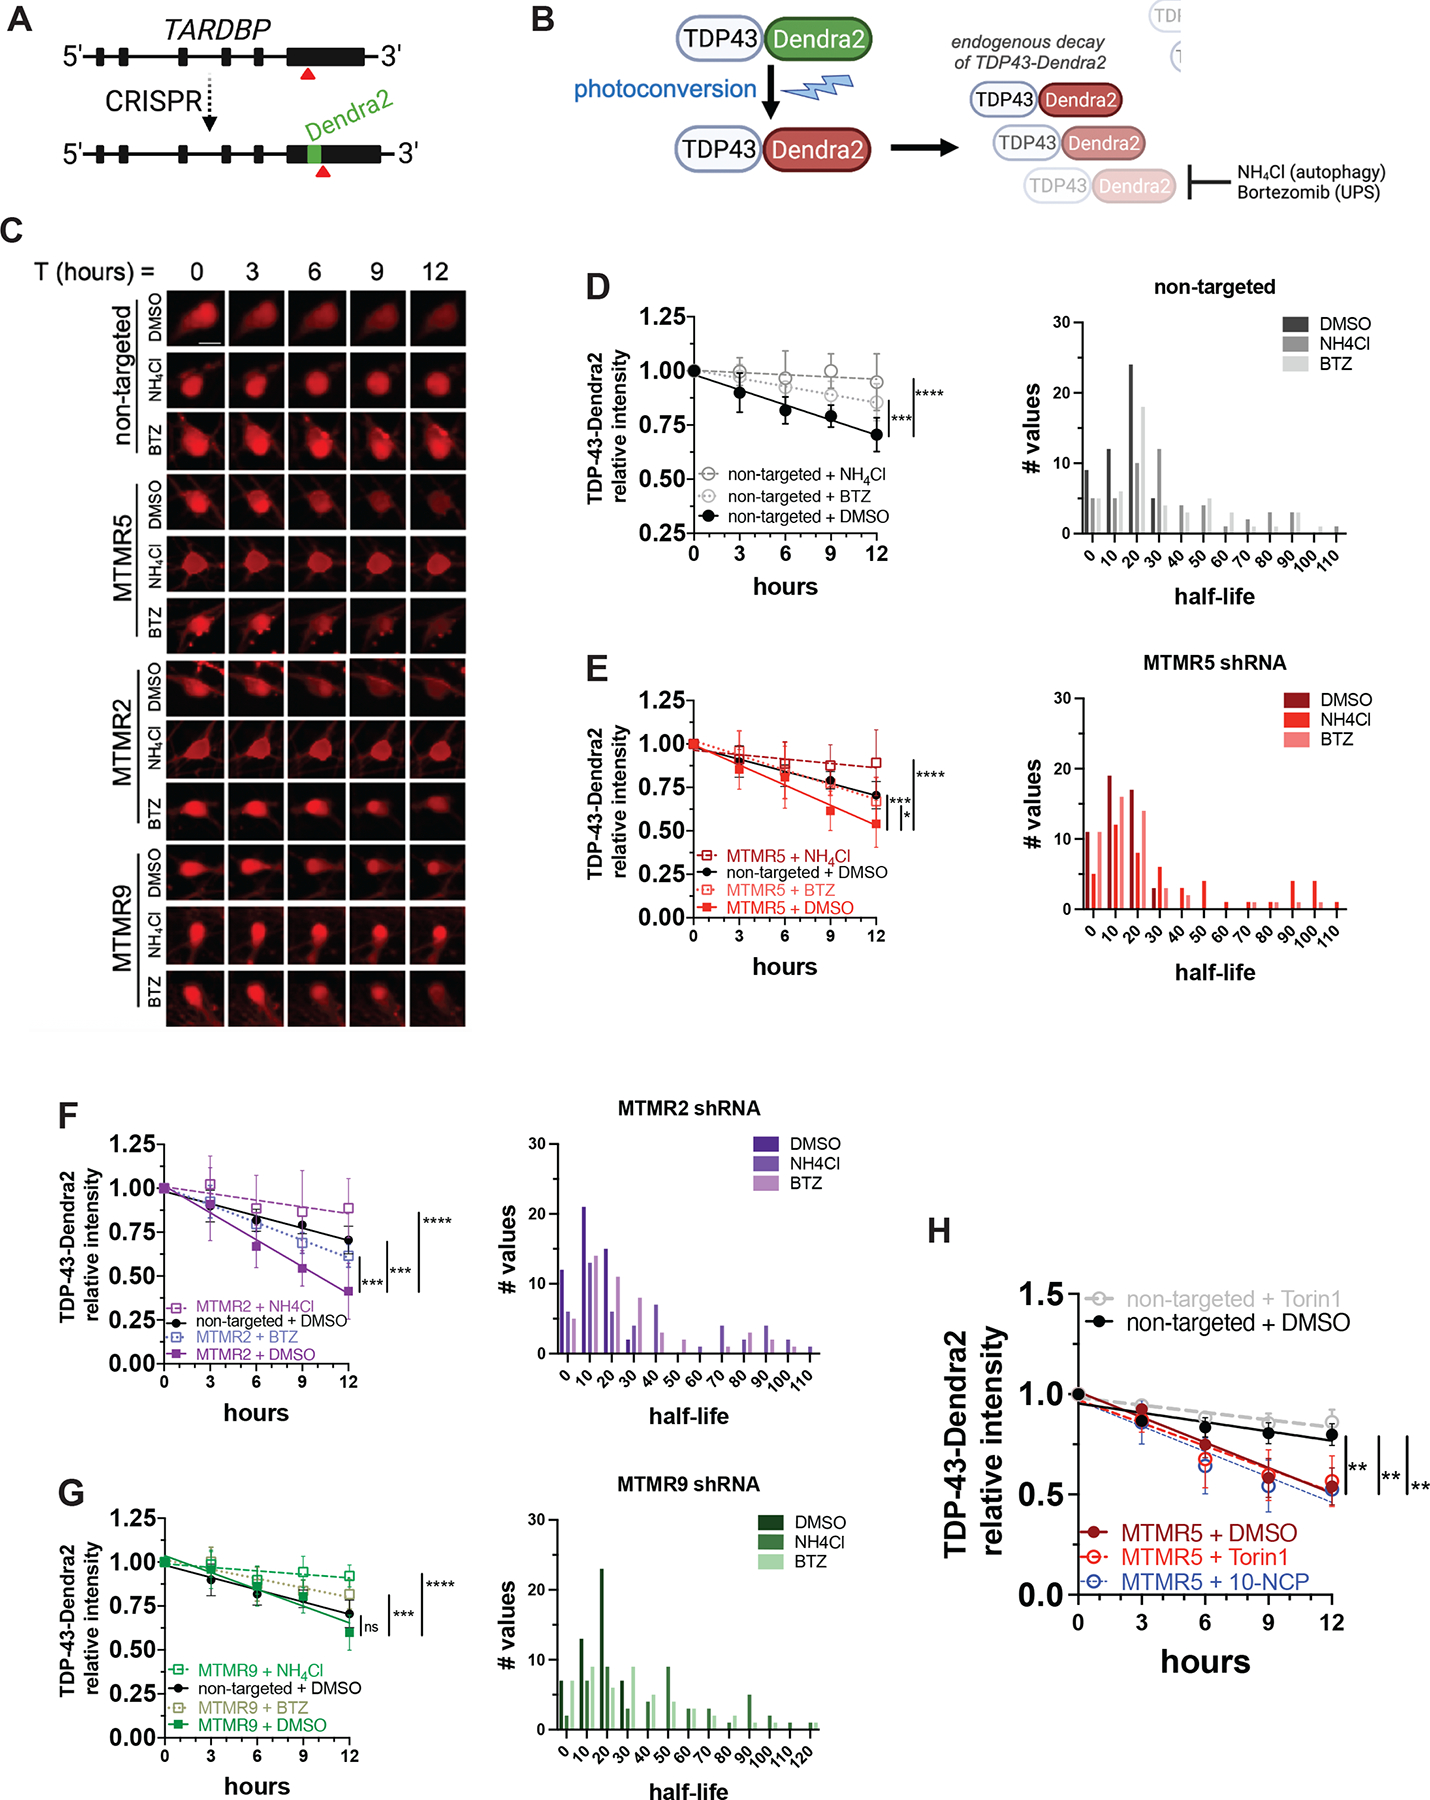
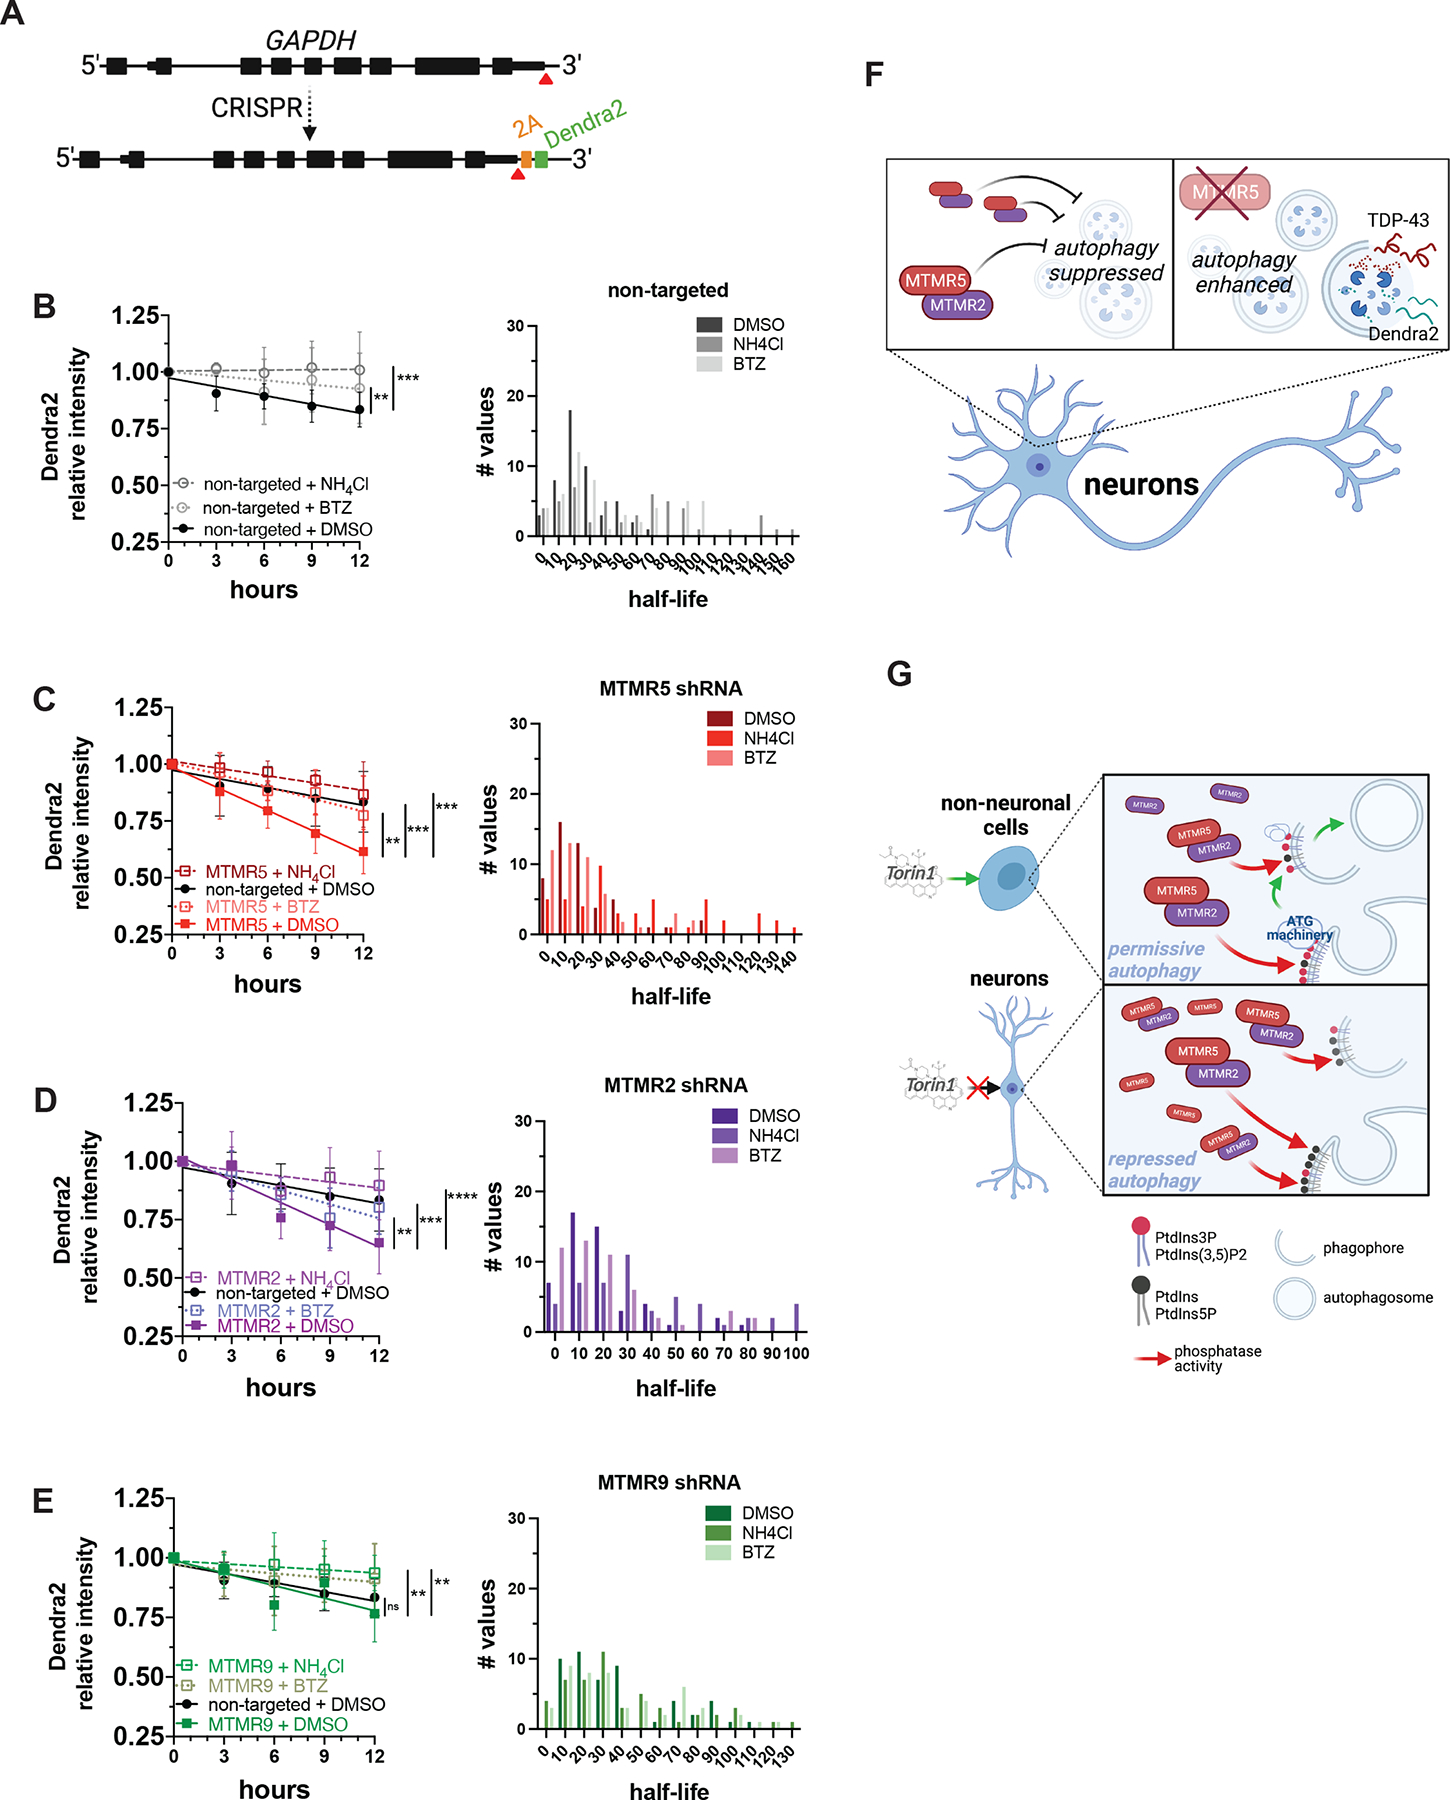
Autophagy is a conserved, multi-step process of capturing proteolytic cargo in autophagosomes for lysosome degradation. The capacity to remove toxic proteins that accumulate in neurodegenerative disorders attests to the disease-modifying potential of the autophagy pathway. However, neurons respond only marginally to conventional methods for inducing autophagy, limiting efforts to develop therapeutic autophagy modulators for neurodegenerative diseases. The determinants underlying poor autophagy induction in neurons and the degree to which neurons and other cell types are differentially sensitive to autophagy stimuli are incompletely defined. Accordingly, we sampled nascent transcript synthesis and stabilities in fibroblasts, induced pluripotent stem cells (iPSCs), and iPSC-derived neurons (iNeurons), thereby uncovering a neuron-specific stability of transcripts encoding myotubularin-related phosphatase 5 (MTMR5). MTMR5 is an autophagy suppressor that acts with its binding partner, MTMR2, to dephosphorylate phosphoinositides critical for autophagy initiation and autophagosome maturation. We found that MTMR5 is necessary and sufficient to suppress autophagy in iNeurons and undifferentiated iPSCs. Using optical pulse labeling to visualize the turnover of endogenously encoded proteins in live cells, we observed that knockdown of MTMR5 or MTMR2, but not the unrelated phosphatase MTMR9, significantly enhances neuronal degradation of TDP-43, an autophagy substrate implicated in several neurodegenerative diseases. Our findings thus establish a regulatory mechanism of autophagy intrinsic to neurons and targetable for clearing disease-related proteins in a cell-type-specific manner. In so doing, our results not only unravel novel aspects of neuronal biology and proteostasis but also elucidate a strategy for modulating neuronal autophagy that could be of high therapeutic potential for multiple neurodegenerative diseases.

Keywords: RNA stability; TDP-43; autophagosome; iPSCs; induced pluripotent stem cells; macroautophagy; myotubularin; neuronal autophagy; optical pulse labeling; phosphoinositide.


Conflict of interest statement

Declaration of interests The authors declare no competing interests.

Figures

Figure 1.
Figure 1.. Neurons are resistant to Torin1-mediated induction of autophagy.
(A) Targeting strategy using CRISPR/Cas9 to knock-in mEGFP immediately 5’ to exon1 in the MAP1LC3B gene. (B) Schematic of the cassette used to integrate NGN1 and NGN2 at the CLYBL safe harbor locus under the control of a Tet-ON system. Puro, puromycin-resistance gene; pA, poly-A tail; P1, P2, promotors; iRFP, near-infrared fluorescent protein; rTTA, reverse tetracycline-controlled transactivator; NGN1 and NGN2, neurogenin-1 and -2; T2A, self-cleaving peptide; TRE, tetracycline response element. (C) Protocols used to differentiate iPSCs into iNeurons using doxycycline-mediated, forced expression of differentiation factors, or into iAstrocytes using dual-SMAD inhibition followed by terminal differentiation by culturing in CNTF. (D) Protocol for differentiating iPSCs into iMuscle using a piggybac/transposase system to integrate doxycycline-inducible MYOD and OCT4 shRNA. (E) Representative 100X images of mEGFP-LC3-positive vesicles in the cell types indicated after treatment with DMSO vehicle or 250nM Torin1 for 4h. Dotted lines indicate cell borders, within which cell area in μm2 was calculated using Fiji. (F) Scatterplots of blinded manual quantifications of mEGFP-LC3-positive vesicles imaged as in (E), normalized to cell area in μm2. Data are from three independent experiments. n.s., not significant; *p<0.05; ****p<0.0001; one-way ANOVA with Šídák’s multiple comparisons test. (G) Density plots of data from (F), which visualize the distribution of quantification data over a continuous interval with kernel smoothing to reduce noise and facilitate visualization of the distribution shape of data and peaks in which data are concentrated. n.s., not significant; ****p<0.0001, two-sample Kolmogorov-Smirnov test. See also Figure S1, Figure S2, Figure S5, and the STAR Methods.
Figure 2.
Figure 2.. RNA expression of autophagy factors in different cell types.
(A) Schematic of Bru-Seq and BruChase-Seq. RNA transcripts from fibroblasts, iPSCs reprogrammed from the fibroblasts, and iNeurons differentiated from the same iPSCs were pulse-labeled with bromouridine with and without chasing with unlabeled uridine, followed by pulldown with anti-bromouridine antibody beads, then subjected to RNA-Seq. (B) Heatmaps of RNA synthesis data from Bru-Seq (left) and RNA stability data from BruChase-Seq (right), plotted for each cell type and natural log (Ln)-normalized to fibroblasts. Fib, fibroblast; iPSC, induced pluripotent stem cell; iN, iNeuron. (C) Bar graph of RNA stability data from BruChase-Seq, Ln-normalized to fibroblasts. SBF1 was among the most stable RNA transcripts. (D) RT-PCR measurements of total steady-state human SBF1 or rat Sbf1 RNA in each cell type indicated. **p<0.01, ****p<0.0001, one-way ANOVA. (E) RT-PCR measurements of human MTMR2 or rat Mtmr2 RNA in the indicated cell types. ns, not significant; *p<0.05; ****p<0.0001, one-way ANOVA. (F) RT-PCR measurements of human TFEB, ATG5, or SQSTM1 RNA in each cell type indicated. ns, not significant; **p<0.01; ****p<0.0001, one-way ANOVA. See also Figure S5.
Figure 3.
Figure 3.. MTMR5 protein is enriched in neurons.
(A) Representative Western analysis of MTMR5, MTMR2, and actin loading control in each of the cell types indicated. Arrowhead, MTMR5, 208kD; asterisk, non-specific band. (B) Band intensity quantifications of MTMR5 and MTMR2 as depicted in (A), normalized to actin band intensity. Data are from three independent experiments. ns, not significant; ***p<0.001; ****p<0.0001, one-way ANOVA. (C) Immunohistochemical staining of MTMR5 in sections of human frontal cortex (i–iv, 10x magnification, scale bar 40μm; v–vi, 20x magnification, scale bar 20μm), and in (D) cerebellum (i–ii, cortex; iii–v deep cerebellar nuclear nuclei, 10x, scale bar 30μ; vi deep cerebellar nuclei, 20x; scale bar 10μm).
Figure 4.
Figure 4.. MTMR5 is sufficient to desensitize iPSCs to Torin1 induction of autophagy.
(A) Schematic of CRISPRA experimental workflow using piggybac/transposase system to express dCas9 fused with VPS64-MS2-p65 transactivators. Cells were treated with 250nM Torin1 or vehicle control for 4h then fixed, stained, and imaged. (B) Representative images of iPSCs transfected with CRISPRA vectors without a targeting sgRNA (top) or with sgRNA targeting the native SBF1 locus, followed by immunocytochemistry staining for MTMR5 to confirm protein overexpression. Cells harboring the piggybac/transposase vectors are indicated by the mCherry expression marker. Scale bar, 15μm. ****p<0.0001, Student’s t test. (C) Representative images of mEGFP-LC3-positive vesicles visualized in mCherry-positive cells after treatment with DMSO vehicle or Torin1. Scale bar, 10μm. (D) Scatterplot of blinded manual quantifications of mEGFP-LC3-positive vesicles imaged as in (C). Data are from three independent experiments. **p<0.01; ****p<0.0001, one-way ANOVA. (E) Density plots of data from (D). ****p<0.0001, two-sample Kolmogorov-Smirnov test.
Figure 5.
Figure 5.. MTMR5 is necessary for suppressing autophagy in neurons.
(A–B) Representative immunocytochemical staining against MTMR5 (A) and MTMR9 (B) in iNeurons transduced with non-targeted shRNA lentivirus (top rows), SBF1 shRNA (bottom left row), or MTMR9 shRNA lentivirus (bottom right row), respectively. (C) Representative images of DIV14 iNeurons transduced with non-targeted, SBF1, or MTMR9 shRNA and treated with DMSO vehicle or 250nM Torin1 for 4h. (D) Scatterplots of blinded manual quantifications of mEGFP-LC3-positive puncta imaged in iNeurons as treated in (C). Data are from 3 independent experiments. ns, not significant; ****p<0.0001, one-way ANOVA. (E) Representative images of mEGFP-LC3 iNeurons, transduced with non-targeted (left panels) or SBF1 shRNA lentivirus (right panels), and treated with or without Torin1 (240nM, 1 hour) and with or without VPS34-IN1 (10μM, 1 hour), a Class III PI3K inhibitor. Cells were fixed and immunostained for WIPI2 to visualize PtdIns3P (PI3P). (F) Quantifications of punctate WIPI2 immunostaining (top panel) or mEGFP-LC3 vesicles (bottom panel). ns, not significant; ****p<0.0001, one-way ANOVA. See also Figure S3 and Figure S4.
Figure 6.
Figure 6.. Knockdown of the MTMR5-MTMR2 axis enhances the proteolytic clearance of TDP-43-Dendra2.
(A) Strategy to label endogenous TDP-43 by inserting Dendra2 immediately upstream of the TARDBP stop codon using CRISPR/Cas9. (B) Schematic of optical pulse labeling (OPL) to photoconvert Dendra2 emission maxima from green to red, followed by tracking red fluorescence decay to monitor TDP-43-Dendra2 degradation, which can be blocked with NH4Cl to inhibit autophagy or bortezomib to inhibit the ubiquitin-proteasome system (UPS). (C) Representative OPL of TDP-43-Dendra2 iNeurons imaged by automated fluorescence microscopy and after treatment with DMSO, NH4Cl, or bortezomib and transduction with the indicated shRNA lentiviruses; scale bar, 10μm. (DG) TDP-43-Dendra2 fluorescence measured in iNeurons after knockdown of each indicated MTMR by transduction with non-targeted (D), SBF1 (E), MTMR2 (F), or MTMR9 (G) shRNA lentivirus and after the indicated drug treatments (left panels), and histogram plot of the half-lives of each measured iNeuron (right panels). Data are represented at each time point as mean ± SD; *p<0.05; ***p<0.001; ****p<0.0001, one-way ANCOVA. (H) TDP-43-Dendra2 fluorescence measured in iNeurons transduced with non-targeted or SBF1 shRNA and after the treatment with DMSO vehicle or autophagy inducing agents Torin1 or 10-NCP. Data are represented at each time point as mean ±SD; **p<0.01, one-way ANCOVA. See also Figure S3 and Figure S6.
Figure 7.
Figure 7.. Knockdown of the MTMR5-MTMR2 axis enhances the proteolytic clearance of Dendra2.
(A) Strategy for inserting Dendra2 at the native GAPDH locus using CRISPR/Cas9. 2A, self-cleaving peptide. (B–E) Dendra2 fluorescence measured in GAPDH-2A-Dendra2 iNeurons after knockdown of each indicated MTMR by transduction with non-targeted (B), SBF1 (C), MTMR2 (D), or MTMR9 (E) shRNA lentivirus and after the indicated drug treatments (left panels), and histogram plot of the half-lives of each measured iNeuron (right panels). Data are represented at each time point as mean ± SD; **p<0.01; ***p<0.001, one-way ANCOVA. (F) Schematic summary of MTMR5 influence on the proteolysis of autophagy substrates. In neurons, autophagy induction is suppressed by native levels of MTMR5 (left), but opposing MTMR5 activity (e.g., through shRNA-mediated knockdown) disinhibits autophagy and accelerates autophagic degradation of substrates, such as TDP-43 and Dendra2 (right). (G) Working model of cell type-specific regulation of autophagy. In non-neuronal cells (left), autophagy operates under permissive conditions due to relatively lower levels of MTMR5, enabling sufficient levels of PtdIns3P to recruit autophagy-related protein complexes (ATG machinery) necessary for autophagosome biogenesis and in response to stimuli (e.g., Torin1). However, in neurons (right), higher levels of MTMR5 impair autophagy induction by potentiating MTMR2, depleting PtdIns3P scaffolds necessary for assembling ATG machinery, and leading to a repressed state of autophagy induction (right panel). See also Figure S6.

Comment in

References

    1. Dugger BN, and Dickson DW (2017). Pathology of Neurodegenerative Diseases. Cold Spring Harbor perspectives in biology 9. - PMC - PubMed
    1. Parzych KR, and Klionsky DJ (2014). An overview of autophagy: morphology, mechanism, and regulation. Antioxidants & redox signaling 20, 460–473. - PMC - PubMed
    1. Laplante M, and Sabatini DM (2009). mTOR signaling at a glance. Journal of Cell Science 122, 3589–3594. - PMC - PubMed
    1. Palamiuc L, Ravi A, and Emerling BM (2020). Phosphoinositides in autophagy: current roles and future insights. Febs j 287, 222–238. - PMC - PubMed
    1. Claude-Taupin A, and Morel E (2021). Phosphoinositides: Functions in autophagy-related stress responses. Biochim Biophys Acta Mol Cell Biol Lipids 1866, 158903. - PubMed

Publication types

MeSH terms

Substances