. 2022 Jun 20;32(12):2621-2631.e3.
doi: 10.1016/j.cub.2022.04.061. Epub 2022 May 16.

The Astrin-SKAP complex reduces friction at the kinetochore-microtubule interface

Affiliations

The Astrin-SKAP complex reduces friction at the kinetochore-microtubule interface

Miquel Rosas-Salvans et al. Curr Biol. .

Abstract

The kinetochore links chromosomes to spindle microtubules to drive chromosome segregation at cell division. While we know nearly all mammalian kinetochore proteins, how these give rise to the strong yet dynamic microtubule attachments required for function remains poorly understood. Here, we focus on the Astrin-SKAP complex, which localizes to bioriented kinetochores and is essential for chromosome segregation but whose mechanical role is unclear. Live imaging reveals that SKAP depletion dampens the movement and decreases the coordination of metaphase sister kinetochores and increases the tension between them. Using laser ablation to isolate kinetochores bound to polymerizing versus depolymerizing microtubules, we show that without SKAP, kinetochores move slower on both polymerizing and depolymerizing microtubules and that more force is needed to rescue microtubules to polymerize. Thus, in contrast to the previously described kinetochore proteins that increase the grip on microtubules under force, Astrin-SKAP reduces the grip, increasing attachment dynamics and force responsiveness and reducing friction. Together, our findings suggest a model where the Astrin-SKAP complex effectively "lubricates" correct, bioriented attachments to help preserve them.

Keywords: Astrin-SKAP; dynamics; force; friction; grip; kinetochore; mammal; mechanics; microtubule; spindle.


Conflict of interest statement

Declaration of interests The authors declare no conflict of interest.

Figures
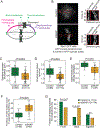
Figure 1.
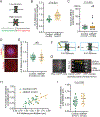
Figure 1.. SKAP increases kinetochore mobility and is essential for sister kinetochore coordination in metaphase.
(A) Simplified representation of metaphase chromosome oscillations. Force from depolymerizing microtubules (purple) at the front kinetochore drives movement of both sisters. Frictional force at the back kinetochore, bound to polymerizing microtubules (pink), opposes movement. (B) Representative live images (left) of a control and siSKAP metaphase Rpe1-GFP cell (GFP-CenpA and centrin1-GFP) with red boxes highlighting regions used for kymographs (right) of centriole and kinetochore movements for those cells. (C) Standard deviation of the position of individual control and siSKAP metaphase kinetochores over time (Mann-Whitney test). (D) Average speed of individual control and siSKAP metaphase kinetochores (Mann-Whitney test). (E) Velocity correlation between metaphase sister kinetochores (Mann-Whitney test). (F) Fraction of time individual metaphase sister kinetochores move in opposite directions (Mann-Whitney test). (G) Fraction of metaphase directional switches in which the front or back kinetochore switches first, or both switch together (Fisher’s exact test) (ns=number of switches). (C-G) from individual kinetochore tracks obtained from the dataset as (B) (n=number of kinetochore pairs, 1–4 kinetochore pairs per analyzed cell from 18 control and 20 siSKAP cells). See also Figure S1, Videos S1-2.
Figure 2.
Figure 2.. SKAP decreases tension at the kinetochore-microtubule interface.
(A) High tension between sister kinetochores leads to a high K-K distance (red double arrow). High tension can stem from high spindles forces, a tighter grip of kinetochores on spindle microtubules, or both. (B) K-K distance average over time for individual kinetochore pairs in control and siSKAP Rpe1-GFP cells from the dataset in Figure 1 (studentś t-test) (n=number of kinetochore pairs, 1–4 kinetochore pairs per analyzed cell from 18 control and 20 siSKAP cells). (C) Time that individual control or siSKAP cells spend from nuclear envelope breakdown (NEB) to anaphase onset (Mann-Whitney test) (n=number of cells). Box and whiskers graph (quartiles including 5–95%) (D) Representative immunofluorescence images in control and siSKAP nocodazolde treated Rpe1-GFP cells (2µM nocodazole, 3 h) stained for CREST (yellow), chromosomes (purple) and tubulin (red). (E) K-K distance for individual sister pairs in control and siSKAP cells treated with nocodazole (Mann-Whitney test) (n=number of kinetochore pairs). (F-G) Laser ablation (yellow X) of k-fiber near a kinetochore releases tension, if present, across a sister pair (schematic cartoon) (F), as shown in representative kymograph images of K-K distance relaxation upon k-fiber ablation (yellow arrowhead) in Rpe1-GFP cells (G). (H-I) K-K distance relaxation (decrease) post-ablation as a function of K-K distance pre-ablation (linear regression lines for each condition) (H) or as a direct comparison (I) (studentś t-test) in control vs siSKAP cells (n=number of ablations, one ablation per cell). See also Figure S2.
Figure 3.
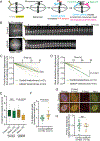
Figure 3.. SKAP decreases kinetochore friction on polymerizing microtubules.
(A) K-fiber ablation assay to isolate kinetochores associated to polymerizing microtubules: laser ablation (yellow X) leads to transient retraction of the kinetochore pair, the creation of new minus-ends leads to the recruitment of dynein (light blue) which pulls on a kinetochore and leads the microtubules attached to its sister to polymerize (pink). (B) Representative time lapse of k-fiber ablation in Rpe1-GFP control and siSKAP cells. White lines mark the kinetochore positions pre-ablation at the top, red lines represent the movement of sister kinetochores. (C) Individual tracks from control and siSKAP front kinetochores moving post-ablation, showing kinetochore displacement from its switching position after dynein pulling (time=0 corresponds to the timepoint of switch to poleward movement), with linear regression fits (straight lines) (analysis of covariance test, ANCOVA). (D) Individual tracks from control and siSKAP back kinetochores moving post-ablation, showing kinetochore displacement from its switching position after dynein pulling (time=0 corresponds to the timepoint of switch to away from the pole movement), with linear regression fits (straight lines) (analysis of covariance test, ANCOVA). (E) Front (lined boxes) and back (clear boxes) kinetochore speed distribution post-ablation in control and siSKAP kinetochores (studentś t-test) from data in (C) and (D). (F) K-K distance at the time the back kinetochore switched to away-from-pole movement post-ablation in control and siSKAP kinetochore pairs (Mann-Whitney test). In (C-F), n=number of ablations, one ablation per cell. (G) Representative immunofluorescence images of Rpe1-GFP control and siSKAP cells stained for Hec1-S69 phosphorylation (red), tubulin (blue) and Hec1 (yellow). (H) p-Hec1-S69 kinetochore intensity relative to Hec1 kinetochore intensity in control and siSKAP cells (studentś t-test; n=number of cells). See also Figure S3, Videos S3-4.
Figure 4.
Figure 4.. SKAP increases k-fiber depolymerization velocity and kinetochore force-responsiveness.
(A) Kinetochore ablation assay to isolate kinetochores associated to depolymerizing microtubules: laser ablation (yellow X) of one sister leads to the other sister moving poleward as its microtubules depolymerize (purple), and to later move away-from-the pole as polar ejection forces (green arrowheads) increase and microtubules rescue and polymerize (pink). (B) Representative time lapse images of kinetochore ablation (yellow arrow) in control (top) and siSKAP (bottom) Rpe1-GFP cells, with remaining sister kinetochore (white arrow) and centrioles (red arrows) marked, and kinetochore directional switch marked (purple arrow). (C) Distance to position at ablation as a function of time for individual kinetochores post-ablation (t=0 corresponds to the first timepoint post-ablation) in control and siSKAP cells, with linear regression fits (straight lines) (analysis of covariance test, ANCOVA). (D) Average speed of individual kinetochores post sister ablation in control and siSKAP cells (Mann-Whitney test). (E) Kinetochore distance from the spindle pole of individual control and siSKAP cells at the time of direction switch from poleward to away-from-pole movement (rescue) post-ablation (studentś t-test), with a smaller distance typically reflecting a higher force at rescue. In (C-E), n=number of ablations, one ablation per cell. See also Figure S4, Videos S5-6.
Figure 5.
Figure 5.. Models for the Astrin-SKAP complex decreasing friction at the mammalian kinetochore-microtubule interface.
Representation of the kinetochore-microtubule interface in the absence (left) and presence (right) of SKAP. Two models for how Astrin-SKAP (yellow) could increase friction at the kinetochore-microtubule interface (right). In Model A (top right), SKAP affects how Ndc80 (black) or Ndc80-Ska (purple) complexes bind microtubules (dashed black and purple), decreasing their friction on microtubules and indirectly reducing attachment friction and increasing dynamics. In Model B (bottom right), SKAP directly binds microtubules, with Ndc80-SKAP and Ndc80-Ska competing for microtubule binding with similar affinities (binding energy) but with Ndc80-SKAP moving on microtubules with lower friction (lower transition state energy in moving between lattice binding sites). In both models, the more SKAP molecules are at the kinetochore, the lower the friction at the kinetochore-microtubule interface and the higher the sensitivity to force (center).

Comment in

Similar articles

Cited by

References

    1. Wendell KL, Wilson L, and Jordan MA (1993). Mitotic block in HeLa cells by vinblastine: Ultrastructural changes in kinetochore-mcirotubule attachment and in centrosomes. J. Cell Sci 104, 261–274. - PubMed
    1. McEwen BF, Heagle AB, Cassels GO, Buttle KF, and Rieder CL (1997). Kinetochore fiber maturation in PtK1 cells and its implications for the mechanisms of chromosome congression and anaphase onset. J. Cell Biol 137, 1567–1580. - PMC - PubMed
    1. Khodjakov A, and Rieder CL (1996). Kinetochores moving away from their associated pole do not exert a significant pushing force on the chromosome. J. Cell Biol 135, 315–327. - PMC - PubMed
    1. Grishchuk EL, and McIntosh JR (2006). Microtubule depolymerization can drive poleward chromosome motion in fission yeast. EMBO J 25, 4888–4896. - PMC - PubMed
    1. Joglekar AP, Bloom KS, and Salmon ED (2010). Mechanisms of force generation by end-on kinetochore-microtubule attachments. Curr. Opin. Cell Biol 22, 57–67. - PMC - PubMed

Publication types