. 2022 Jun;606(7916):1027-1031.
doi: 10.1038/s41586-022-04857-0. Epub 2022 May 17.

Structural insights into the HBV receptor and bile acid transporter NTCP

Affiliations

Structural insights into the HBV receptor and bile acid transporter NTCP

Jae-Hyun Park et al. Nature. 2022 Jun.

Abstract

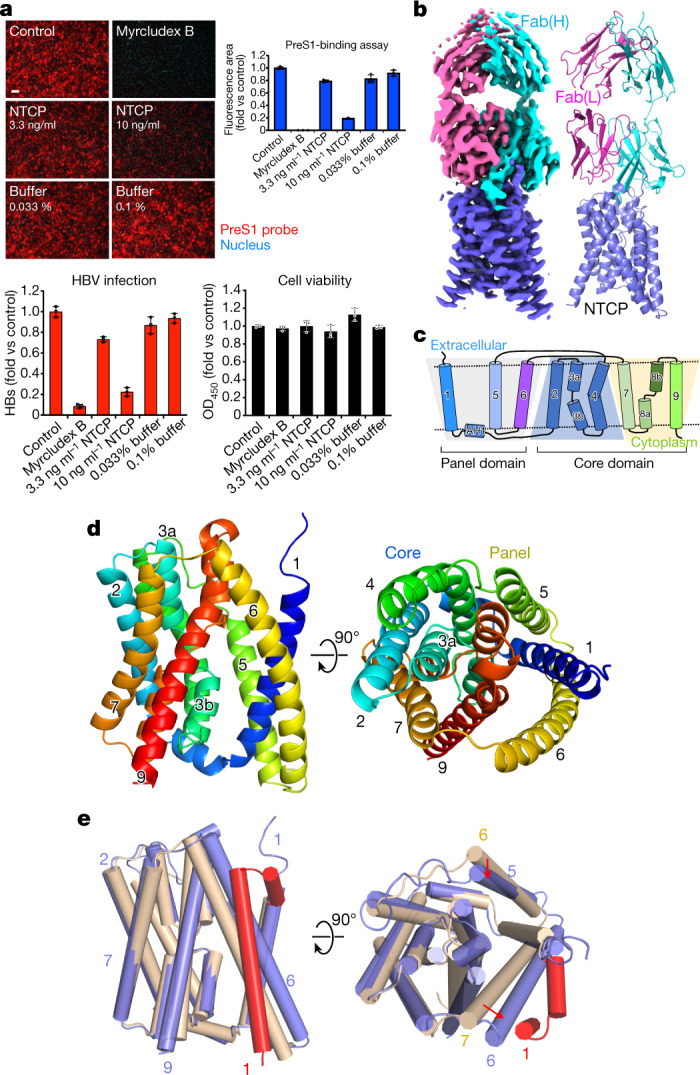
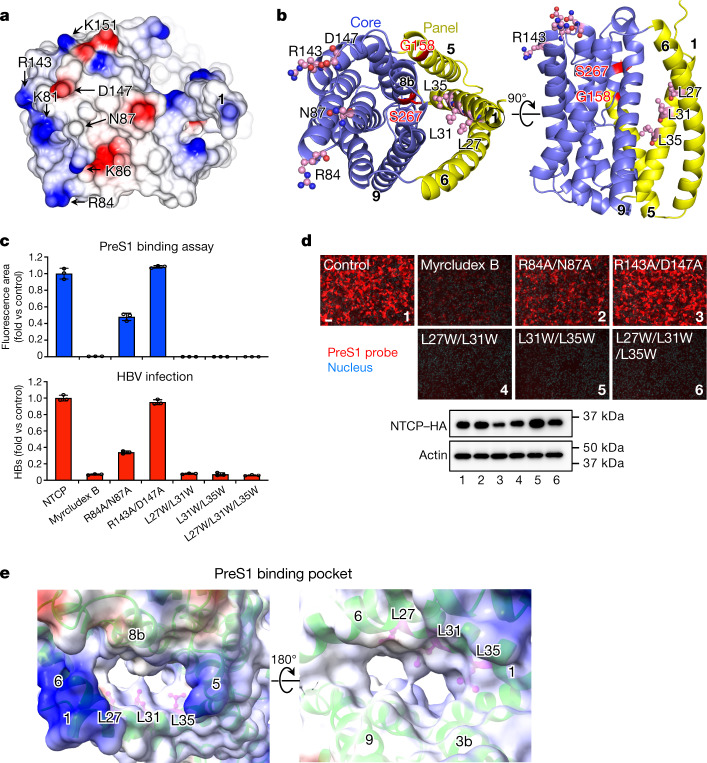
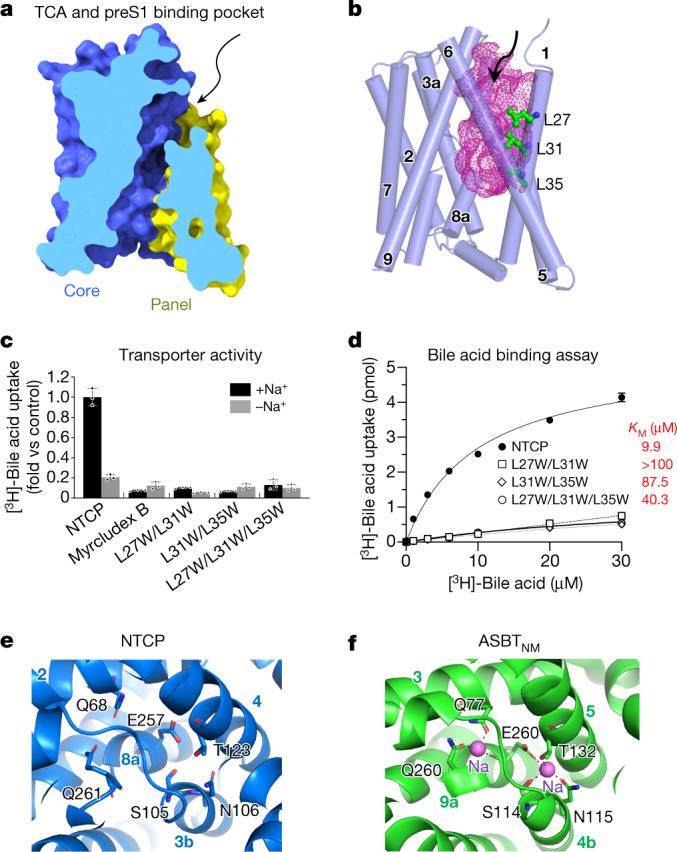
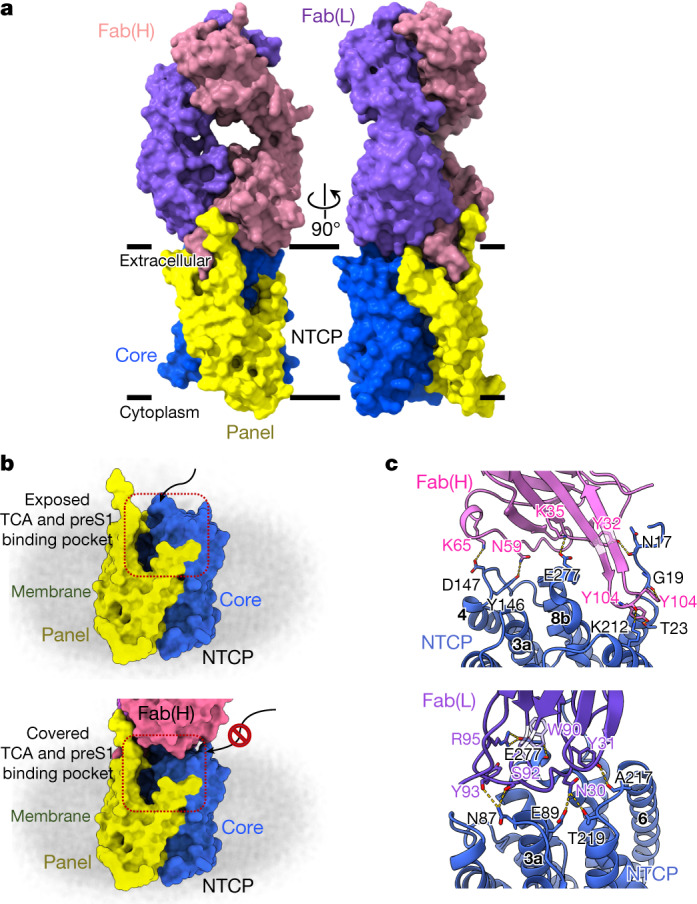
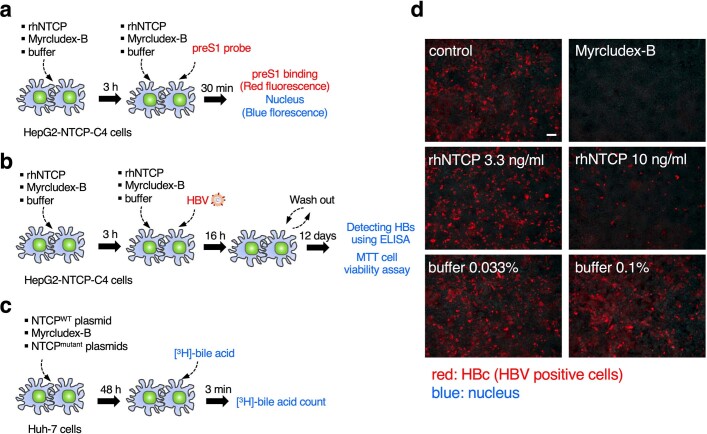
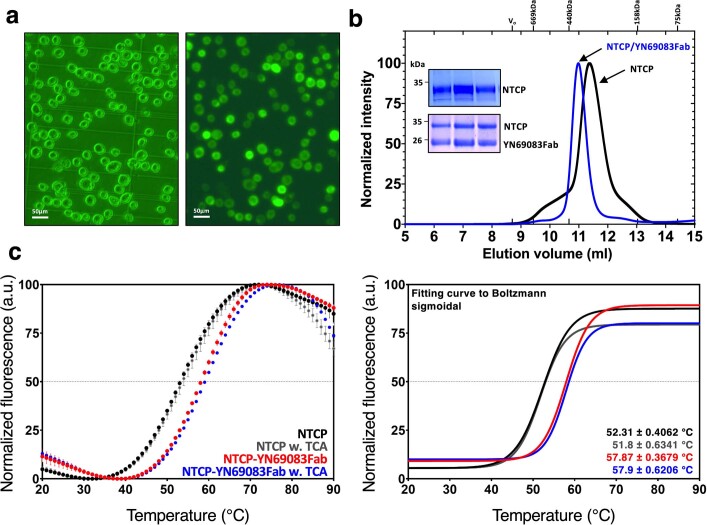
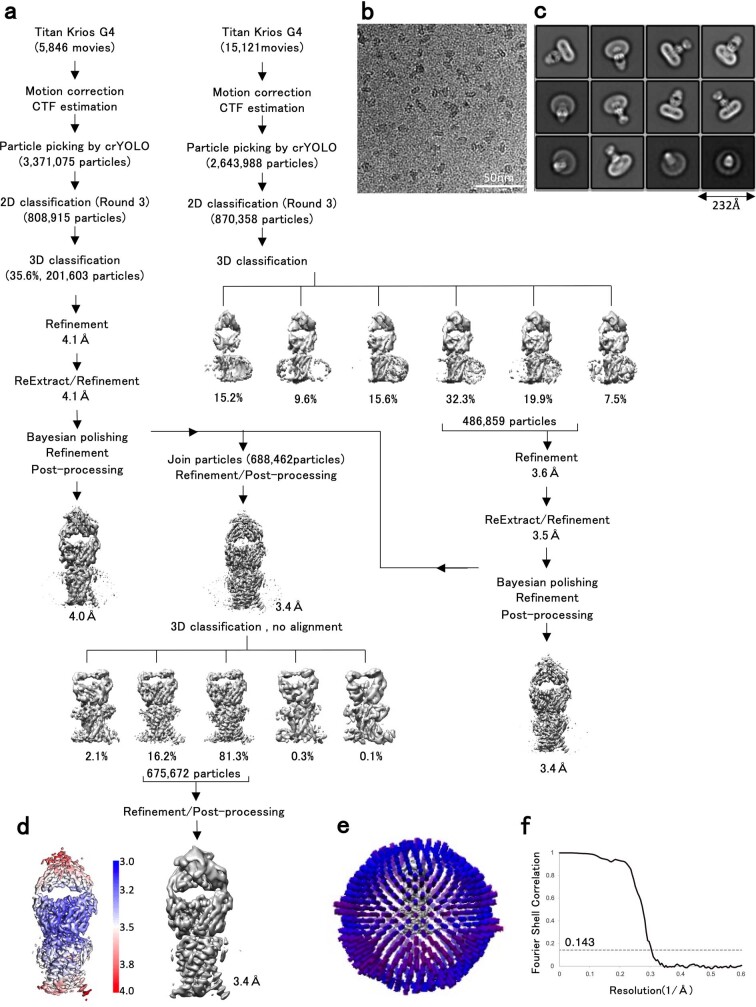
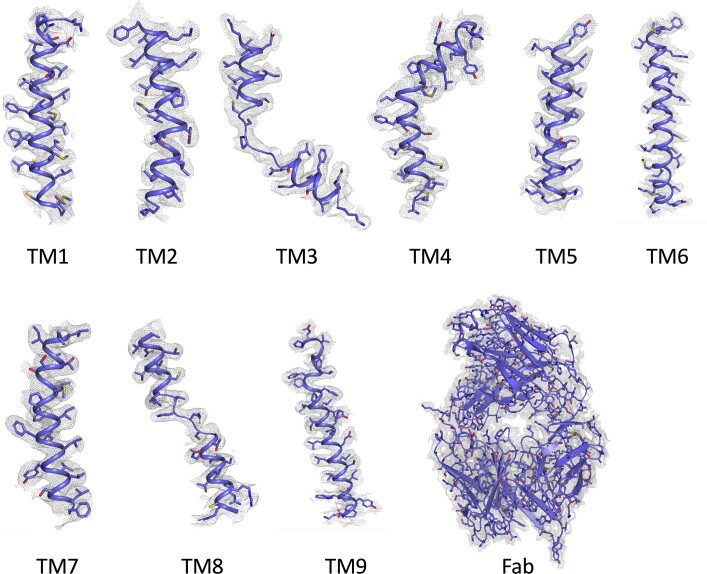
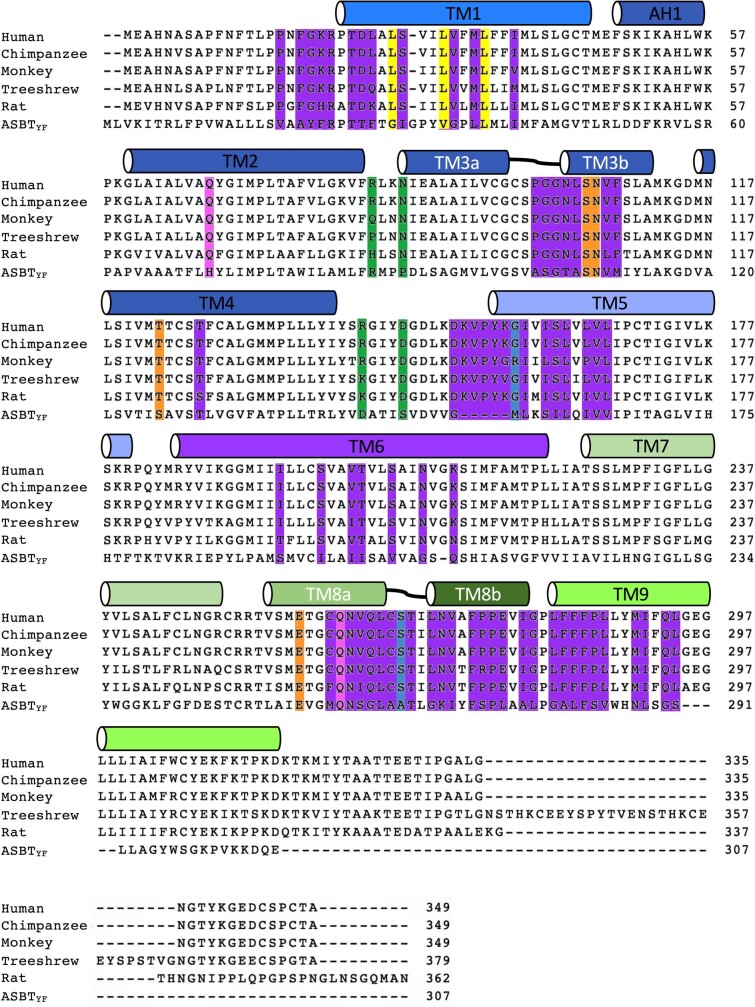
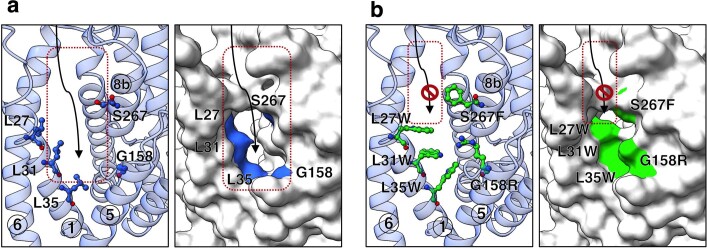
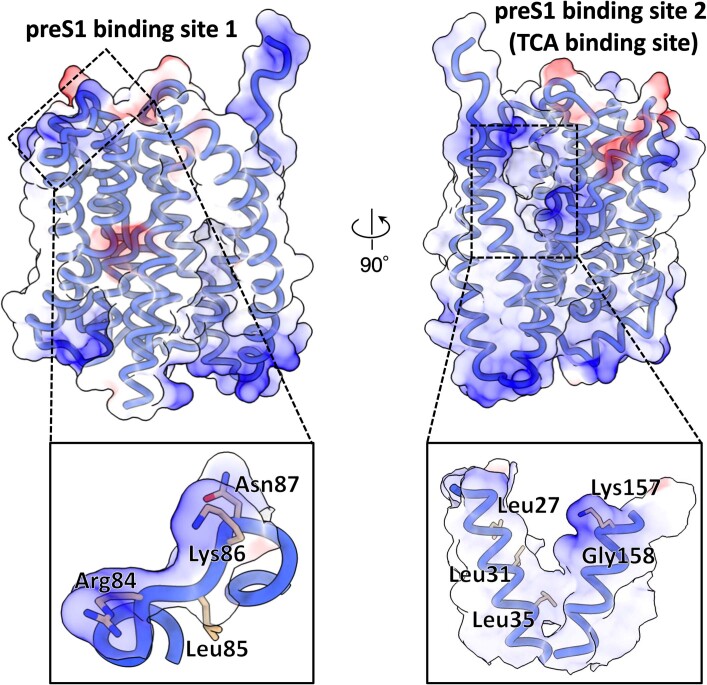
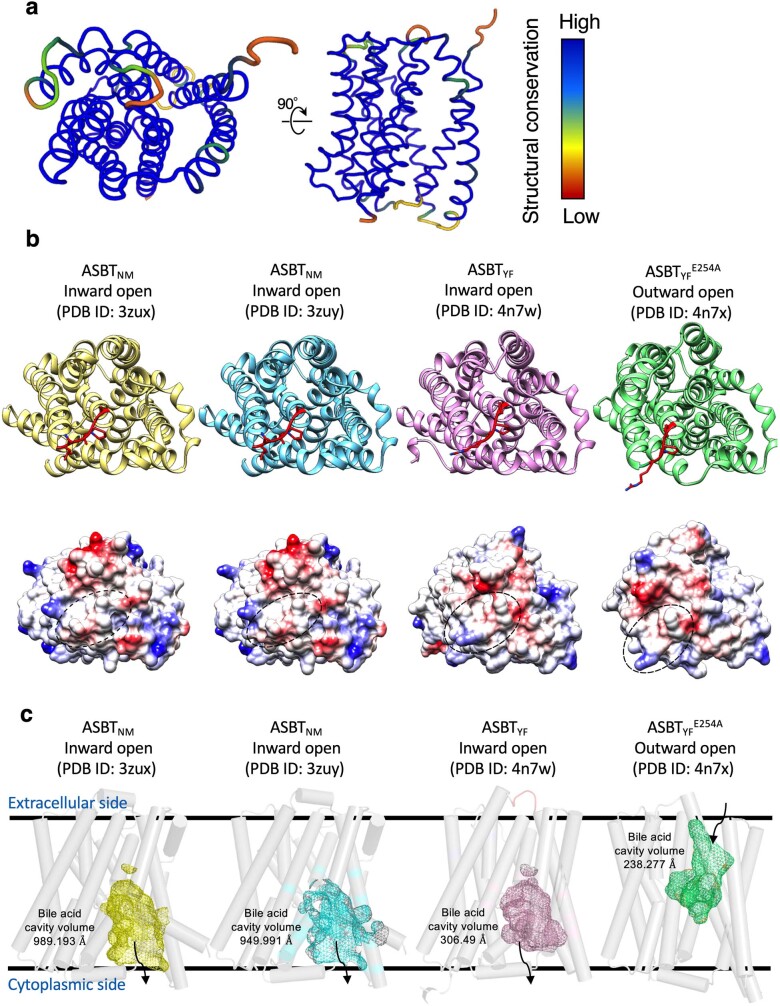
Around 250 million people are infected with hepatitis B virus (HBV) worldwide1, and 15 million may also carry the satellite virus hepatitis D virus (HDV), which confers even greater risk of severe liver disease2. The HBV receptor has been identified as sodium taurocholate co-transporting polypeptide (NTCP), which interacts directly with the first 48 amino acid residues of the N-myristoylated N-terminal preS1 domain of the viral large protein3. Despite the pressing need for therapeutic agents to counter HBV, the structure of NTCP remains unsolved. This 349-residue protein is closely related to human apical sodium-dependent bile acid transporter (ASBT), another member of the solute carrier family SLC10. Crystal structures have been reported of similar bile acid transporters from bacteria4,5, and these models are believed to resemble closely both NTCP and ASBT. Here we have used cryo-electron microscopy to solve the structure of NTCP bound to an antibody, clearly showing that the transporter has no equivalent of the first transmembrane helix found in other SLC10 proteins, and that the N terminus is exposed on the extracellular face. Comparison of our structure with those of related proteins indicates a common mechanism of bile acid transport, but the NTCP structure displays an additional pocket formed by residues that are known to interact with preS1, presenting new opportunities for structure-based drug design.


Conflict of interest statement

The authors declare no competing interests.

Figures

Fig. 1
Fig. 1. Function and cryo-EM structure of NTCP as HBV receptor.
a, Functional activity assays of rhNTCP. HBV preS1 attachment and HBV infection were evaluated in HepG2 cells expressing rhNTCP by treating the cells with a preS1 probe or HBV in the presence of 3.3 or 10 ng ml rhNTCP, or 500 nM myrcludex B. Percentages indicated the concentration of DDM in the buffer. Cell viability was measured by MTT assay. Data are mean ± s.d. of three independent samples. Scale bar, 100 µm. HBs, HBV surface protein. b, Cryo-EM map contoured with a threshold of 0.020 (left) and ribbon representation (right) of the human NTCP–Fab complex structure. The light and heavy chains of Fab YN69083 are shown in pink and cyan, respectively; NTCP is shown in blue. c, Transmembrane topology diagram of NTCP. The transmembrane helices are grouped by functional domain. Shaded trapezoid regions indicate pseudo-symmetrical regions of the protein. Black dashed lines indicate the position of the membrane bilayer. d, Two orthogonal views of NTCP shown as a Cα ribbon, with helices numbered from the N terminus. Left, the external face is shown at the top. Right, the protein is viewed from outside the cell. e, Comparison of NTCP with the bacterial homologue Y. frederiksenii ASBT. NTCP (blue) is superimposed on Y. frederiksenii ASBT (wheat) (PDB 4N7X), viewed from two perpendicular directions. The additional N-terminal helix of Y. frederiksenii ASBT, which has no equivalent in NTCP, is highlighted in red.
Fig. 2
Fig. 2. Binding sites for HBV preS1 in human NTCP and mapping of key residues that maintain functionality of NTCP as HBV receptor.
a, Surface representation of the extracellular face of NTCP, coloured by electrostatic potential. Residues involved in preS1 attachment are labelled. b, Ribbon diagrams showing the core (blue) and panel (yellow) domains of NTCP. Left, NTCP is shown in the same orientation as in a. The orthogonal view (right) shows the external face at the top. Key residues mutated in this study are shown as ball-and-stick models, coloured by element. G158 and S267 are highlighted in red. c, HBV preS1 attachment (from images represented in d) and HBV infection were examined using wild-type or mutant NTCP-expressing Huh7 and HepG2 cells, respectively. Myrcludex B (500 nM) was used as a control to inhibit NTCP-mediated HBV preS1 attachment and HBV infection. Data are mean ± s.d. of three independent samples. d, Top, fluorescence images of the preS1-mediated HBV attachment assay in Huh7 cells expressing NTCP, showing the effect of NTCP mutations. Bottom, the expression level of NTCPs was monitored by Western blot. Lanes are numbered according to the corresponding images. NTCP and actin (loading control) were run on different gels. Scale bar, 100 µm. e, Electrostatic surface potential of the preS1-binding pocket of NTCP. Left, view from the cytoplasmic side. Right, view from the external side. Numbers in circles indicate the transmembrane helices lining the pocket. Leu27, Leu31 and Leu35 are shown as ball-and-stick models in pink. In a,e, Surfaces with positive and negative charges are coloured in blue and red, respectively, and electrically neutral surfaces are coloured in white.
Fig. 3
Fig. 3. TCA-binding cavity and mutagenesis analysis.
a, Vertical slice through a surface representation of NTCP, showing the TCA- and preS1-binding pocket or tunnel. The panel and core domains are coloured blue and yellow, respectively. The arrow indicates the external opening of the pocket. b, The TCA- and preS1-binding pocket is shown as a pink mesh within the structure of NTCP, which is shown as cylinders, representing helices. Residues Leu27, Leu31 and Leu35 lining the cavity are shown as ball-and-stick models. c, Bile acid uptake was measured in Huh7 cells expressing the wild-type NTCP or NTCP mutants, in either sodium-free or sodium-containing buffer at 37 °C for 3 min. The buffer composition is provided in Methods. Myrcludex B-treated wild-type NTCP was used as a control. Mutation of Leu27, Leu31 and Leu35 to Trp blocks TCA transport. Data are mean ± s.d. of three independent samples. d, Transport activity in the presence of different concentrations of substrate were used to calculate Michaelis constant (KM) values by non-linear regression. Data are mean ± s.d. of three independent samples. e, Putative sodium ion-binding sites in NTCP. Conserved residues near the crossover are labelled. Helices are labelled with circled numbers. f, Sodium ion-binding sites in the previously reported model of N. meningitidis ASBT. Sodium ions are shown as spheres.
Fig. 4
Fig. 4. Structural basis of NTCP recognition by Fab YN69083.
a, Orthogonal views of the NTCP–Fab YN69083 complex shown as molecular surfaces, separately coloured, of each Fab chain and NTCP domain. The intimate contact between the heavy chain and the panel domain is apparent. b, Blocking the TCA- and preS1-binding pocket by Fab YN69083. Top, NTCP alone, with the TCA- and preS1-binding pocket exposed on the extracellular face. Bottom, the Fab complex completely occludes the binding pocket, blocking entry of ligands from outside the cell. c, Details of the interaction between NTCP and Fab YN69083. Residues forming contacts are shown as stick models and labelled. Blue, NTCP; pink, Fab YN69083 heavy chain; purple, Fab YN69083 light chain. Intermolecular hydrogen bonds are shown as dashed yellow lines.
Extended Data Fig. 1
Extended Data Fig. 1. Scheme of assays and fluorescence images of HBV infection assay for recombinant human NTCP (rhNTCP).
a, Scheme of HBV infection and MTT cell viability assay for rhNTCP. Free rhNTCP competes for ligands with NTCP expressed on the surface of HepG2-NTCP-C4 cells, so that if more free rhNTCP is added, the HBV infection rate of the cells falls. Myrcludex-B, an inhibitor of HBV infection, was used as a positive control. MTT assay was also performed with the same scheme of HBV assay to determine whether additives such as rhNTCP or Myrcludex-B affect HepG2-NTCP-C4 cell viability. b, Scheme of HBV preS1 attachment assay for rhNTCP. HepG2-NTCP-C4 cells to which preS1 is attached show red fluorescence by the TARMA-preS1 probe, and HepG2-NTCP-C4 cells to which preS1 is not attached show blue fluorescence around the nucleus. Less preS1 attaches to HepG2-NTCP-C4 cells as more rhNTCP is added. c, Scheme of bile acid uptake assay for NTCP. Bile acid uptake was measured in Huh7 cells transfected with the expression plasmid for the wild-type or mutant NTCP. Myrcludex-B was used as a positive control. d, Fluorescence images of HBV infection assay in HepG2-hNTCP-C4 cells. It was confirmed that the HBV infection of HepG2-NTCP-C4 cells decreased as more rhNTCP was added. Fluorescent signals for HBc protein were observed with a fluorescence microscope (BZ-X710, KEYENCE). The micrographs shown were obtained in one of three duplicate experiments, which together with the result of Fig. 1a, support the conclusion that rhNTCP inhibits HBV infection. The scale bar in the control image is 100 µm long.
Extended Data Fig. 2
Extended Data Fig. 2. Expression, purification, and biochemical characterization of NTCP and complex with Fab(YN69083).
a, Phase contrast (left) and fluorescence microscopy image (right) of Sf9 cells expressing NTCP-GFP. Fluorescence indicates level of NTCP-GFP expression. Similar results were obtained in five separate experiments. b, Representative size-exclusion chromatography profile of NTCP (black line) and complex with Fab (blue line). Inset shows SDS–PAGE gel of NTCP and complex with Fab used for cryo-EM grid preparation. SDS-PAGE gels were visualized by Coomassie-blue staining. c, DSF thermal stability assay of NTCP, and NTCP-Fab complex with or without 50 µM TCA. Raw data were plotted with error bars indicating the standard deviations of double samples (left). The T m values were calculated as a graph fitted to the Boltzmann sigmodal equation (right). Binding of one Fab fragment to NTCP show a strong antibody dependent stabilisation of NTCP, raising the melting point from 52.3 ± 0.4 °C to 57.9 ± 0.4 °C.
Extended Data Fig. 3
Extended Data Fig. 3. Flow chart of cryo-EM data processing for NTCP-Fab complex.
a, Schematic flow chart of the classification and refinement procedures to resolve the NTCP-Fab complex structure. b, Representative raw micrograph of NTCP-Fab complex. c, Gallery of two-dimensional class averages, with a window size of 232 Å. d, Final three-dimensional density map coloured by local resolution of the NTCP-Fab complex. e, Euler angle distribution of all particles included in the calculation of the final three-dimensional reconstruction. f, Fourier shell correlation curve of the globally refined NTCP-Fab complex after the post-processing with RELION. The red line intercepts the y axis at a FSC value of 0.143.
Extended Data Fig. 4
Extended Data Fig. 4. Atomic model and cryo-EM density map of the NTCP–Fab complex.
The overall structure of the Fab (bottom right) and magnified views of separate transmembrane helices of NTCP (top and bottom left). The cryo-EM density is shown as a grey mesh with a threshold of 0.020.
Extended Data Fig. 5
Extended Data Fig. 5. Sequence alignment of the NTCP through the species.
Sequence alignment of NTCP of Human, Chimpanzee, Monkey, Treeshrew, Rat and bacterial ASBT, calculated with CLUSTALW. The bars mark the locations of helices in NTCP, and are coloured as in Fig. 1c. Putative residues interacting with Na-1 and Na-2 are highlighted with orange and pink, respectively. Residues forming the TCA / preS1 binding pocket are highlighted in purple. G158 and S267 are highlighted in blue; these residues affect the species specificity of HBV infection among great apes and Old-World monkeys. Other residues known to control species specificity are highlighted in green. Key residues important for TCA and preS1 binding, and NTCP function, are highlighted in yellow.
Extended Data Fig. 6
Extended Data Fig. 6. Conformational changes in TCA / preS1 binding pocket according to mutations of key residues that composite pocket.
a, Cartoon (left) and surface representation (right) of TCA / preS1 binding pocket of wild-type NTCP. Key residues are highlighted as ball-and-stick models and shown in blue. b, Cartoon (left) and surface representation (right) of TCA / preS1 binding pocket of quintuple mutant NTCP. The key residues are highlighted in green. Comparison of the binding pocket region of wild-type and quintuple mutant of NTCP. Three leucine residues located in the pathway of TCA transport and G158/S267 residues mentioned in previous studies were selected for mutagenesis. The quintuple mutant structure was obtained by homology modeling (SWISS-MODEL) using the wild-type NTCP structure.
Extended Data Fig. 7
Extended Data Fig. 7. The putative binding sites of preS1 and TCA.
The putative binding site of preS1 or TCA are highlighted with dashed boxes. Detailed residues are presented in enlarged boxes below. Surfaces with positive and negative charges are coloured blue and red, respectively, and electrically neutral surfaces are coloured white.
Extended Data Fig. 8
Extended Data Fig. 8. Structural comparison of NTCP with bacterial ASBT homologues.
a, Structural conservation of NTCP compared with the bacterial ASBT homologues from Neisseria meningitidis (ASBTNM, PDB ID:3zux, 3zuy) and Yersinia frederiksenii (ASBTYF, PDB ID:4n7w, 4n7x). Conservation profiles were generated using the Dali web server. b, Cartoon (top) and surface charge (bottom) representations of bacterial ASBT homologues in top view. Residues of bacterial ASBT homologues corresponding to 84-87 residues of NTCP were represented by stick model and highlighted as red. In surface charge representations, the regions corresponding to 84-87 loop of NTCP were highlighted as black dashed circle. c, The cavities of bile acid were calculated from four different structures of bacterial ASBT homologues. Compared to NTCP, all the bacterial ASBT homologues have small cavities. The volume of the cavities was calculated to be 989 Å3, 950 Å3, 306 Å3 and 238 Å3 from left to right, respectively. Black lines indicate membrane boundaries.

Similar articles

Cited by

References

    1. Global Hepatitis Report (World Health Organization, 2017).
    1. Pascarella S, Negro F. Hepatitis D virus: an update. Liver Int. 2011;31:7–21. doi: 10.1111/j.1478-3231.2010.02320.x. - DOI - PubMed
    1. Yan H, et al. Sodium taurocholate cotransporting polypeptide is a functional receptor for human hepatitis B and D virus. eLife. 2012;1:e00049. doi: 10.7554/eLife.00049. - DOI - PMC - PubMed
    1. Hu NJ, Iwata S, Cameron AD, Drew D. Crystal structure of a bacterial homologue of the bile acid sodium symporter ASBT. Nature. 2011;478:408–411. doi: 10.1038/nature10450. - DOI - PMC - PubMed
    1. Zhou X, et al. Structural basis of the alternating-access mechanism in a bile acid transporter. Nature. 2014;505:569–573. doi: 10.1038/nature12811. - DOI - PMC - PubMed

MeSH terms