Thigh Muscle Composition and Its Relationship to Functional Recovery Post Hip Fracture Over Time and Between Sexes
- PMID: 35580856
- PMCID: PMC9799201
- DOI: 10.1093/gerona/glac112
Thigh Muscle Composition and Its Relationship to Functional Recovery Post Hip Fracture Over Time and Between Sexes
Abstract
Background: Computed tomography (CT)-scan measures of muscle composition may be associated with recovery post hip fracture.
Methods: In an ancillary study to Baltimore Hip Studies Seventh cohort, older adults were evaluated at 2 and 6 months post hip fracture. CT-scan measures of muscle were acquired at 2 months. Short Physical Performance Battery (SPPB) was measured at 2 and 6 months. Generalized estimating equations were used to model the association of muscle measures and physical function, adjusting for age, sex, body mass index, and time postfracture.
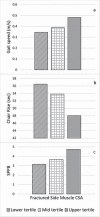
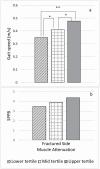
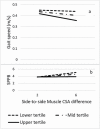
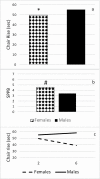
Results: Seventy-one older adults (52% males, age 79.6 ± 7.3 years) were included. At 2-months, males had greater thigh cross-sectional area (CSA, p < .0001) and less low-density muscle (p = .047), and intermuscular adipose tissue (p = .007) than females on the side of the fracture, while females performed better on the SPPB (p = .05). Muscle measures on the fractured side were associated with function at 2 months in both sexes. Participants with the lowest tertile of muscle CSA difference at 2-months, indicating greater symmetry in CSA between limbs, performed better than the other 2 tertiles at 6-months. Males performed worse in functional measures at baseline and did not recover as well as females (p = .02).
Conclusion: CT-scan measures of muscle CSA and fatty infiltration were associated with function at 2-months post hip fracture and with improvement in function by 6 months. Observed sex differences in these associations suggest that rehabilitation strategies may need to be adapted by sex after hip fracture.
Keywords: Computed tomography (CT scan); Physical function; Sex differences.
© The Author(s) 2022. Published by Oxford University Press on behalf of The Gerontological Society of America. All rights reserved. For permissions, please e-mail: journals.permissions@oup.com.
Figures


Similar articles
-
Shape phenotype of thigh fat and muscle and risk of major adverse cardiovascular events after fragility hip fracture.J Cachexia Sarcopenia Muscle. 2024 Feb;15(1):331-341. doi: 10.1002/jcsm.13407. Epub 2023 Dec 21. J Cachexia Sarcopenia Muscle. 2024. PMID: 38129313 Free PMC article.
-
Asymmetry in CT Scan Measures of Thigh Muscle 2 Months After Hip Fracture: The Baltimore Hip Studies.J Gerontol A Biol Sci Med Sci. 2015 Jun;70(6):753-6. doi: 10.1093/gerona/glr188. J Gerontol A Biol Sci Med Sci. 2015. PMID: 25958401 Free PMC article.
-
Asymmetry in CT Scan Measures of Thigh Muscle 2 Months After Hip Fracture: The Baltimore Hip Studies.J Gerontol A Biol Sci Med Sci. 2015 Oct;70(10):1276-80. doi: 10.1093/gerona/glv053. Epub 2015 May 11. J Gerontol A Biol Sci Med Sci. 2015. Retraction in: J Gerontol A Biol Sci Med Sci. 2016 Sep;71(9):1241. doi: 10.1093/gerona/glw027. PMID: 25969469 Free PMC article. Retracted.
-
Computed tomographic measurements of thigh muscle cross-sectional area and attenuation coefficient predict hip fracture: the health, aging, and body composition study.J Bone Miner Res. 2010 Mar;25(3):513-9. doi: 10.1359/jbmr.090807. J Bone Miner Res. 2010. PMID: 20422623 Free PMC article.
-
Trunk Muscle Composition 2 Months After Hip Fracture: Findings From the Baltimore Hip Studies.Arch Phys Med Rehabil. 2019 Sep;100(9):1663-1671. doi: 10.1016/j.apmr.2018.10.023. Epub 2018 Dec 19. Arch Phys Med Rehabil. 2019. PMID: 30578772 Free PMC article.
Cited by
-
Related factors of postoperative half-year care utilization for health status and recovery in older adults with hip fracture: A retrospective study of Osaka National Health Insurance Data.Geriatr Gerontol Int. 2025 Feb;25(2):190-205. doi: 10.1111/ggi.15055. Epub 2025 Jan 16. Geriatr Gerontol Int. 2025. PMID: 39822114 Free PMC article.
-
Shape phenotype of thigh fat and muscle and risk of major adverse cardiovascular events after fragility hip fracture.J Cachexia Sarcopenia Muscle. 2024 Feb;15(1):331-341. doi: 10.1002/jcsm.13407. Epub 2023 Dec 21. J Cachexia Sarcopenia Muscle. 2024. PMID: 38129313 Free PMC article.
-
Relationship between muscle size and density and proximal femoral bone mineral density in elderly men with hip fractures across different age groups.J Orthop Surg Res. 2025 Feb 14;20(1):162. doi: 10.1186/s13018-025-05570-0. J Orthop Surg Res. 2025. PMID: 39953629 Free PMC article.
-
Feasibility, acceptability and prognostic value of muscle mass and strength measurement in patients with hip fracture: a systematic review.Eur Geriatr Med. 2024 Dec;15(6):1603-1614. doi: 10.1007/s41999-024-01102-x. Epub 2024 Nov 29. Eur Geriatr Med. 2024. PMID: 39614068 Free PMC article.
References
Publication types
MeSH terms
Grants and funding
LinkOut - more resources
Full Text Sources
Medical

