Differences by sex in supply, payments and clinical activity of family physicians in Ontario: a retrospective population-based cohort study
- PMID: 35580888
- PMCID: PMC9188800
- DOI: 10.9778/cmajo.20210068
Differences by sex in supply, payments and clinical activity of family physicians in Ontario: a retrospective population-based cohort study
Abstract
Background: The proportion of women entering medicine has increased in recent years, and understanding the different practice patterns of female and male family physicians (FPs) will provide important information for health workforce planning. We sought to evaluate differences by sex in the supply, payments and clinical activity among FPs in Ontario.
Methods: We conducted a cohort study using claims data from the Ontario Health Insurance Plan. We included all Ontario FPs who submitted claims from 1992 to 2018. We analyzed data using regression analyses for our outcomes of yearly number of FPs, payments, patient visits and distinct patients.
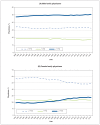
Results: The number of practising FPs increased from 10 370 in 1992 to 14 329 in 2018, with an annual increase of 155 female FPs and 13 male FPs. In 2018, male FPs outnumbered female FPs by 1159. Among male FPs, 32.7% worked less than 1 full-time equivalent (FTE) position, 18.1% worked 1 FTE and 49.2% worked more than 1 FTE, with little change over the 27-year study period. Among female FPs, the percentage of those who worked less than 1 FTE position decreased over time (58.6% in 1998 to 48.3% in 2015), those who worked 1 FTE was stable (22.2%-24.3%) and those who worked more than 1 FTE increased (18.7% in 1998 to 28.0% in 2017). Yearly payments were higher for male FPs than female FPs by 40%-60% overall and by 10%-20% in FPs who worked more than 1 FTE. For FPs who worked 1 FTE or less than 1 FTE, both sexes had similar payment amounts (from 2005-2018). For FPs who worked 1 FTE, female FPs were less likely to receive payments from fee-for-service after 2004, and had 550 fewer visits and 121 fewer patients annually than male FPs.
Interpretation: In Ontario, there are differences by sex in FP supply, payments, percentages of FTE groups, number of patient visits and number of distinct patients. Health administrators should be mindful of these differences when considering FP workforce plans to ensure a stronger primary health care system, with adequate health care delivery for the population.
© 2022 CMA Impact Inc. or its licensors.
Conflict of interest statement
Competing interests: None declared.
Figures


References
-
- Gooptu C. Women in dermatology: We couldn’t do without them. Int J Dermatol. 1997;36:646–9. - PubMed
-
- Elizabeth Blackwell Wikipedia. [accessed 2021 Jan. 18]. Available https://en.wikipedia.org/wiki/Elizabeth_Blackwell.
-
- Buys YM, Canizares M, Felfeli T, et al. Influence of age, sex, and generation on physician payments and clinical activity in Ontario, Canada: an age-period-cohort analysis. Am J Ophthalmol. 2019;197:23–35. - PubMed
-
- Supply, distribution and migration of physicians in Canada, 2019: historical data. Ottawa: Canadian Institute for Health Information; [accessed 2021 Sept. 27]. updated 2020 July 30. Available: https://secure.cihi.ca/estore/productSeries.htm?pc=PCC34.
Publication types
MeSH terms
Grants and funding
LinkOut - more resources
Full Text Sources
Miscellaneous
