. 2022 May;10(5):e004022.
doi: 10.1136/jitc-2021-004022.

CD4+ T-cell epitope-based heterologous prime-boost vaccination potentiates anti-tumor immunity and PD-1/PD-L1 immunotherapy

Affiliations

CD4+ T-cell epitope-based heterologous prime-boost vaccination potentiates anti-tumor immunity and PD-1/PD-L1 immunotherapy

Minglu Xiao et al. J Immunother Cancer. 2022 May.

Erratum in

Abstract

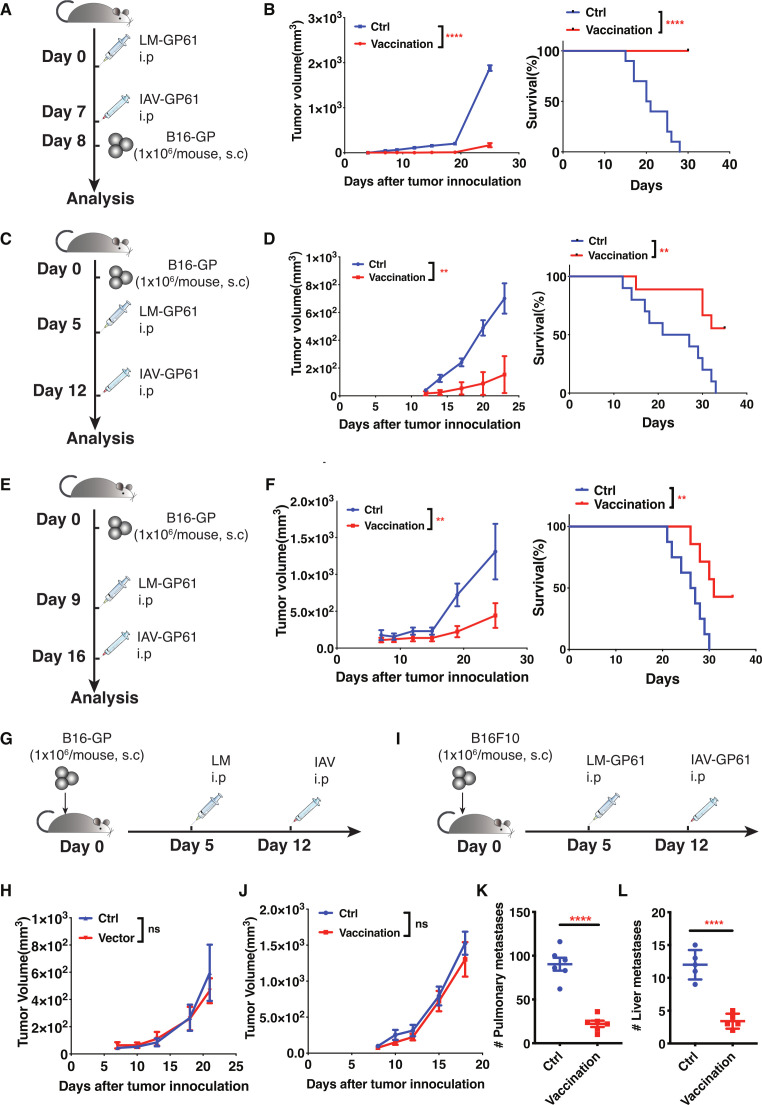
Background: Antitumor therapeutic vaccines are generally based on antigenic epitopes presented by major histocompatibility complex (MHC-I) molecules to induce tumor-specific CD8+ T cells. Paradoxically, continuous T cell receptor (TCR) stimulation from tumor-derived CD8+ T-cell epitopes can drive the functional exhaustion of tumor-specific CD8+ T cells. Tumor-specific type-I helper CD4+ T (TH1) cells play an important role in the population maintenance and cytotoxic function of exhausted tumor-specific CD8+ T cells in the tumor microenvironment. Nonetheless, whether the vaccination strategy targeting MHC-II-restricted CD4+ T-cell epitopes to induce tumor-specific TH1 responses can confer effective antitumor immunity to restrain tumor growth is not well studied. Here, we developed a heterologous prime-boost vaccination strategy to effectively induce tumor-specific TH1 cells and evaluated its antitumor efficacy and its capacity to potentiate PD-1/PD-L1 immunotherapy.

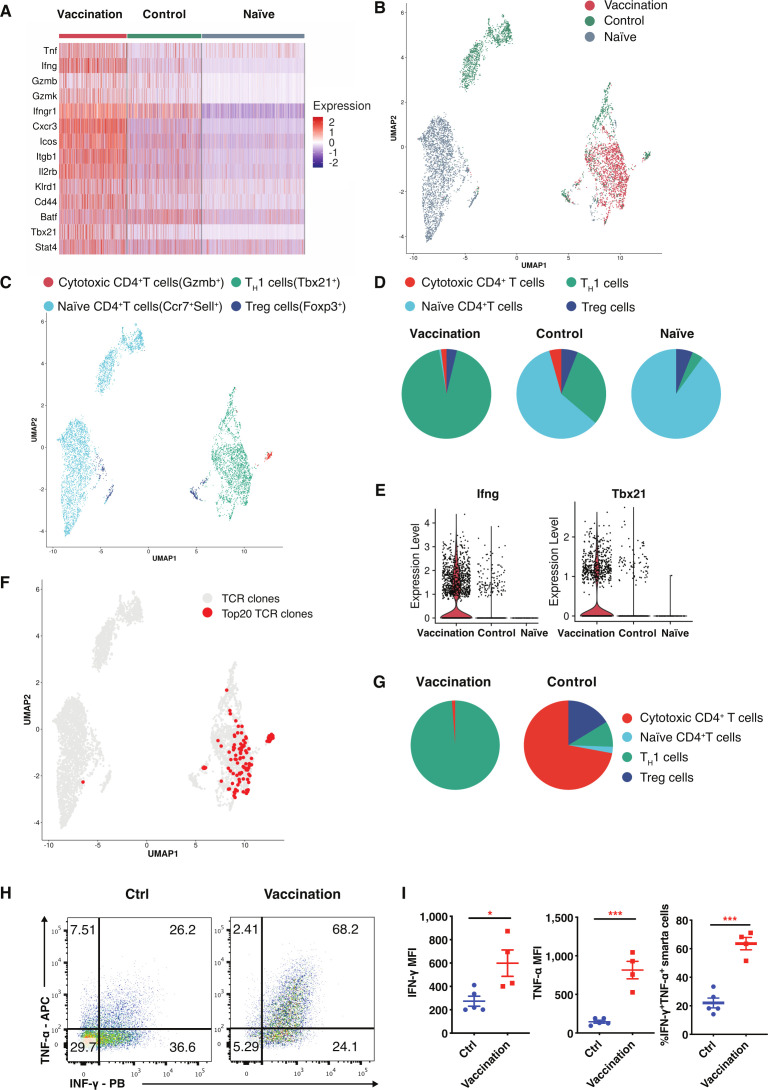
Methods: Listeria monocytogenes vector and influenza A virus (PR8 strain) vector stably expressing lymphocytic choriomeningitis virus (LCMV) glycoprotein-specific I-Ab-restricted CD4+ T cell epitope (GP61-80) or ovalbumin-specific CD4+ T cell epitope (OVA323-339) were constructed and evaluated their efficacy against mouse models of melanoma and colorectal adenocarcinoma expressing lymphocytic choriomeningitis virus glycoprotein and ovalbumin. The impact of CD4+ T cell epitope-based heterologous prime-boost vaccination was detected by flow-cytometer, single-cell RNA sequencing and single-cell TCR sequencing.

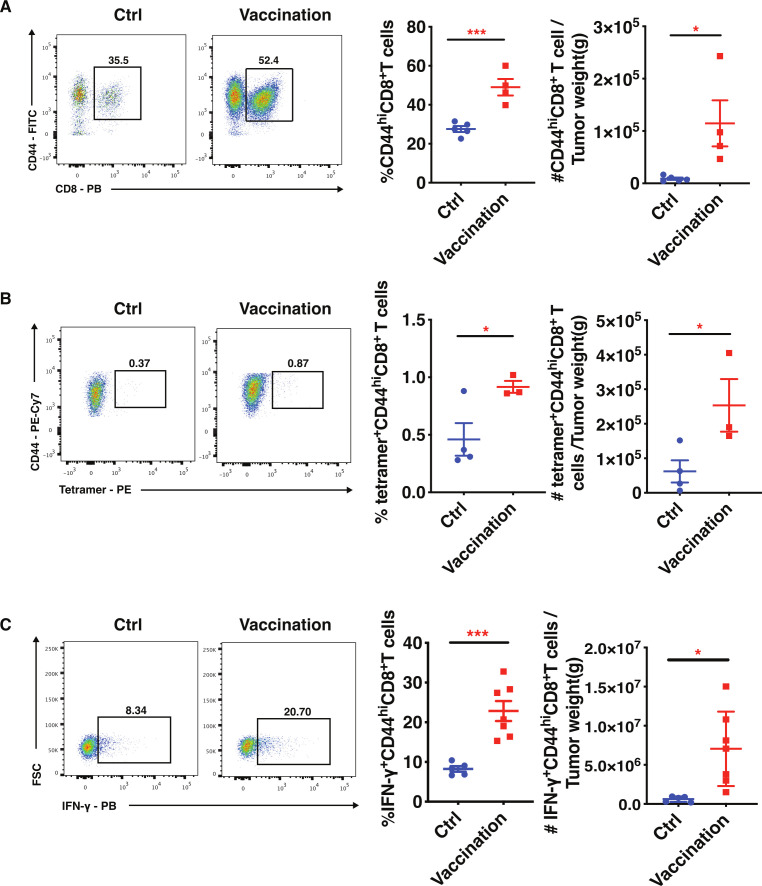
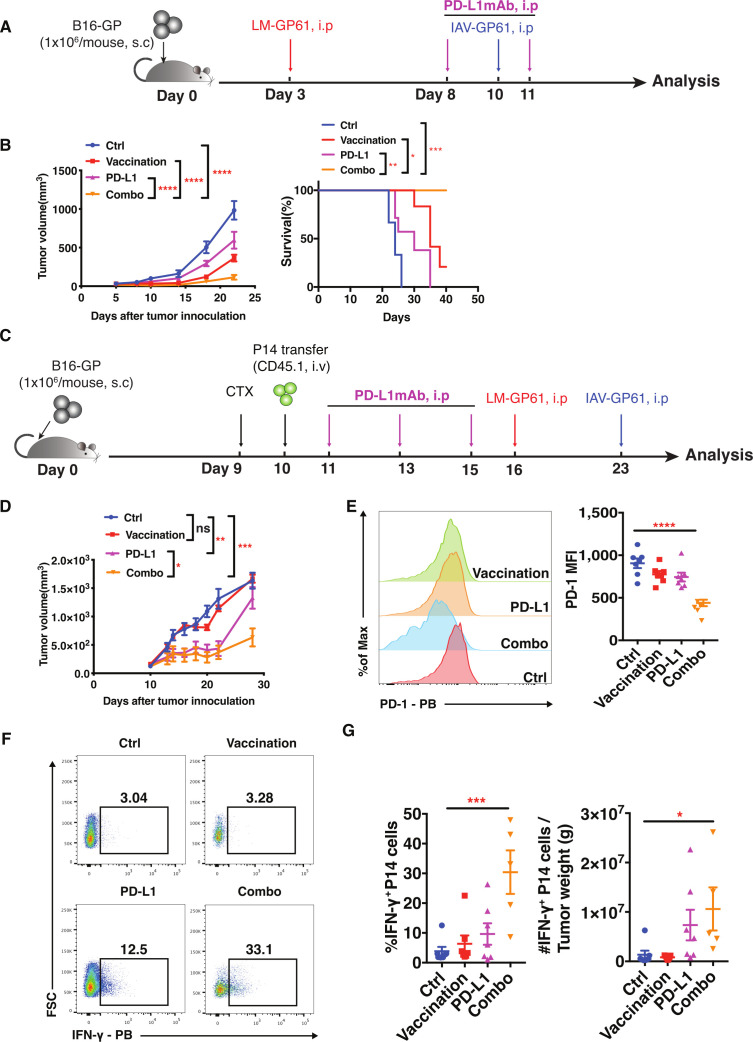
Results: CD4+ T cell epitope-based heterologous prime-boost vaccination efficiently suppressed both mouse melanoma and colorectal adenocarcinoma. This vaccination primarily induced tumor-specific TH1 response, which in turn enhanced the expansion, effector function and clonal breadth of tumor-specific CD8+ T cells. Furthermore, this vaccination strategy synergized PD-L1 blockade mediated tumor suppression. Notably, prime-boost vaccination extended the duration of PD-L1 blockade induced antitumor effects by preventing the re-exhaustion of tumor-specific CD8+ T cells.

Conclusion: CD4+ T cell epitope-based heterologous prime-boost vaccination elicited potent both tumor-specific TH1 and CTL response, leading to the efficient tumor control. This strategy can also potentiate PD-1/PD-L1 immune checkpoint blockade (ICB) against cancer.

Keywords: CD4-Positive T-Lymphocytes; CD8-Positive T-Lymphocytes; Immunization; Immunotherapy; Vaccination.


Conflict of interest statement

Competing interests: The authors declare a conflict of interest. A patent associated with a CD4+ T cell epitope-based therapeutic vaccine has been filed (LY and RH).

Figures

Figure 1
Figure 1
CD4+ T cell epitope-based heterologous prime-boost vaccination efficiently inhibits tumor growth in immunized mice. (A) Experimental design for examining prophylactic effect of prime-boost vaccination on syngeneic tumor transplantation. C57BL/6 mice (B6 mice) were immunized intraperitoneally (i.p) with LM-GP61(1×10⁶ CFU) and IAV-GP61(0.5 LD50) on day 0 and day 7, respectively. The mice were then inoculated subcutaneously (s.c) with B16-GP (1×10⁶ cells/mouse) on day 8 and allowed to grow until analysis. (B) Tumor growth (ctrl, n=5; vaccination, n=4) and the Kaplan-Meier survival curve (ctrl, n=10; vaccination, n=9) of prophylactically vaccinated mice (vaccination) and control mice (ctrl) in syngeneic transplantation. Tumor volumes were measured every 3–7 days. (C) Experimental design for examining therapeutic effect of prime-boost vaccination on early-stage tumor. B6 mice were inoculated with B16-GP (1×10⁶ cells/mouse, s.c) on day 0 and then received LM-GP61 (1×10⁶ CFU) and IAV-GP61 (0.5 LD50) on day 5 and day12, respectively. (D) Tumor growth (Ctrl, n=5; vaccination, n=6) and the Kaplan-Meier survival curve (ctrl, n=10; vaccination, n=9) of vaccinated mice (vaccination) and control mice (ctrl) with an early-stage immunization. Tumor volumes were measured every 3 or 4 days. (E) Experimental design for examining therapeutic effect of prime-boost vaccination on advanced-stage tumor. B6 mice were inoculated with B16-GP (1×10⁶ cells/mouse, s.c) on day 0 and then received LM-GP61 (1×10⁶ CFU) and IAV-GP61 (0.5 LD50) on day 9 and day 16, respectively. (F) Tumor growth (ctrl, n=5; vaccination, n=6) and the Kaplan-Meier survival curve (ctrl, n=8; vaccination, n=7) of vaccinated mice (vaccination) and control mice (ctrl) with an advanced-stage immunization. Tumor volumes were measured every 3–7 days. (G) B16-GP tumor-bearing mice were injected with Listeria (1×10⁶ CFU) and IAV (0.5 LD50) without expressing LCMV GP61-80.Tumor growth (ctrl, n=5; vector, n=10) is shown in (H). Tumor volumes were measured every 3–6 days. (I) B6 mice inoculated with B16 tumor cells (1×10⁶ cells/mouse, s.c) without expressing GP were injected i.p with LM-GP61 and IAV-GP61 at indicated time points. Tumor growth (n=5) is shown in (J). Tumor volumes were measured every 3 or 4 days. (K) B6 mice were injected B16-GP tumor cells intravenously into the circulation of mice to set up lung metastasis model and received vaccination on day 3 and day 10. (n=6) (L) B6 were injected with B16-GP tumor cells, followed by splenectomy at 3 min after injections to set up liver metastasis model and received vaccination on day 1 and day 8 (n=5). Statistical differences are assessed by a two-tailed unpaired Student’s t-test (K, L), a Mantel-Cox log-rank test for the Kaplan-Meier survival curve and two-way ANOVA (analysis of variance) for tumor growth. **P<0.01, ****p<0.0001, ns stands for not significant. Error bars (B, D, F, H, J, K, L) denote SEM. All data are representation of two independent experiments.
Figure 2
Figure 2
Both CD4+ and CD8+ T cells responses induced by the vaccination are essential for suppressing tumor growth. (A) Experimental design for CD4+ T cells depletion during vaccination in syngeneic tumor transplantation. B6 mice were received anti-CD4+ T cell monoclonal antibody GK1.5 mAb (200 μg/mouse, intraperitoneally) at indicated time points during an entire vaccination process in syngeneic tumor transplantation as scheme shown. (B) Tumor volumes of vaccinated mice and control mice with or without GK1.5 mAb. Tumor volumes were measured every 3 or 4 days (n=6, ctrl, vaccination; n=5, GK1.5 mAb, GK1.5 mAb +vaccination). (C)Experimental design for CD8+ T cells depletion during vaccination in syngeneic tumor transplantation. B6 mice were received anti-CD8+ T cell monoclonal antibody (CD8 mAb) (200 µg/mouse, intraperitoneally) at indicated time points during an entire vaccination process in syngeneic tumor transplantation as scheme shown. (D) Tumor volumes of vaccinated mice and control mice with or without CD8 mAb. Tumor volumes were measured every 3 or 4 days (n=6, ctrl, vaccination; n=5, CD8 mAb, CD8 mAb +vaccination). Statistical significance for tumor growth (B, D) are determined by two-way ANOVA. *P<0.05, ****p<0.0001 and ns stands for not significant. Error bars (B, D) denote SEM. Data are representation of two (A–D) independent experiments. ANOVA, analysis of variance.
Figure 3
Figure 3
Tumor infiltrating CD4+ T cells induced by the prime-boost vaccination tend to be TH1-polarized. B16-GP tumor-bearing mice received PBS or CD4+ T cell epitope-based heterologous prime-boost vaccination. Afterwards, we sorted CD4+ T cells in tumors from vaccinated (vaccination) and control B16-GP tumor-bearing mice or in lymph nodes from naïve mice (naïve) to perform single-cell RNA sequencing and single-cell TCR sequencing. (A) The heatmap shows differential gene expression of CD4+ T cells in lymph nodes from naïve mice and CD4+ T cells in tumors from control and vaccinated mice. The gene level was scaled to a z-score distribution from −2 to 2. Representative genes for cytokines, surface receptors and transcription factors were listed on the left side of the heatmap. (B) Uniform manifold approximation and projection (UMAP) plot of CD4+ T cells in naïve, control and vaccination groups. Each color represents a different group. (C) Four CD4+ T cells clusters are shown in UMAP plot. Different colors represent cluster origins. Cytotoxic CD4+ T cells; naïve CD4+ T cells; TH1 cells; Treg cells. (D) Pie chart shows the composition of four CD4+ T cells clusters in control, vaccination and naïve groups. (E) The violin plot shows Ifng and Tbx21 gene expression level in TH1 cells. (F) The TCR clonotypes of CD4+T cells in naïve, control and vaccination groups are shown in UMAP plot. The red one indicates Top20 TCR clones of CD4+ T cells. (G) The top20 clonotypes of CD4+ T cells in naïve, control and vaccination groups distributing in four clusters are shown in the pie chart. (H–I) SMARTA T cells (CD45.1+) were transferred intravenously into B6 mice (CD45.2+) which were bearing 10-day established B16-GP tumors. Cyclophosphamide (CTX) was administered 1 day before T cell transfer. The cytokine production by SMARTA T cells in the tumor of the control and vaccinated mice are represented by flow-cytometry plot (H), INF-γ MFI, TNF-α MFI and the frequency of INF-γ+TNF-α+ SMARTA cells(I) (Ctrl, n=5; vaccination, n=4). Statistical differences (I) are assessed by a two-tailed unpaired Student’s t-test. *P<0.05, ***p<0.001. Error bars (I) denote SEM. Data are representation of two independent experiments. TCR, T cell receptor.
Figure 4
Figure 4
CD4+ T cell epitope-based heterologous prime-boost vaccination induces strong tumor-specific CD8+ T cell response. The vaccination is executed as in figure 1C. Flow cytometry plots for CD44hi staining (A) and CD44hiDbgp33-41tetramer+ staining (B) gated on CD8+ T cells in tumors. The frequency (gated on tumor infiltrating lymphocytes) and number (relative to tumor weight) of total CD44hiCD8+ T cells (A) (Ctrl, n=5; Vaccination, n=4) or CD44hitetramer+CD8+ T cells (B) (Ctrl, n=4; vaccination, n=3) of the vaccinated and control mice in tumors (C) On stimulation with LCMV GP33-41 peptide and B16F10 GP100 peptide (KVPRNQDWL), the cytokine production by CD44hiCD8+ T cells in the tumor of the control (n=5) and vaccinated mice (n=7) are shown. Statistical differences (A–C) were assessed by a two-tailed unpaired Student’s t-test. *P<0.05, ***p<0.001. Error bars (A–C) denote SEM. Data are representation of two independent experiments.
Figure 5
Figure 5
CD4+ T cell epitope-based heterologous prime-boost vaccination induces poly-functionality of CD8+ T cells. B16-GP tumor-bearing mice received PBS or CD4+ T cell epitope-based heterologous prime-boost vaccination. Afterwards, we sorted CD8+ T cells in tumors from vaccinated (vaccination) and control B16-GP tumor-bearing mice or in lymph nodes from naïve mice (naïve) to perform single-cell RNA sequencing and single-cell TCR sequencing. (A) Heatmap of relative genes expressed by CD8+T cell from control mice, vaccinated mice and naïve mice. The color indicates the expression level of each gene. Representative genes for cytokine, surface receptors and transcription factors were listed on the left side of the heatmap. (B) Uniform manifold approximation and projection (UMAP) plot of CD8+T cells from control mice, vaccinated mice and naïve mice. The color indicates different group. (C) Five CD8+ T cells subsets are shown in uniform manifold approximation and projection (U-MAP) plot. Different colors represent cluster origins. Effector CD8+ T cells (Effector cells); Progenitor exhaustion CD8+ T cells (memory-like Tex cells); Transitory exhaustion CD8+ T cells (Transitory Tex cells); Naïve CD8+ T cells (naïve cells); Terminal exhaustion CD8+ T cells (Terminal Tex). (D) Pie chart shows the composition of five CD8+ T cells clusters in control, vaccination and naïve groups. (E) The TCR clonotypes of CD8+ T cells in naïve, control and vaccination groups are shown in UMAP plot. The red one indicates Top20 TCR clones of CD8+ T cells. (F) The distributions of the top20 clonotypes of CD8+ T cells in control, vaccination and naïve groups are shown in pie chart. (G) The top5 clonotypes CDR3 sequence of CD8+ T cells in vaccination group. The red clonotypes symbolize the clonotype CDR3 sequence matched with B16F10 tumor clonotypes CDR3 sequence. (H) The top5 clonotypes CDR3 sequence of CD8+ T cells in control group. The red clonotypes symbolize the clonotype CDR3 sequence matched with B16F10 tumor clonotypes CDR3 sequence. (I) B6 mice were transplanted with B16-GP tumor cells (1×10⁶ cells/mouse, s.c) in one flank, and with B16F10 tumor cells (1×10⁶ cells/mouse, s.c) in the other flank followed by vaccination on day 5 and day 12. The tumor volumes of B16-GP tumors (J) and B16F10 tumors (K) are shown (n=9). Tumor volumes were measured every 3 or 4 days. Statistical significance for tumor growth is determined by two-way ANOVA. **P<0.01, ****p<0.0001. Error bars (J–K) denote SEM. Data are representation of two independent experiments. ANOVA, analysis of variance.
Figure 6
Figure 6
The combination of vaccination and PD-L1 blockade improves antitumor efficacy. (A) Schematic representation of the experimental design. Ctrl indicates mice receiving PBS; PD-L1, PD-L1 mAb treatment; vaccination, immunized by prime-boost vaccination; Combo, the combination of PD-L1 mAb treatment and vaccination. For vaccination and combo group, LM-GP61 (1×10⁶ CFU, i.p), IAV-GP61 (0.5 LD50, i.p) were given on day 3 and day 10. For PD-L1 and Combo group, mice were injected intraperitoneally (i.p) with PD-L1 mAb (200 μg/mouse, i.p) on day 8 and day 11. B6 mice were administered with PBS at these four time points as control. (B) Tumor growth curve (Ctrl, n=8; vaccination, n=8; PD-L1, n=9; Combo, n=8) and Kaplan-Meier survival curve (Ctrl, n=5; vaccination, n=5; PD-L1, n=5; Combo, n=5) of mice are shown. Tumor volumes were measured every 3–5 days. (C) Schematic representation of the experimental design. CD45.2+ B6 mice bearing 10-day established B16-GP tumors (1×10⁶ cells/mouse, s.c) were received CD45.1+ P14 cells (1×10⁶ cells/mouse, intravenously) transfer. Cyclophosphamide (CTX) was administered 1 day before T cell transfer. B6 mice were then administered with PD-L1 mAb (200 µg/mouse, i.p) and vaccination (1×10⁶ CFU for LM-GP61 and 0.5 LD50 for IAV-GP61, i.p) at indicated time points. (D) Tumor growth curves (Ctrl, n=5; vaccination, n=7; PD-L1, n=7; Combo, n=6) of mice are shown. Tumor volumes were measured every 2–7 days. PD-1 MFI (E) and the frequency and number of IFN-γ-secreting P14 cells (F–G) in tumors on 14 days post-transfer were determined by FACS (gated on CD45.1+CD8+CD44+ T cells) (n=7, ctrl, vaccination, PD-L1; n=5, Combo). Statistical differences were assessed by ordinary one-way ANOVA analysis (E, G), two-way ANOVA (B, D) and a Mantel-Cox log-rank test for the Kaplan-Meier survival curve (B). *P<0.05, **p<0.01, ***p<0.001, ****p<0.0001, ns stands for not significant. Error bars (B, D, E, G) denote SEM. Data are representation of two (A–G) independent experiments. ANOVA, analysis of variance.

Similar articles

Cited by

References

    1. McLane LM, Abdel-Hakeem MS, Wherry EJ. Cd8 T cell exhaustion during chronic viral infection and cancer. Annu Rev Immunol 2019;37:457–95. 10.1146/annurev-immunol-041015-055318 - DOI - PubMed
    1. Wherry EJ. T cell exhaustion. Nat Immunol 2011;12:492–9. 10.1038/ni.2035 - DOI - PubMed
    1. Callahan MK, Postow MA, Wolchok JD. Targeting T cell co-receptors for cancer therapy. Immunity 2016;44:1069–78. 10.1016/j.immuni.2016.04.023 - DOI - PubMed
    1. Ribas A, Wolchok JD. Cancer immunotherapy using checkpoint blockade. Science 2018;359:1350–5. 10.1126/science.aar4060 - DOI - PMC - PubMed
    1. Hodi FS, O'Day SJ, McDermott DF, et al. . Improved survival with ipilimumab in patients with metastatic melanoma. N Engl J Med 2010;363:711–23. 10.1056/NEJMoa1003466 - DOI - PMC - PubMed