. 2022 May;10(5):e004533.
doi: 10.1136/jitc-2022-004533.

Activin-A impairs CD8 T cell-mediated immunity and immune checkpoint therapy response in melanoma

Affiliations

Activin-A impairs CD8 T cell-mediated immunity and immune checkpoint therapy response in melanoma

Katarina Pinjusic et al. J Immunother Cancer. 2022 May.

Abstract

Background: Activin-A, a transforming growth factor β family member, is secreted by many cancer types and is often associated with poor disease prognosis. Previous studies have shown that Activin-A expression can promote cancer progression and reduce the intratumoral frequency of cytotoxic T cells. However, the underlying mechanisms and the significance of Activin-A expression for cancer therapies are unclear.

Methods: We analyzed the expression of the Activin-A encoding gene INHBA in melanoma patients and the influence of its gain- or loss-of-function on the immune infiltration and growth of BRAF-driven YUMM3.3 and iBIP2 mouse melanoma grafts and in B16 models. Using antibody depletion strategies, we investigated the dependence of Activin-A tumor-promoting effect on different immune cells. Immune-regulatory effects of Activin-A were further characterized in vitro and by an adoptive transfer of T cells. Finally, we assessed INHBA expression in melanoma patients who received immune checkpoint therapy and tested whether it impairs the response in preclinical models.

Results: We show that Activin-A secretion by melanoma cells inhibits adaptive antitumor immunity irrespective of BRAF status by inhibiting CD8+ T cell infiltration indirectly and even independently of CD4 T cells, at least in part by attenuating the production of CXCL9/10 by myeloid cells. In addition, we show that Activin-A/INHBA expression correlates with anti-PD1 therapy resistance in melanoma patients and impairs the response to dual anti-cytotoxic T-Lymphocyte associated protein 4/anti-PD1 treatment in preclinical models.

Conclusions: Our findings suggest that strategies interfering with Activin-A induced immune-regulation offer new therapeutic opportunities to overcome CD8 T cell exclusion and immunotherapy resistance.

Keywords: immune evasion; immunotherapy; melanoma; tumor microenvironment.


Conflict of interest statement

Competing interests: None declared.

Figures

Figure 1
Figure 1
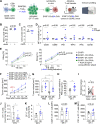
B16-F1 melanoma cell-derived Activin-A decreases tumor-infiltrating CTLs and NK cells. (A) Percentages of total CD45+ immune cells, and (B) CD3+CD8+ T cells, (C) CD3-NK1.1+ NK cells, (D) CD4+FoxP3- T cells, (E) CD4+FoxP3+ Tregs, (F) CD11b+ myeloid cells, (G) CD11c+F4/80- dendritic cells, (H) CD11b+Ly6Chi monocytes, (I) CD11b+F4/80hi TAMs, and (J) CD11b+Ly6Ghi neutrophils among CD45+ immune cells in syngeneic B16F1-Ctrl (n=8) and B16F1-βA (n=10) mouse melanoma grafts, quantified at the endpoint by flow cytometry. Data represent SEM, *p<0.05, **p<0.01, ***p<0.001, Student’s t-test. CTLs, cytotoxic T lymphocytes; NK, natural killer.
Figure 2
Figure 2
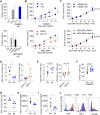
Activin-A accelerates melanoma growth by inhibiting antigen-specific CTLs, independently of CD4+ T cells and despite increased antigen cross-presentation. (A) Illustration of the workflow to assess the activation status and frequencies of antigen-presenting cells (APCs) and OVA-specific CD8+ T cells in tumors, draining lymph nodes (dLNs), and spleen of B16.OVA-Ctrl or B16.OVA-βA tumor-bearing mice (top), and the influence of anti-CD8 vs anti-CD4 depletion on tumor growth (bottom). (B) H2Kb surface expression and (C), H2Kb-SIINFEKL presentation by CD11c+ APCs in B16.OVA-Ctrl and B16.OVA-βA tumors analyzed by flow cytometry. (D) Dextramer-labeled H2Kb-SIINFEKL complexes on CD8+ T-cells from B16.OVA-Ctrl and B16.OVA-βA tumors. Error bars, SEM (n=4); *p<0.05, Student’s t-test. (E) MHCII and (F) CD80 expression on tumor-infiltrating CD11c+ cells measured as mean fluorescence intensity (MFI) by flow cytometry (n = 8–10). Data represent SEM, ****p<0.0001, Student’s t-test. (G) Growth curves of B16.OVA-Ctrl versus -βΑ in mice treated with IgG, αCD4, or αCD8 antibodies, or with a combination of αCD4 and αCD8. Error bars, SEM (n = 4–5 per group), *p<0.05, **p<0.01, Student’s t-test. ns, not significant.
Figure 3
Figure 3
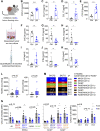
Activin-A diminishes the intratumoral accumulation but not the activation of in vitro-stimulated adoptive T cell grafts. (A) Strategy to compare the in vitro activation and cytotoxicity of CD8+ T cells in the presence and absence of melanoma cell-derived or exogenously added Activin-A. (B) Percentage of Ki67+ OT-I cells and (C) cell number count of expanded OT-I T cells after activation without or with Activin-A (n = 4 independent experiments). (D) Expression of CD25, CD69, and PD1 (n = 4 experiments) and TNFα, IFNγ, GranzymeB on OT-I T cells (n=3 experiments) after 4 days activation with or without Activin-A analyzed as mean fluorescence intensity normalized to the corresponding control of each flow cytometry experiment. Error bars, SEM; p values, two-way ANOVA with Tukey’s correction for multiple comparison. (E) Tumor cell killing by OT-I cells activated in control conditions (left panel) or in presence of Activin-A (right panel) (n = 3-6 independent experiments). Error bars, SEM, p values, two-way ANOVA with Tukey’s correction for multiple comparison. (F) Growth curves of B16F1-Ctrl.OVA and –βA.OVA tumors in syngeneic mice that received 1x10⁶ activated OT-I T cells or phosphate buffered saline (PBS) by i.v. injection, and (G), tumor volumes measured at the endpoint. (H) Reduction of B16F1-Ctrl.OVA and B16F1-βA.OVA tumor volumes by the OT-I transfer relative to average tumor volumes of the corresponding PBS-treated controls. Error bars, SEM (n = 7–8); p values, ordinary one-way ANOVA with Holm-Šídák correction for multiple comparisons. (I) Correlation of tumor mass with the number of OT-I TILs per mg of tumor. Tumor mass and OT-I count were normalized to the respective values of the largest tumor; n=15; r, two-tailed Pearson correlation analysis. (J) OT-I T cell count per mg of B16F1-Ctrl.OVA and B16F1-βA.OVA tumors and (K)per µl in their dLN suspension. Error bars, SEM (n = 7–8); p values, Student’s t-test. (L, M) Mean fluorescence intensity of CD25 and PD1 protein staining in OT-I T cells analyzed by flow cytometry 1 week after the transfer into B16F1-Ctrl.OVA or B16F1-βΑ.OVA tumor-bearing mice. Error bars, SEM (n=7-8); *p<0.05, **p<0.01, ****p<0.0001, Student’s t-test. ANOVA, analysis of variance; TILs, tumor-infiltrating leucocytes.
Figure 4
Figure 4
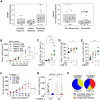
Activin-A accelerates the tumor growth and inhibits CTL accumulation and function also in BRAF-driven melanoma. (A) Induction of the CAGA-luc reporter of SMAD3 activity in HepG2 reporter cells after overnight incubation with conditioned media of YUMM3.3-Ctrl or –βΑ stable cell lines (top), or of iBIP2 2891L Mock-Fc or AIIB-Fc cells (below). SN of parental iBIP2 2891L cells supplemented with or without 100 ng/ml FST are shown for comparison; n=2 independent experiments using triplicate samples. (B) Growth curves of YUMM3.3-Ctrl and –βΑ tumors in syngeneic C57BL/6J female hosts (top), and of iBIP2 2891 L Mock-Fc or AIIB-Fc tumors in syngeneic FVB males (below) (n = 5 per group). (C) Growth curves of YUMM3.3-Ctrl and –βA (top), and iBIP2 2891 L Mock-Fc and AIIB-Fc (below) tumor grafts in Rag1-/- host (n=5 per group). (D, E) Flow cytometry of CD8+ or CD4+ T cell frequencies in YUMM3.3-Ctrl and –βA (left), iBIP2 Mock-Fc and AIIB-Fc (right) tumor-infiltrating CD45+ cells (n=5). Error bars, SEM (n=5 per group); p value, Student’s t-test. (F) Frequency of FoxP3+ cells among CD4+ TILs in YUMM3.3-Ctrl vs –βA tumors. Error bars, SEM (n = 5 Ctrl and 8 βA tumors), Student’s t-test. (G) IFNγ, (H) TNFα and (I) GzmB expression in CD8+ T cells from YUMM3.3-Ctrl and -βΑ tumors at the endpoint. Error bars, SEM (n = 4-5); *p<0.05, **p<0.01, Student’s t-test. (J) Representative histograms of intracellular IFNγ, TNFα, and Granzyme B flow cytometry analysis of CD8+ T-cells from YUMM3.3-Ctrl and -βA syngeneic grafts after PMA/ionomycin stimulation. Stained unstimulated cells were used as fluorescence minus one (FMO) staining controls. CTLs, cytotoxic T lymphocytes; TILs, tumor-infiltrating leucocytes.
Figure 5
Figure 5
Activin-A alters the immunoregulatory network in the TME. (A) Illustration of the experimental procedure: YUMM3.3-Ctrl and -βΑ tumors were dissected, cell numbers were normalized and cultured ex vivo. Secreted chemokines and cytokines in the culture supernatant were quantified. (B–K) Secretion of CXCL1, CCL11, CCL17, CCL22, CXCL9, CXCL10, CXCL13, IL4, IFNγ, and IL10 by dissociated YUMM3.3-CTRL and YUMM3.3-βΑ tumor cells during 24 hours of ex vivo culture. Error bars, SEM (n = 5-6 Ctrl and 8–βΑ tumors). *P<0.05, **p<0.01, ***p<0.001, ****p<0.0001, Mann-Whitney U test for non-parametric data and a two-tailed t-test for parametric data. (L) Quantification of MoMac (CD45+CD3-CD11b+F4/80+) and DC (CD45+CD3- F4/80-MCHII+CD11c+) infiltration and (M) proportions of MoMac subsets in YUMM3.3-Ctrl versus -βΑ tumors (n = 5). (N) CXCL9 production measured as MFI in MoMac and DC subpopulations: XCR1+ DC1, CD172a+ DC2, CCR7+ DC3. Error bars, SEM (n=5 tumors per group). *P<0.05, two-tailed t-test. DC, dendritic cell; MFI, mean fluorescence intensity; MHC, major histocompatibility complex; TME, tumor microenvironment.
Figure 6
Figure 6
INHBA expression in melanoma promotes resistance to ICB immunotherapy. (A) Relative expression levels of INHBA mRNA in biopsies of 26 pretreatment melanoma patients grouped by the course of disease after receiving anti-PD1 therapy (left; one-way ANOVA not significant), or as responders (n=14) or non-responders (n=12), p=0.04, Welch two sample t-test (2) based on irRECIST criteria (3). (B) Growth curves of iBIP2 2891L Mock-Fc and iBIP2 2891L AIIB-Fc tumor grafts in FVB/N mice after treatment with αPD-1 and αCTLA4 (ICB), or with IgG control antibodies. (C–E) Relative frequencies of (C) total and (D) IFNγ+ CD8+ T cells, and of (E) IFNγ+ CD4+ T cells in iBIP2 2891L Mock-Fc vs AIIB-Fc tumors treated with ICB or control IgG antibodies. Error bars, SEM (n=5 per genotype); **p<0.01, ***p<0.001, ****p<0.0001, ordinary one-way ANOVA with Holm-Šídák correction for multiple comparisons. (F) Growth curves and (G), volumes of YUMM3.3-CTRL and -βΑ tumors treated with IgG or ICB antibodies. (H) Pie charts of the response to anti-PD1/anti-CTLA4 ICB therapy in YUMM3.3-CTRL and YUMM3.3-βΑ tumors. Error bars, SEM (n=11-12); *P<0.05, **p<0.01, ***p<0.001, ****p<0.0001, two-tailed Student’s t-test. ANOVA, analysis of variance.

Similar articles

Cited by

References

    1. Mahmoud F, Shields B, Makhoul I, et al. . Immune surveillance in melanoma: from immune attack to melanoma escape and even counterattack. Cancer Biol Ther 2017;18:451–69. 10.1080/15384047.2017.1323596 - DOI - PMC - PubMed
    1. Fife BT, Bluestone JA. Control of peripheral T-cell tolerance and autoimmunity via the CTLA-4 and PD-1 pathways. Immunol Rev 2008;224:166–82. 10.1111/j.1600-065X.2008.00662.x - DOI - PubMed
    1. Larkin J, Chiarion-Sileni V, Gonzalez R, et al. . Five-year survival with combined nivolumab and ipilimumab in advanced melanoma. N Engl J Med 2019;381:1535–46. 10.1056/NEJMoa1910836 - DOI - PubMed
    1. Grasso CS, Tsoi J, Onyshchenko M, et al. . Conserved interferon-γ signaling drives clinical response to immune checkpoint blockade therapy in melanoma. Cancer Cell 2020;38:500–15. 10.1016/j.ccell.2020.08.005 - DOI - PMC - PubMed
    1. Kalbasi A, Ribas A. Tumour-intrinsic resistance to immune checkpoint blockade. Nat Rev Immunol 2020;20:25–39. 10.1038/s41577-019-0218-4 - DOI - PMC - PubMed