. 2022 Jul;28(7):1345-1354.
doi: 10.3201/eid2807.212339. Epub 2022 May 17.

Measuring Basic Reproduction Number to Assess Effects of Nonpharmaceutical Interventions on Nosocomial SARS-CoV-2 Transmission

Collaborators

Measuring Basic Reproduction Number to Assess Effects of Nonpharmaceutical Interventions on Nosocomial SARS-CoV-2 Transmission

George Shirreff et al. Emerg Infect Dis. 2022 Jul.

Abstract

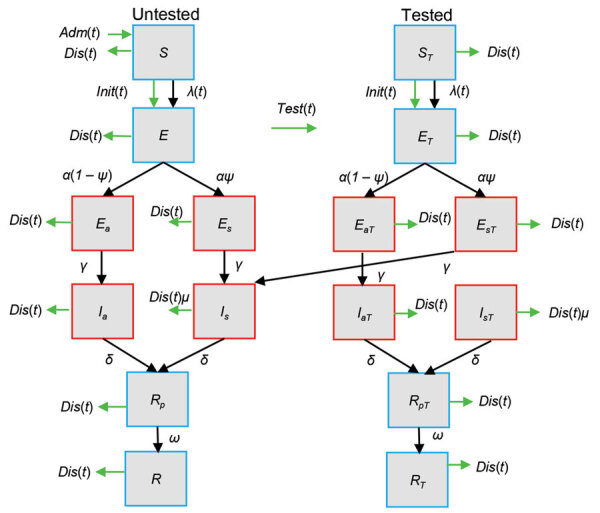
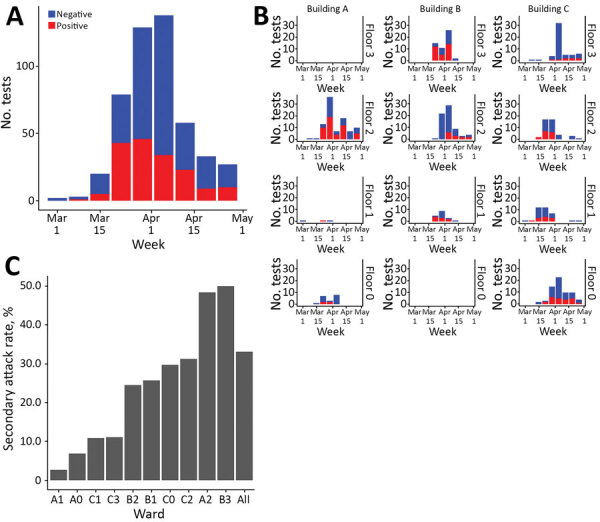
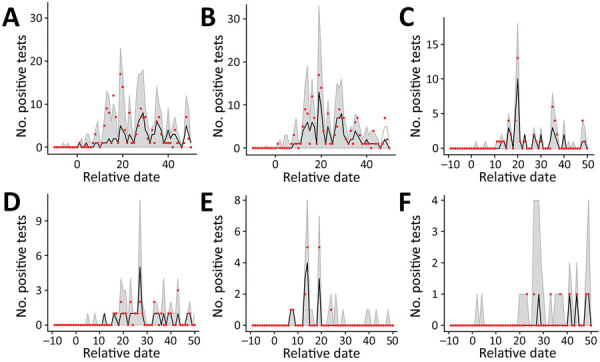
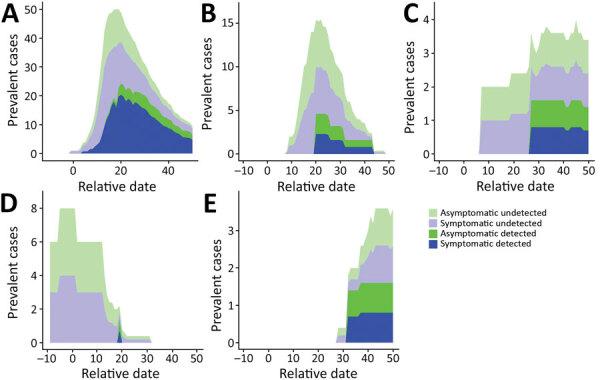
Outbreaks of SARS-CoV-2 infection frequently occur in hospitals. Preventing nosocomial infection requires insight into hospital transmission. However, estimates of the basic reproduction number (R0) in care facilities are lacking. Analyzing a closely monitored SARS-CoV-2 outbreak in a hospital in early 2020, we estimated the patient-to-patient transmission rate and R0. We developed a model for SARS-CoV-2 nosocomial transmission that accounts for stochastic effects and undetected infections and fit it to patient test results. The model formalizes changes in testing capacity over time, and accounts for evolving PCR sensitivity at different stages of infection. R0 estimates varied considerably across wards, ranging from 3 to 15 in different wards. During the outbreak, the hospital introduced a contact precautions policy. Our results strongly support a reduction in the hospital-level R0 after this policy was implemented, from 8.7 to 1.3, corresponding to a policy efficacy of 85% and demonstrating the effectiveness of nonpharmaceutical interventions.

Keywords: COVID-19; R0; SARS; SARS-CoV-2; basic reproduction number; contact precautions; coronavirus; coronavirus disease; iterative filtering; long-term care facility; nosocomial infection; patient-to-patient transmission; respiratory infections; severe acute respiratory syndrome coronavirus 2; statistical inference; stochastic modelling; transmission rate; viruses; zoonoses.


Figures

Figure 1
Figure 1
Compartmental susceptible-exposed-infectious-recovered model used to estimate nosocomial SARS-CoV-2 transmission rates on the basis of data for a long-term care facility in France. Red boxes indicate SARS-CoV-2 infectious compartments and blue boxes indicate noninfectious compartments. The left side shows the trajectory of untested persons, the right side shows tested persons. If untested persons are tested at any point in state X, they will enter the equivalent tested compartment (XT, right panel), which is epidemiologically identical except for the testing rate. Patients in the susceptible state (S) can become infected by contact with infectious patients. When infected, patients move to the noninfectious incubation (E) compartment, after which they can either enter an asymptomatic or a symptomatic pathway of infectiousness. Each pathway has an infectious incubation period (Ea, Es) before asymptomatic (Ia) or symptomatic (Is) infection begins. After full infection, patients recover into a noninfectious state (Rp) where they are still likely to test positive before full recovery (R) when the probability of testing positive diminishes to (1 – test specificity). Green arrows refer to processes, initiation (Init), admission (Adm), discharge (Dis), and testing (Test), that occur a specified number of times on a given day according to model inputs. Black arrows indicate processes that are natural for infection and are entirely stochastic (Appendix Methods, Figure 1). E, exposed; Ea, asymptomatic exposed; EaT, asymptomatic exposed and tested; Es, symptomatic exposed; EsT, symptomatic exposed and tested; ET, exposed and tested; I, infectious; Ia, asymptomatic infectious; IaT, asymptomatic infectious and tested; Is, symptomatic infectious; IsT, symptomatic infectious and tested; IT, infectious and tested; R, recovered; Rp, recovered to noninfectious state; RpT, recovered to noninfectious state and tested; RT, recovered and tested; S, susceptible; t, time; α, rate of progression from noninfectious incubation; ψ, proportion of patients entering symptomatic pathway; λ(t), force of infection at time t; γ, rate of progression from infectious incubation; δ, rate of progression from symptomatic infection; μ, relative rate of discharge for symptomatic patients relative to any nonsymptomatic patient; ω, rate at which viral shedding ceases during recovery.
Figure 2
Figure 2
Hospital data from a long-term care facility in France used to estimate nosocomial SARS-CoV-2 transmission rates. A) Number of SARS-CoV-2 PCR tests performed each week in the whole hospital. B) Number of SARS-CoV-2 PCR tests performed in each ward each week. C) Secondary attack rates in the whole hospital. Rates were calculated as the ratio of the number of patients with positive results to the total number of patients in the hospital at any time during the study period.
Figure 3
Figure 3
Results of simulated epidemics in a model of nosocomial SARS-CoV-2 transmission using estimated parameters determined on the basis of data from a long-term care facility in France. A) 1-phase model for the whole hospital. B) 2-phase model for the whole hospital. C–F) 1-phase model for individual wards: A2 (C), C0 (D), C2 (E), and C3 (F). Red dots show the observed number of positive tests in the data, black dashed lines indicate the median across that date for all simulations, and gray shading indicates the 95% CI range of the simulated values. Input parameter sets were included if their likelihood fell within the 95% CI relative to the maximum likelihood for 1- and 2-phase models for the whole hospital and individual wards. Estimated parameters are from Tables 1, 2. Extinct epidemics (i.e., those having <3 cumulative cases) were excluded from the distribution.
Figure 4
Figure 4
Stacked prevalence of detected and undetected symptomatic and asymptomatic infections in simulated epidemics using a model of nosocomial SARS-CoV-2 transmission determined on the basis of data from a long-term care facility in France. A) Prevalence estimated by using the 2-phase model for the whole hospital. B–E) Prevalence estimated by using the 1-phase model for individual wards: A2 (B), C0 (C), C2 (D), and C3 (E). After excluding extinct simulations (i.e., those having <3 cumulative cases), we calculated the median of each prevalence measure for each date.

Similar articles

Cited by

References

    1. Guan WJ, Liang WH, Zhao Y, Liang HR, Chen ZS, Li YM, et al.; China Medical Treatment Expert Group for COVID-19. Comorbidity and its impact on 1590 patients with COVID-19 in China: a nationwide analysis. Eur Respir J. 2020;55:2000547. 10.1183/13993003.00547-2020 - DOI - PMC - PubMed
    1. Wu C, Chen X, Cai Y, Xia J, Zhou X, Xu S, et al. Risk factors associated with acute respiratory distress syndrome and death in patients with coronavirus disease 2019 pneumonia in Wuhan, China. JAMA Intern Med. 2020;180:934–43. 10.1001/jamainternmed.2020.0994 - DOI - PMC - PubMed
    1. Abbas M, Robalo Nunes T, Martischang R, Zingg W, Iten A, Pittet D, et al. Nosocomial transmission and outbreaks of coronavirus disease 2019: the need to protect both patients and healthcare workers. Antimicrob Resist Infect Control. 2021;10:7. 10.1186/s13756-020-00875-7 - DOI - PMC - PubMed
    1. Hall VJ, Foulkes S, Saei A, Andrews N, Oguti B, Charlett A, et al.; SIREN Study Group. COVID-19 vaccine coverage in health-care workers in England and effectiveness of BNT162b2 mRNA vaccine against infection (SIREN): a prospective, multicentre, cohort study. Lancet. 2021;397:1725–35. 10.1016/S0140-6736(21)00790-X - DOI - PMC - PubMed
    1. Cheng VC-C, Fung KS-C, Siu GK-H, Wong S-C, Cheng LS-K, Wong M-S, et al. Nosocomial outbreak of COVID-19 by possible airborne transmission leading to a superspreading event. Clin Infect Dis. 2021;73:e1356–64. 10.1093/cid/ciab313 - DOI - PMC - PubMed

Publication types