. 2023 Mar;72(3):472-483.
doi: 10.1136/gutjnl-2021-326620. Epub 2022 May 17.

Hepatic p63 regulates glucose metabolism by repressing SIRT1

Affiliations

Hepatic p63 regulates glucose metabolism by repressing SIRT1

Maria J Gonzalez-Rellan et al. Gut. 2023 Mar.

Abstract

Objective: p63 is a transcription factor within the p53 protein family that has key roles in development, differentiation and prevention of senescence, but its metabolic actions remain largely unknown. Herein, we investigated the physiological role of p63 in glucose metabolism.

Design: We used cell lines and mouse models to genetically manipulate p63 in hepatocytes. We also measured p63 in the liver of patients with obesity with or without type 2 diabetes (T2D).

Results: We show that hepatic p63 expression is reduced on fasting. Mice lacking the specific isoform TAp63 in the liver (p63LKO) display higher postprandial and pyruvate-induced glucose excursions. These mice have elevated SIRT1 levels, while SIRT1 knockdown in p63LKO mice normalises glycaemia. Overexpression of TAp63 in wild-type mice reduces postprandial, pyruvate-induced blood glucose and SIRT1 levels. Studies carried out in hepatocyte cell lines show that TAp63 regulates SIRT1 promoter by repressing its transcriptional activation. TAp63 also mediates the inhibitory effect of insulin on hepatic glucose production, as silencing TAp63 impairs insulin sensitivity. Finally, protein levels of TAp63 are reduced in obese persons with T2D and are negatively correlated with fasting glucose and homeostasis model assessment index.

Conclusions: These results demonstrate that p63 physiologically regulates glucose homeostasis.

Keywords: diabetes mellitus; diet; glucose metabolism; liver.


Conflict of interest statement

Competing interests: None declared.

Figures

Figure 1
Figure 1
Nutritional availability regulates hepatic p63. (A) p63 mRNA levels in the liver of wild-type (WT) mice fed ad libitum, fasted for 24 hours or refed (RF) for 24 hours after 24-hour fasting. (B) p63 mRNA levels in the liver of WT mice fed ad libitum (baseline) or fasted for 6 or 12 hours and refed for 30 min, 1 hour or 2 hours after overnight (12-hour) fasting. (C) p63 mRNA levels in THLE-2 cells maintained in complete medium (CM) (baseline) or starved in Krebs–Henseleit–HEPES buffer (KHH) for indicated times. (D) p63 mRNA levels in liver of mice subjected to a 60% caloric restriction (CR) for 4 days. (E) p63 mRNA levels in the liver of WT mice fed ad libitum, fasted 24 hours or fasted for 24 hours and fed with sugar. (F) p63 mRNA levels in THLE-2 cells maintained in CM or starved in KHH with or without glucose (10 mM). (G) p63 mRNA levels in THLE-2 cells maintained in CM or starved in KHH with or without glucose (10 mM) and 2-deoxy-d-glucose (10 mM). Expression of hipoxantina-guanina fosforibosiltransferasa (HPRT) served as loading control, and control values were normalised to 100%. Data are presented as mean±SE mean. *P<0.05, **p<0.01, ***p<0.001, using a Student’s t-test (B–D), or one way analysis of variancfollowed by a Bonferroni multiple comparison test (A, E–G).
Figure 2
Figure 2
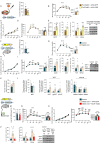
Hepatic TAp63 regulates postprandial glucose. (A) p63 mRNA levels in FloxTAp63 mice injected with AAV8-GFP or AAV8-Cre. (B) Blood glucose in FloxTAp63 mice injected with AAV8-GFP or AAV8-Cre and subjected to a pyruvate tolerance test (PTT). Food intake (C) and postprandial glucose levels (D) in FloxTAp63 mice injected with AAV8 expressing either GFP or CRE, refed (RF) with chow diet. (E) SIRT1 mRNA levels and hepatic protein levels of SIRT1, PCK1 and G6Pase. (F) p63 mRNA levels in control mice and Alfp-Cre FloxTAp63 (TAp63LKO) mice. (G) Blood glucose in TAp63LKO mice subjected to a PTT. Food intake (H) and postprandial glucose levels (I) in TAp63LKO mice RF with chow diet. (J) SIRT1 mRNA levels and hepatic protein levels of SIRT1, PCK1 and G6Pase. Area under curve (AUC) is also shown. (K) Glucose infusion rate in control mice and TAp63LKO. (L) Tissue glucose uptake from brown adipose tissue (BAT) white adipose tissue (WAT) and muscle in control mice and TAp63LKO. Subcutaneous adipose tissue (SAT), perigonadal visceral adipose tissue (pgVAT) and renal perivascular adipose tissue (rpVAT). (M) p63 mRNA levels in control and TAp63 LKO mice injected with AAV8-GPF and AAV8-TAp63. (N) Blood glucose in control and TAp63 LKO mice injected with AAV8-GPF and AAV8-TAp63 subjected to PTT. Food intake, postprandial blood glucose (O) and protein levels (P) of SIRT1, PCK1 and G6Pase in control and TAp63 LKO mice injected with AAV8-GPF and AAV8-TAp63. Expression of HPRT (qRT-PCR) and GAPDH (western blot) served as loading control, and control values were normalised to 100%. Data are presented as mean±SE mean. *P<0.05, **p<0.01, ***p<0.001, using a Student’s t-test (A, B, D–G, I, J, L), or one-way analysis of variance followed by a Bonferroni multiple comparison test (M–P). *Indicates differences compared with control group. #Indicates differences between AAV8-GFP and AAV8-CRE mice.
Figure 3
Figure 3
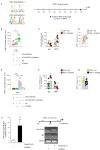
p63 binds to SIRT1. (A) Two putative motifs for TP63 found in the SIRT1 promoter using the JASPAR database. Eukaryotic Promoter Database identifies TP63 binding sites (black spots) in the SIRT1 promoter. (B) Luciferase reporter assay in AML12 cells transfected with the control si (si0) or sip63, and the control pTa-luciferase or pTA-202-Sirt1-luciferase for 48 hours, and luciferase activity was measured. (C) p63 and SIRT1 mRNA levels in AML12 cells transfected with si0 or sip63. (D) SIRT1 activity in AML12 cells transfected with si0 or sip63. Cells were kept in complete medium (CM). (E) Luciferase reporter assay in AML12 starved cells (kept in Krebs–Henseleit–HEPES buffer (KHH)) transfected with the control plasmid (p0) or a plasmid overexpressing Tap63 (pp63), and the control pTa-luciferase or pTA-202-Sirt1-luciferase for 24 hours. (F) p63 and SIRT1 mRNA levels in AML12 starved cells transfected with p0 or pp63. (G) SIRT1 activity in AML12 starved cells transfected with p0 or plasmid overexpressing TAp63. (H) Chromatin immunoprecipitation (ChIP) assay. Soluble chromatin prepared from AML 12 cells transfected with the pCDNA3 (empty vector) or the TAp63-FLAG vector for 48 hours was immunoprecipitated with an anti-FLAG antibody or control IgG. The immunoprecipitated DNA was amplified by PCR using primers amplifying the proximal binding site of p63 in the SIRT1 gene promoter. Intensity of the PCR product from three experiments was quantified. Expression of HPRT served as loading control, and control values were normalised to 100%. Data are presented as mean±SE mean. *P<0.05, **p<0.01, ***p<0.001, using a Student’s t-test (C, D, F–H), or one-way analysis of variance followed by a Bonferroni multiple comparison test (B, E).
Figure 4
Figure 4
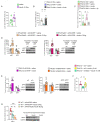
Hepatic TAp63 regulates gluconeogenesis via SIRT1. (A) Pyruvate tolerance test (PTT), glucose tolerance test (GTT) and insulin tolerance test (ITT) in control or TAp63LKO mice after being injected with sh-luciferase or sh-SIRT1. (B) Postprandial glucose levels in control and TAp63LKO mice after being injected with sh-luciferase or sh-SIRT1. (C) SIRT1, PCK1 and G6Pase protein levels in control or p63 LKO mice after being injected with sh-luciferase or sh-SIRT1 after refeeding (RF). Area under curve (AUC) is also shown. (D) ALT and AST levels in control or TAp63LKO mice after being injected with sh-luciferase or sh-SIRT1. (E) SIRT1 mRNA levels in mice after being injected with sh-luciferase or sh-SIRT1. Expression HPRT (qRT-PCR) of GAPDH (western blot) served as loading control, and control values were normalised to 100%. Data are presented as mean±SE mean. *P<0.05, **p<0.01, ***p<0.001, using one-way analysis of variance followed by a Bonferroni multiple comparison test. *Indicates differences compared with control group. #Indicates differences between sh-luciferase and sh-SIRT1 mice.
Figure 5
Figure 5
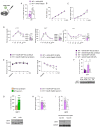
Hepatic TAp63 overexpression worsens gluconeogenesis. (A) p63 mRNA levels in wild-type (WT) mice injected with AAV8-GFP or AAV8-TAp63. Food intake (B) and cumulative body weight gain (C) in WT mice injected with AAV8-GFP or AAV8-TAp63. (D) Pyruvate tolerance test (PTT), glucose tolerance test (GTT) and insulin tolerance test (ITT) in WT mice injected with either AAV8-GFP or AAV8-TAp63. (E) Body weight and blood glucose in mice fed ad libitum or subjected to a 60% caloric restriction (CR). (F) SIRT1 protein levels in each of the groups described above. (G) SIRT1 protein levels in WT mice fed ad libitum or fasted 24 hours. Blood glucose (H) and SIRT1 protein levels (I) in WT mice injected with AAV8-GFP or AAV8-TAp63. Expression of HPRT (qRT-PCR) or GAPDH (western blot) served as loading controls; control values were normalised to 100%. Data are presented as mean±SE mean. *P<0.05, **p<0.01, ***p<0.001, using a Student’s t-test (A, D, E, G–I), or one-way analysis of variance followed by a Bonferroni multiple comparison test (F). AUC, area under curve.
Figure 6
Figure 6
Hepatic TAp63 mediates insulin actions. (A) p63 mRNA levels in mice injected with saline or insulin 5 U/kg into the cava vein. (B) p63 mRNA levels in THLE-2 cells kept in complete medium (CM), KHH or KHH with insulin (10 nM). (C) p63 mRNA levels in THLE-2 cells kept in CM, KHH, KHH with insulin (10 nM) or KHH with insulin (10 nM) and LY294002 (10 nM). (D) Protein levels of pAKT and SIRT1 in FloxTAp63 mice injected AAV8 expressing either GFP or CRE treated with saline or insulin into the cava vein. (E) Protein levels of pAKT and SIRT1 in THLE-2 cells treated with saline or insulin (10 nM). (F) Glucose production in THLE-2 cells transfected with si0 or sip63 in the presence or absence of insulin (10 nM). (G) SIRT1 protein levels in wild-type mice injected with a virus encoding GFP or overexpressing TAp63. Expression of HPRT (qRT-PCR) or GAPDH (western blot) served as loading control, and control values were normalised to 100%. Data are presented as mean±SE mean. *P<0.05, **p<0.01, ***p<0.001, using a Student’s t-test (A, D, E), or one-way analysis of variance followed by a Bonferroni multiple comparison test (B, C, F, G).
Figure 7
Figure 7
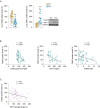
Hepatic TAp63 is associated with human type 2 diabetes. (A) Hepatic TAp63 and SIRT1 protein levels in patients with normoglycaemia (NG) or type 2 diabetes (T2D). (B) Correlations between p63 and fasting glucose, oral glucose tolerance test (OGTT) and homeostasis model assessment (HOMA) index. (C) Correlations between TAp63 protein levels and SIRT1 protein levels. Expression of GAPDH served as loading control, and control values were normalised to 100%. Data are presented as mean±SE mean. ***p<0.001, using a Student’s t-test (A).

Comment in

References

    1. Yang A, Kaghad M, Wang Y, et al. . P63, a p53 homolog at 3q27-29, encodes multiple products with transactivating, death-inducing, and dominant-negative activities. Mol Cell 1998;2:305–16. 10.1016/S1097-2765(00)80275-0 - DOI - PubMed
    1. Schmale H, Bamberger C. A novel protein with strong homology to the tumor suppressor p53. Oncogene 1997;15:1363–7. 10.1038/sj.onc.1201500 - DOI - PubMed
    1. Khoury MP, Bourdon J-C. The isoforms of the p53 protein. Cold Spring Harb Perspect Biol 2010;2:a000927. 10.1101/cshperspect.a000927 - DOI - PMC - PubMed
    1. Candi E, Dinsdale D, Rufini A, et al. . Tap63 and DeltaNp63 in cancer and epidermal development. Cell Cycle 2007;6:274–84. 10.4161/cc.6.3.3797 - DOI - PubMed
    1. Ihrie RA, Bronson RT, Attardi LD. Adult mice lacking the p53/p63 target gene Perp are not predisposed to spontaneous tumorigenesis but display features of ectodermal dysplasia syndromes. Cell Death Differ 2006;13:1614–8. 10.1038/sj.cdd.4401871 - DOI - PubMed

Publication types