

Review
doi: 10.1101/cshperspect.a041095.
Cell Death in Development
Affiliations
- PMID: 35581003
- PMCID: PMC9121905
- DOI: 10.1101/cshperspect.a041095
Item in Clipboard
Review
Cell Death in Development
Cold Spring Harb Perspect Biol.
.
No abstract available
Figures
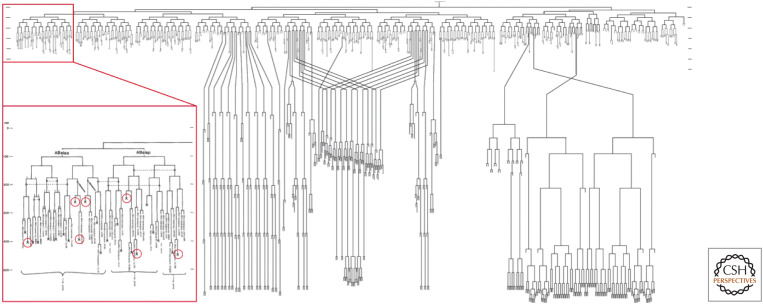
Developmental plan of the nematode Caenorhabditis elegans. During development, each cell that arises by cell division undergoes a set process of further division, differentiation, or cell death. (Inset) Part of the developmental plan, with seven cell deaths circled. (Reprinted from Sulston et al. 1983, ©1983 with permission from Elsevier.)
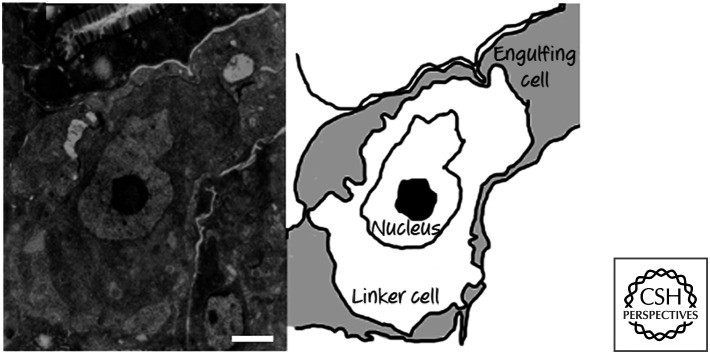
Necrotic-type linker cell death. In the micrograph (left), note that the dying linker cell has no features of apoptosis. (Reprinted from Abraham et al. 2007, ©2007 with permission from Elsevier.)
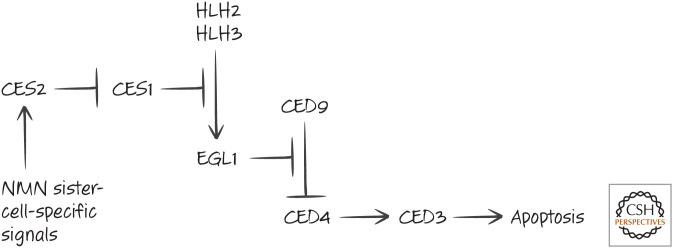
Neurosecretory motor neuron (NMN) sister cell death.
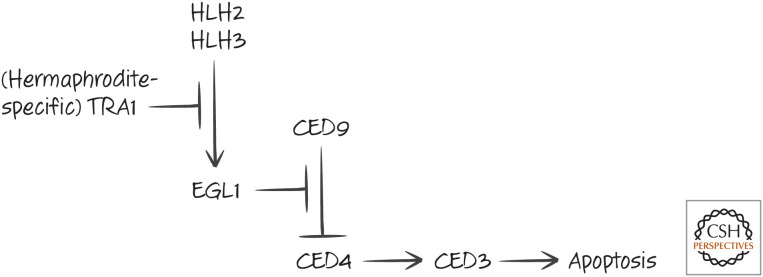
Hermaphrodite-specific neuron (HSN) cell death in males.
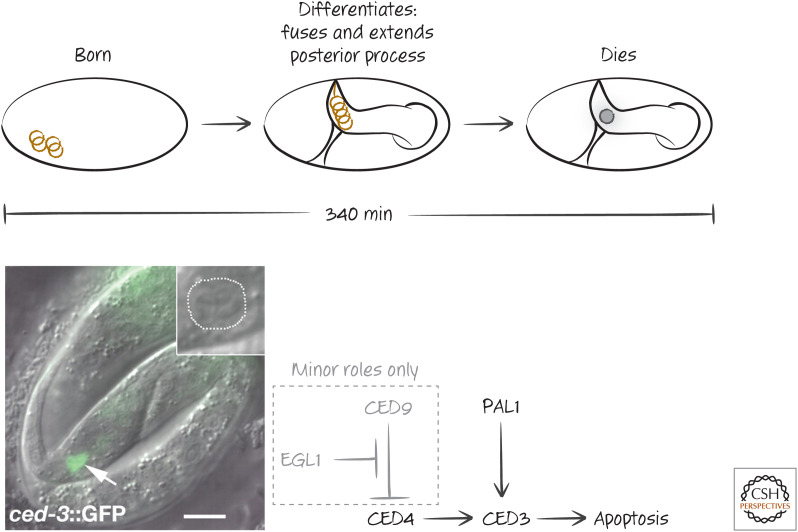
Cell death in the tail-spike cell. (Top) Timing of the appearance (“born”), differentiation, and death of the tail-spike cell during embryogenesis. (Lower left) Image shows expression of CED3 (arrow) in the tail-spike cell in an embryo in which the ced3 gene is replaced with the gene for green fluorescent protein (and is therefore under the same regulation as ced3). (Inset) Death of the tail-spike cell in a wild-type embryo at the same stage. (Lower right) Schematic of the genetic pathway. Death in this cell is controlled mainly by the transcription factor PAL-1, which controls the expression of CED3, with little contribution from CED9 or EGL1. (Reprinted from Maurer et al. 2007, ©2007 with permission from The Company of Biologists.)
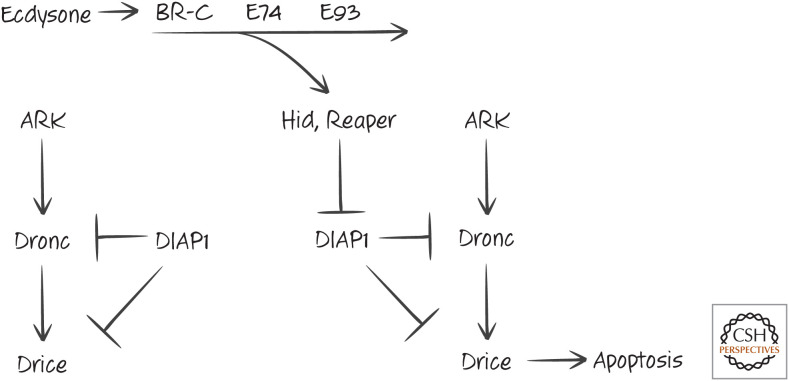
Activation of the apoptosis pathway by the hormone ecdysone. By inhibiting DIAP1, the proteins Hid and Reaper promote the cell death pathway leading to activation of the executioner caspase Drice.
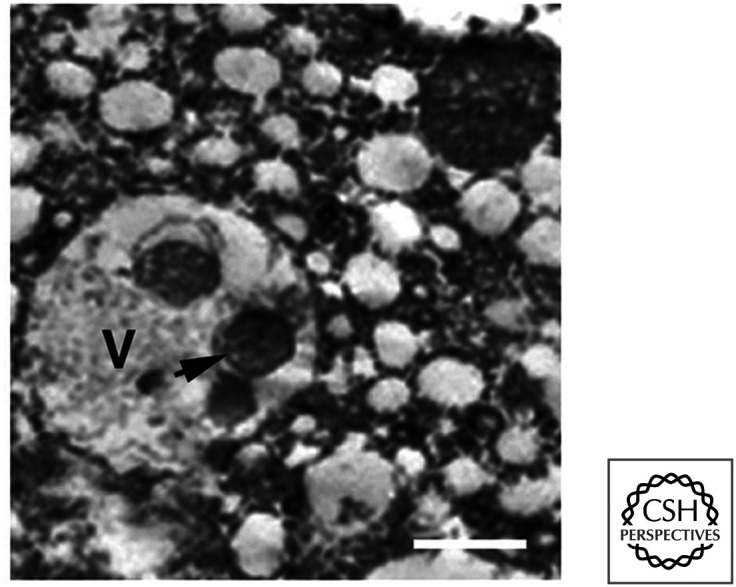
Type II death in the Drosophila salivary gland. Autophagosomes in dying cells (arrow) are abundant. V, vacuole-containing autophagosomes. (Reprinted from Lee and Baehrecke 2001, ©2001 with permission from The Company of Biologists.)
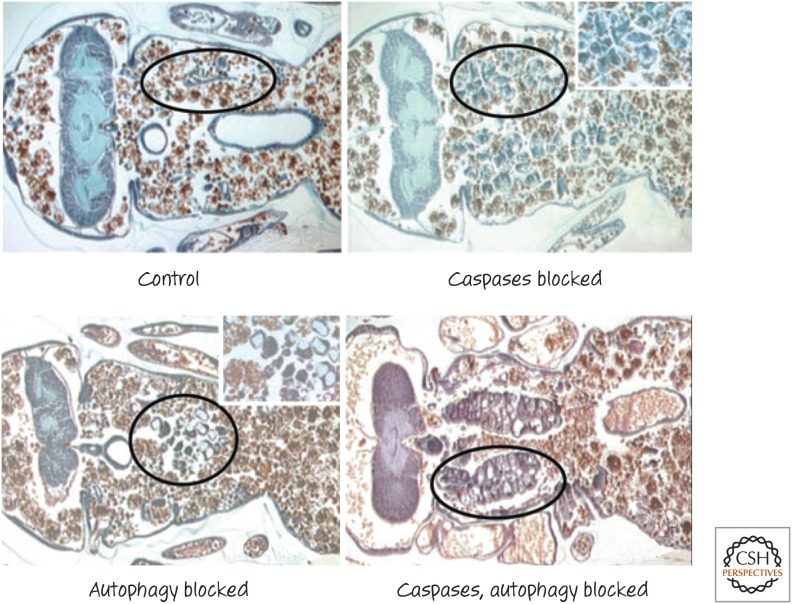
Cell death in the metamorphosing salivary gland of Drosophila. Inhibition of either caspases or autophagy in the animal promotes cell survival (circled areas, magnified in insets); inhibition of both produces additive effects. (Reprinted from Neufeld and Baehrecke 2008, ©Landes Bioscience.)

Cell death in developing chick and duck autopods. Dying cells in the autopods of both birds stain with red dye at the web tips. An artifact creates the more general staining in the duck interdigital webs. (Left, Reproduced with permission from Zuarte-Luís and Hurlé 2002; right, reprinted from Gañan et al. 1998, ©1998 with permission from Elsevier.)
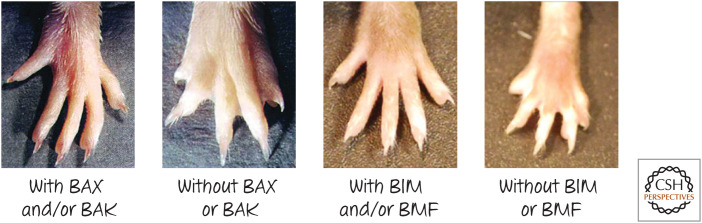
Webbed feet in mice lacking BAX or BAK, and mice lacking BIM or BMF, compared with mice expressing either (or both) of the genes. (Left two panels, Reprinted from Lindsten et al. 2000, ©2000 with permission from Elsevier; right two panels, reprinted from Hubner et al. 2010, ©2010 with permission from American Society for Microbiology.)
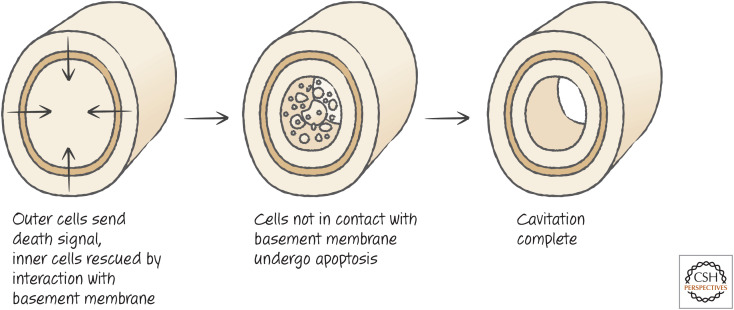
A basic plan depicting the regulatory signaling events leading to hollowing/cavitation. (Adapted from Coucouvanis and Martin 1995, ©1995 with permission from Elsevier.)
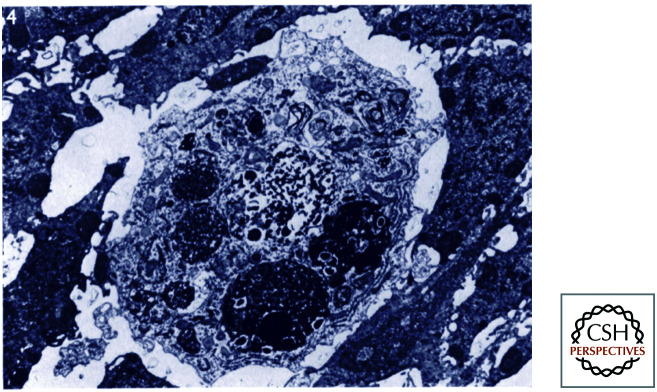
Frog metamorphosis and cell death. An apoptotic cell in the tail of a metamorphosing tadpole. (Reprinted from Kerr et al. 1974, ©1974 with permission from The Company of Biologists.)
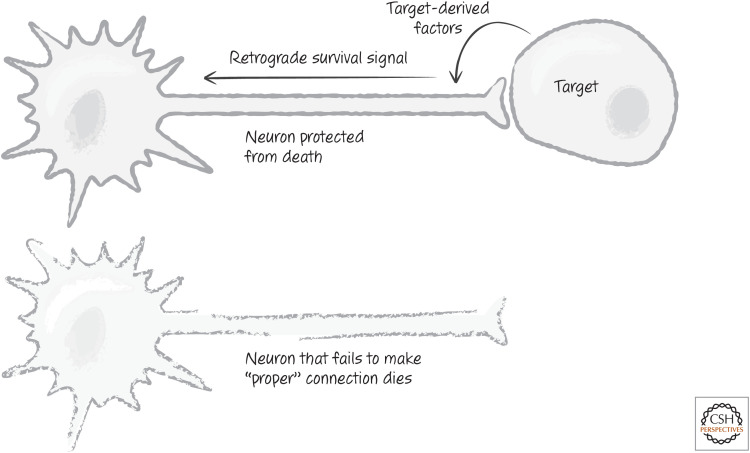
Cell death as a mechanism of neuronal selection. Neurons that fail to contact the appropriate target cell do not receive factors that promote their survival.
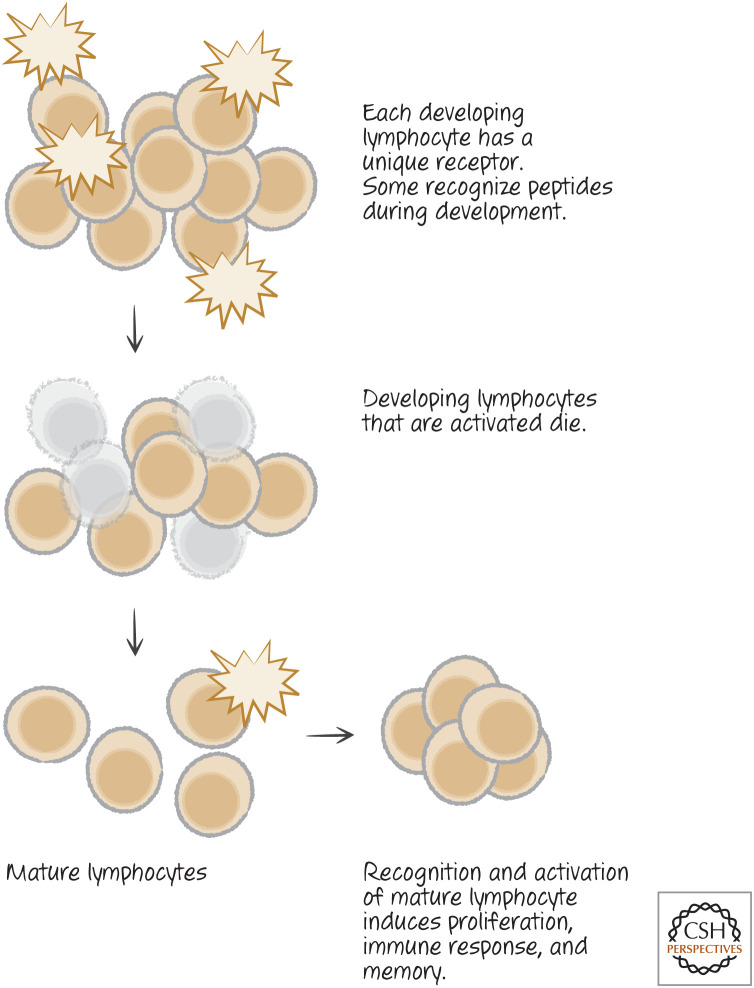
The concept of negative selection. Cell death of activated lymphocytes during their development produces emergent self–nonself discrimination.
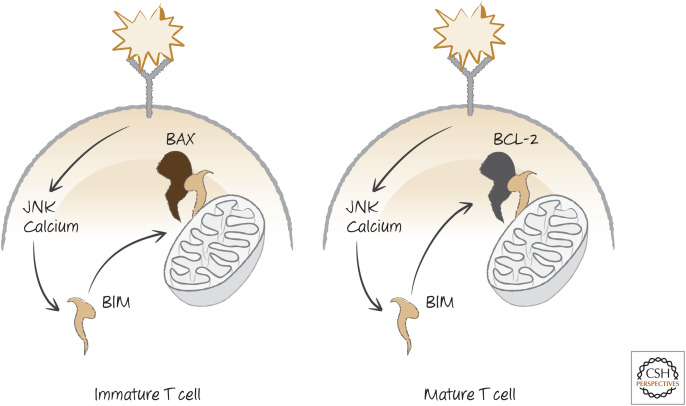
BIM and negative selection in T cells. T-cell activation induces JNK and elevated calcium, both of which stabilize BIM. In immature T cells, BIM induces apoptosis, but in mature T cells, this is blocked by BCL-2.
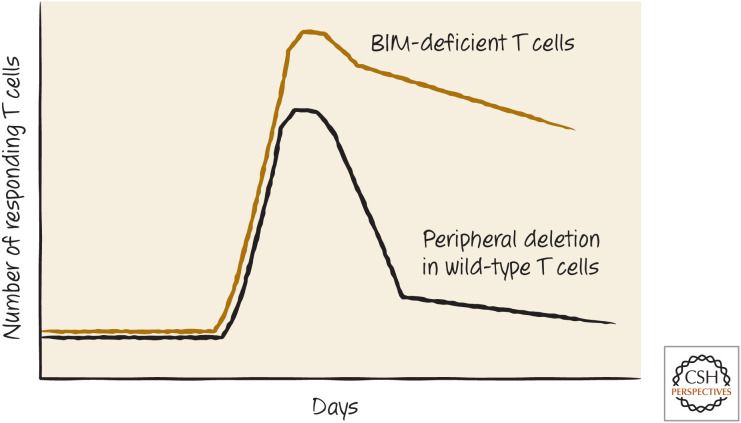
Peripheral deletion and BIM. The absence of the BH3-only protein BIM inhibits the peripheral deletion of T cells that would otherwise reduce the numbers of responding cells.
References
FIGURE CREDITS
-
- Kerr JFR, Harmon B, Searle J. 1974. An electron-microscope study of cell deletion in the anuran tadpole tail during spontaneous metamorphosis with special reference to apoptosis of striated muscle fibres. J Cell Sci 14: 571–585. - PubMed
Publication types
MeSH terms
LinkOut - more resources
Full Text Sources