. 2022 May 17;13(1):2709.
doi: 10.1038/s41467-022-30525-y.

Enhancers regulate 3' end processing activity to control expression of alternative 3'UTR isoforms

Affiliations

Enhancers regulate 3' end processing activity to control expression of alternative 3'UTR isoforms

Buki Kwon et al. Nat Commun. .

Abstract

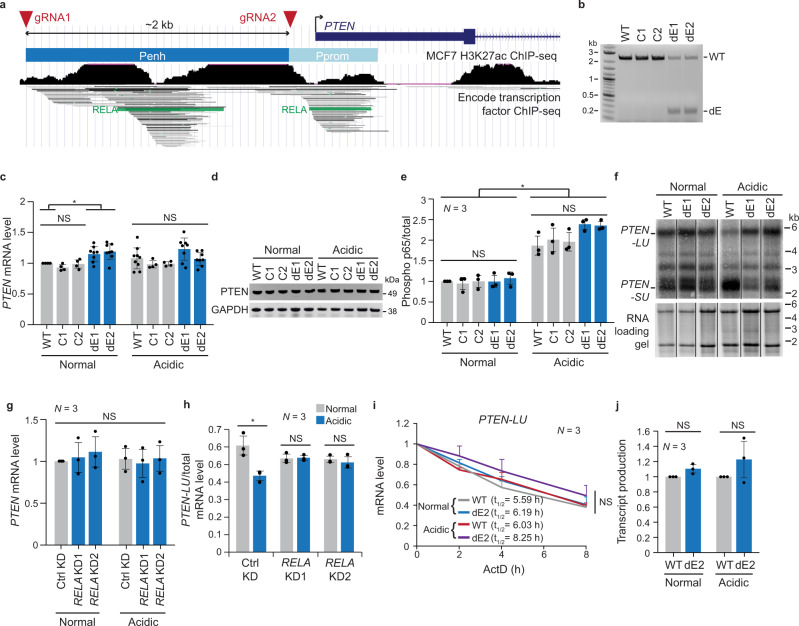
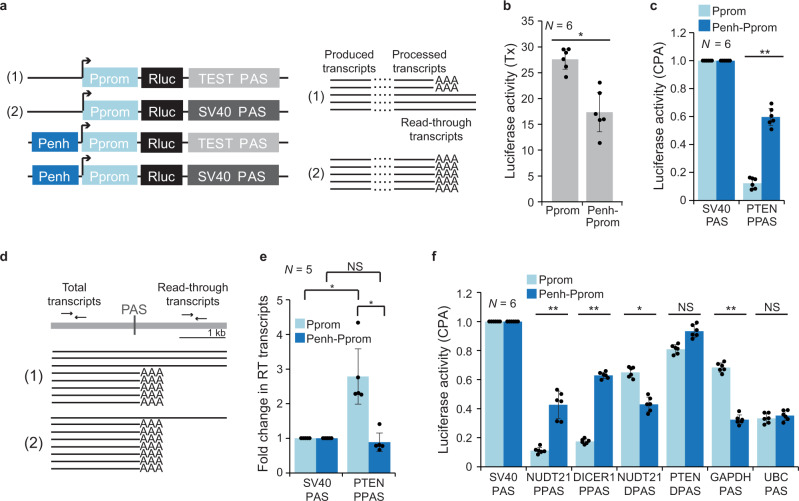
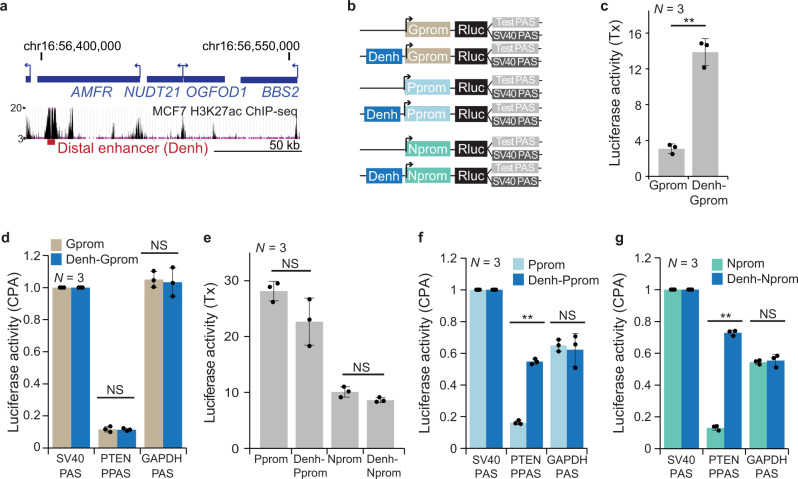
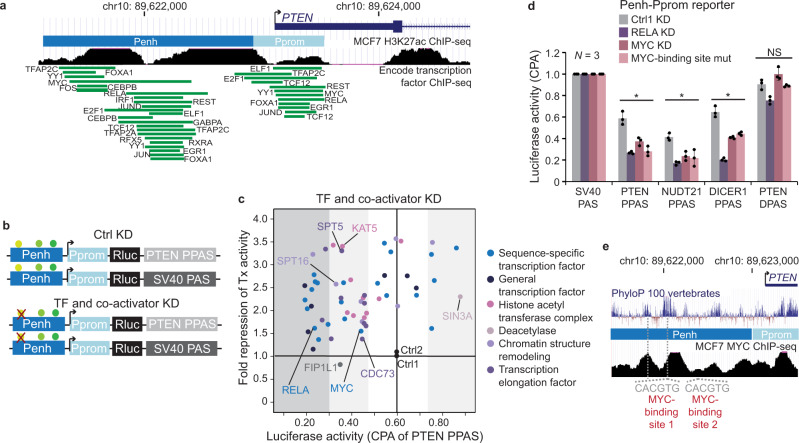
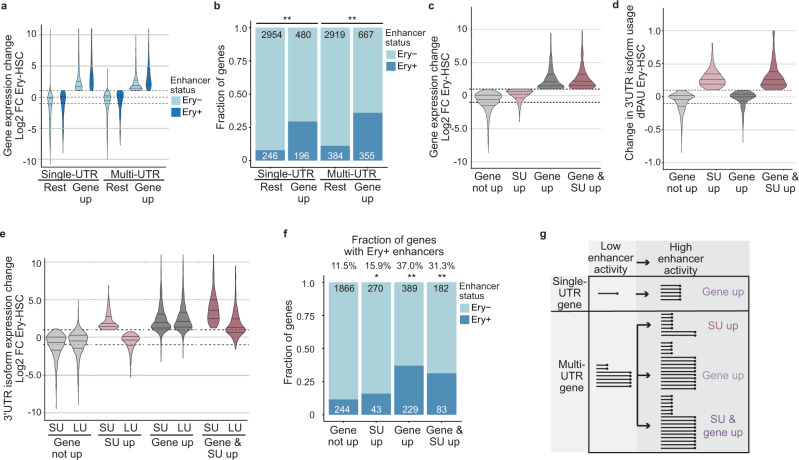
Multi-UTR genes are widely transcribed and express their alternative 3'UTR isoforms in a cell type-specific manner. As transcriptional enhancers regulate mRNA expression, we investigated if they also regulate 3'UTR isoform expression. Endogenous enhancer deletion of the multi-UTR gene PTEN did not impair transcript production but prevented 3'UTR isoform switching which was recapitulated by silencing of an enhancer-bound transcription factor. In reporter assays, enhancers increase transcript production when paired with single-UTR gene promoters. However, when combined with multi-UTR gene promoters, they change 3'UTR isoform expression by increasing 3' end processing activity of polyadenylation sites. Processing activity of polyadenylation sites is affected by transcription factors, including NF-κB and MYC, transcription elongation factors, chromatin remodelers, and histone acetyltransferases. As endogenous cell type-specific enhancers are associated with genes that increase their short 3'UTRs in a cell type-specific manner, our data suggest that transcriptional enhancers integrate cellular signals to regulate cell type-and condition-specific 3'UTR isoform expression.


Conflict of interest statement

The authors declare no competing interests.

Figures

Fig. 1
Fig. 1. The PTEN enhancer induces a 3′UTR isoform switch of endogenous PTEN.
a UCSC genome browser snapshot showing the PTEN genomic locus around the transcriptional start site (arrow). The PTEN enhancer (Penh) was deleted using the indicated guide RNAs (red arrow heads). Among transcription factor binding sites identified by ChIP-seq, RELA binding sites are highlighted. PTEN promoter, Pprom. b Genotyping PCR was performed in parental MCF7 cells (WT), wild-type clones (C1, C2), and heterozygous enhancer deletion clones (dE1, dE2) with a primer pair flanking the deleted region. Shown is an agarose gel with the indicated PCR products. n = 3 biologically independent experiments. c PTEN mRNA expression measured by RT-qPCR in the indicated samples. Data are shown as mean ± std. of n = 4 biologically independent experiments for C1 and C2 and n = 8 biologically independent experiments for WT, dE1, and dE2 after normalization to RPL19. One-way ANOVA with Tukey’s post-hoc test was performed. *P = 0.0048 between WT and dE1 and P = 0.0015 between WT and dE2; NS, not significant. d Representative western blot showing steady-state PTEN protein levels in the indicated samples. GAPDH serves as loading control. n = 3 biologically independent experiments. e Steady-state levels of phosphorylated p65 (S536) and total p65 were determined by western blot for the indicated samples and normalized to the levels of WT in the normal condition. The fraction of phosphorylated p65 over total p65 is shown as mean ± std of n = 3 biologically independent experiments. One-way ANOVA with Tukey’s post-hoc test was performed. *P = 5 × 10−9; NS not significant. f Representative northern blot showing PTEN mRNA isoforms in the indicated samples. The RNA gel is shown as loading control. SU short 3′UTR; LU long 3′UTR. n = 3 biologically independent experiments. g As in (C), but for ctrl KD and RELA KD samples. Data are shown as mean ± std of n = 3 biologically independent experiments. One-way ANOVA was performed. NS not significant. h Steady-state levels of PTEN-LU and total PTEN mRNA were measured by RT-qPCR in the indicated samples. The fraction of PTEN-LU over total PTEN mRNA is shown as mean ± std of n = 3 biologically independent experiments. Two-tailed t-test for independent samples was performed. *P = 0.0156; NS not significant. i Quantification of PTEN-LU mRNA expression at four time points after inhibition of transcription with actinomycin D (ActD) in the indicated samples. The values were obtained by RT-qPCR, normalized to the 0 h time point and are shown as mean ± std of n = 3 biologically independent experiments. Half-life (t1/2) of PTEN-LU mRNA is shown for each sample. One-way ANOVA was performed at each time point. NS not significant. j Metabolic labeling with 4-thiouridine (4sU) was used to enrich newly transcribed mRNAs. The newly transcribed RNAs were thiol-alkylated and biotinylated, followed by Streptavidin pull-down. The fraction of newly transcribed over total PTEN transcripts is shown for the indicated samples and was measured using RT-qPCR with a primer pair in the first intron. Data are shown as mean ± std of n = 3 biologically independent experiments. Two-tailed t-test for independent samples was performed. NS not significant. Source data for figures (bj) are provided as a Source Data file.
Fig. 2
Fig. 2. The PTEN enhancer increases CPA activity of proximal PAS.
a Schematic of luciferase reporter constructs to investigate enhancer-dependent transcriptional activity and CPA activity. The transcription start site is indicated by the arrow. Rluc, Renilla luciferase. Schematic showing the expected produced and processed reporter transcripts for the indicated constructs. In reporter (2), the strong SV40 PAS cleaves all produced transcripts (indicated by AAA to denote a poly(A) tail) and measures transcriptional activity. In reporter (1) a weaker PAS does not cleave all produced transcripts, thus resulting in read-through transcripts. The relative CPA activity of a test PAS corresponds to the ratio of the luciferase activities obtained from the test PAS reporter over the SV40 PAS reporter when transcribed from the same promoter. b Transcriptional activity (Tx) of the Pprom reporter in the presence (Penh-Pprom) or absence (Pprom) of the PTEN enhancer obtained by luciferase activity of the SV40 PAS reporters. Transcriptional activity represents renilla luciferase activity that was normalized by firefly luciferase activity. Shown is mean ± std of n = 6 biologically independent experiments. Tx, transcription. Two-tailed t-test for independent samples was performed. *P = 0.002. c Luciferase activity corresponding to the relative CPA activity of the PPAS of PTEN when transcribed from the PTEN promoter in the absence or presence of the PTEN enhancer. Shown is mean ± std of n = 6 biologically independent experiments. Two-tailed t-test for independent samples was performed. **P = 1 × 10−8; NS not significant. d Schematic for measuring read-through transcription of the reporter constructs shown in (a). A primer pair located upstream of the PAS measures the total number of transcripts produced, whereas a primer pair located downstream of the PAS measures the number of read-through transcripts. e Fold change in read-through (RT) transcripts obtained from the indicated reporter constructs. Shown is mean ± std of n = 5 biologically independent experiments. Two-tailed t-test for independent samples was performed. Pprom: SV40 vs PTEN PPAS *P = 0.002; Penh-Pprom: SV40 vs PTEN PPAS, P = 0.42; PTEN PPAS: Pprom vs Penh-Pprom, *P = 0.002. f As in (c), but additional PAS are shown. DPAS, distal PAS. Shown is mean ± std of n = 6 biologically independent experiments. Two-tailed t-test for independent samples was performed. **P = 1 × 10⁻⁶; *P = 0.001; NS not significant. Source data for figures (b, c, e, and f) are provided as a Source Data file.
Fig. 3
Fig. 3. A distal enhancer regulates CPA activity of proximal PAS.
a UCSC genome browser snapshot showing the genomic context of the NUDT21 gene locus. The region with the local maximum of acetylated H3K27 measured by ChIP-seq in MCF7 cells was defined as distal enhancer (Denh). b Schematic of reporter constructs used to investigate enhancer-dependent CPA activity in the context of three promoters. The GAPDH promoter (Gprom) drives a single-UTR gene, whereas the Pprom and NUDT21 (Nprom) promoters drive multi-UTR genes. Shown as in Fig. 2a. c Enhancer-dependent transcriptional activity of the Gprom shown as in Fig. 2b. Data are shown as mean ± std of n = 3 biologically independent experiments. Two-tailed t-test for independent samples was performed. **P = 0.0005. d Enhancer-dependent CPA activity in the context of the Gprom shown as in Fig. 2c. Data are shown as mean ± std of n = 3 biologically independent experiments. Two-tailed t-test for independent samples was performed. NS, not significant. e As in (c), but enhancer-dependent transcriptional activity of two multi-UTR gene promoters is shown. Data are shown as mean ± std of n = 3 biologically independent experiments. Two-tailed t-test for independent samples was performed. NS not significant. f As in (d), but enhancer-dependent CPA activity in the context of the Pprom is shown. Data are shown as mean ± std of n = 3 biologically independent experiments. Two-tailed t-test for independent samples was performed. **P = 1 × 10−8. g As in (d), but enhancer-dependent CPA activity in the context of the Nprom is shown. Data are shown as mean ± std of n = 3 biologically independent experiments. Two-tailed t-test for independent samples was performed. **P = 1 × 10−5. Source data for figures (cg) are provided as a Source Data file.
Fig. 4
Fig. 4. Transcription and transcription elongation factors are widespread regulators of CPA activity.
a As in Fig. 1a but shown are the binding sites of transcription factors that were knocked-down individually. b Schematic of reporter constructs to identify transcription factors (TFs) and co-activators that regulate CPA activity in the context of the Penh-Pprom reporter. Ctrl KD, control knock-down. c Summary of PTEN PPAS CPA activity and fold repression of Tx activity obtained in the shRNA screen. Shown is the mean in ctrl KD and transcription factor KD samples for the Penh-Pprom reporter. The values are reported in Table 1 and the replicates are shown in Supplementary Fig. 4a, b. The shaded areas denote the extent of change in CPA activity in TF KD samples (white, change is not significant; gray, significant change; dark gray, more than 0.30 change in CPA activity). d CPA activity of additional PAS when transcribed from the Penh-Pprom reporter. Shown is mean ± std of n = 3 biologically independent experiments after transcription factor KD or mutation of MYC-binding sites (MYC-binding site mut) in the Penh. Two-tailed t-test for independent samples was performed; *P < 0.03; NS not significant. Source data are provided as a Source Data file. e UCSC genome browser snapshot showing the PTEN gene locus with ChIP-seq data for MYC and the sequence conservation track of 100 vertebrates. The position of the two conserved MYC-binding sites (canonical E-boxes) are indicated.
Fig. 5
Fig. 5. Cell type-specific enhancers are associated with genes that upregulate SU isoforms.
a Fold change (FC) in gene expression between erythroblasts (Ery) and hematopoietic stem cells (HSC) is shown for single- and multi-UTR genes separately. The genes that associate with erythroblast-specific enhancers (Ery+) are shown separately. Violin plots denote median, 25th and 75th percentiles. The number of genes in each group is shown in (b). b Fraction of genes associated with erythroblast-specific enhancers (Ery+) in the groups from (a). Chi-square tests were performed. Single-UTR genes: X2 = 249, **P  <  10−16. Multi-UTR genes: X2 = 293, **P < 10−16. Ery-, genes without an erythroblast-specific enhancer in the vicinity. c Multi-UTR genes were separated based on their gene expression change using DESeq2 with a minimum FC > 2 into two groups (“gene up” and “gene not up”). These groups were further subdivided based on significant upregulation of their SU isoforms (“SU up” requires an absolute and relative increase (TPM FC > 2 and dPAU > 0.1, DEXseq, P < 0.05, 10% FDR), whereas the control group requires SU isoforms not to be upregulated (TPM FC < 2 and dPAU < 0.1, DEXseq, P > 0.05). FC in gene expression in the indicated groups is shown as in (a). The number of genes in each group is shown in (f). The PAU is a measure introduced by QAPA and indicates the relative usage of a 3′UTR isoform. Here, we only consider SU isoform usage for the PAU. dPAU is the differential PAU. d Change in 3′UTR isoform ratio as determined by a change in PAU for the groups from (c). e FC in 3′UTR isoform expression shown for SU and LU isoforms in the groups from (c). f Fraction of genes associated erythroblast-specific enhancers (Ery+) in the groups from (c). Chi-square tests were performed in comparison with the “gene not up” group: “SU up”, X2 = 4.3, *P = 0.038; “gene up”, X2 = 215, **P  <  10−16; “gene and SU up”, X2 = 75.7, **P  <  10−16. g Model showing enhancer-mediated increase in gene expression for single-UTR genes (top). Enhancer-mediated effect for multi-UTR genes can result in increased 3′UTR isoform expression, increased gene expression or an increase in both parameters. The lines with the black dots signify processed transcripts that contain a poly(A) tail.

Similar articles

Cited by

References

    1. Levine M, Tjian R. Transcription regulation and animal diversity. Nature. 2003;424:147–151. doi: 10.1038/nature01763. - DOI - PubMed
    1. Levine M, Cattoglio C, Tjian R. Looping back to leap forward: transcription enters a new era. Cell. 2014;157:13–25. doi: 10.1016/j.cell.2014.02.009. - DOI - PMC - PubMed
    1. Lianoglou S, Garg V, Yang JL, Leslie CS, Mayr C. Ubiquitously transcribed genes use alternative polyadenylation to achieve tissue-specific expression. Genes Dev. 2013;27:2380–2396. doi: 10.1101/gad.229328.113. - DOI - PMC - PubMed
    1. Pennacchio LA, et al. In vivo enhancer analysis of human conserved non-coding sequences. Nature. 2006;444:499–502. doi: 10.1038/nature05295. - DOI - PubMed
    1. Visel A, et al. ChIP-seq accurately predicts tissue-specific activity of enhancers. Nature. 2009;457:854–858. doi: 10.1038/nature07730. - DOI - PMC - PubMed

Publication types

MeSH terms