. 2022 May 17;12(1):8150.
doi: 10.1038/s41598-022-12079-7.

Sportomics suggests that albuminuria is a sensitive biomarker of hydration in cross combat

Affiliations

Sportomics suggests that albuminuria is a sensitive biomarker of hydration in cross combat

Luis C O Gonçalves et al. Sci Rep. .

Abstract

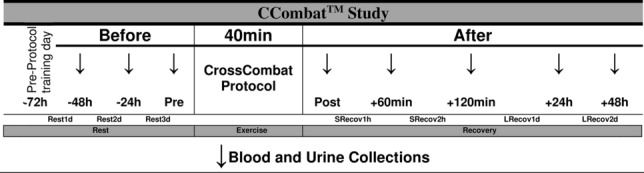
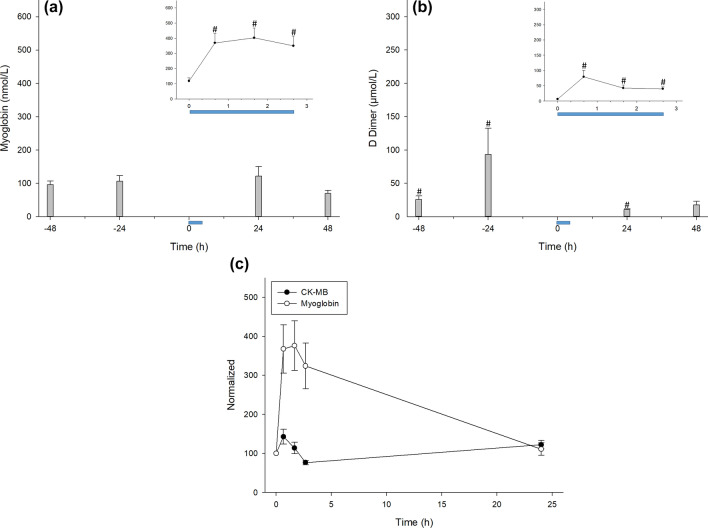
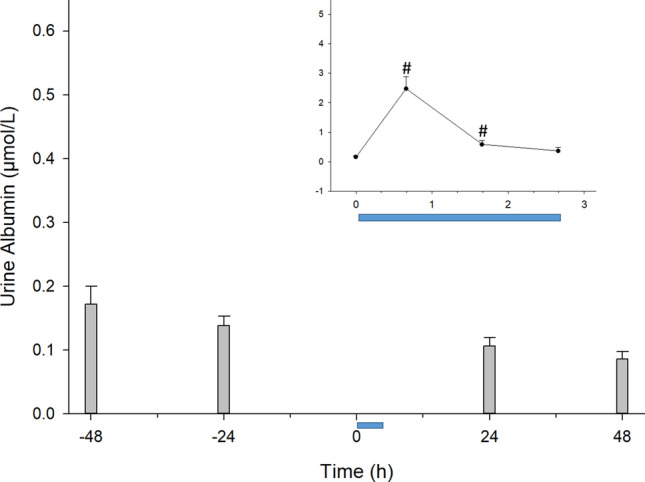
We have been using sportomics to understand hypermetabolic stress. Cross Combat (CCombat) has recently been initiated as a high-intensity functional training method inspired by CrossFit. We used a CCombat session to induce metabolic stress and evaluated its effects on hydration and kidney function. Blood samples were collected from 16 elite-level professional male athletes engaged in training sessions over a 96-h protocol. Blood myoglobin increased by ~ 3.5-fold (119 ± 21 to 369 ± 62 nmol/L; p = .001) in response to the protocol, returning to the pre-exercise level within 48 h. Furthermore, D-dimer levels increased from 6.5 ± 0.6 to 79.4 ± 21.3 μmol/L (p < .001) in response to exercise decreasing during recovery with high variability among the studied athletes. Albuminemia and creatininemia increased ~ 10% and cystatin C increased ~ 240% (1.7 ± 0.1 to 5.7 ± 0.5 mg/L; p < .001; effect size = 2.4) in response to the protocol. We measured albuminuria (HuA) to assess kidney permeability to albumin caused by exercise. HuA increased ~ 16-fold (0.16 ± 0.03 to 2.47 ± 0.41 μmol/L; p < .001; effect size = 1.4) in response to exercise, dropping and reaching basal levels during 48 h. Here, we suggest that microalbuminuria can be used as an early, sensitive, easy, and inexpensive biomarker to evaluate hydration status changes during intensive exercise, decreasing chronic impairment in renal function.


Conflict of interest statement

The authors declare no competing interests.

Figures

Figure 1
Figure 1
Experimental design. The subjects rested for 3 days before the CrossCombat (CCombat) protocol when samples were collected for 96 h, starting 2 days before (− 48 h; − 24 h) until 2 days after (24 h; 48 h) the exercise protocol (Pre; Post; + 60 min; + 120 min). The CCombat protocol started from 07:00 to 09:00, splitting the athletes to avoid overlapping the venipuncturist and securing immediate sample collections. Advanced-level CCombat training was performed for 40 min. Arrows indicate the eight-blood and urine collections times.
Figure 2
Figure 2
Volemia did not change in response to exercise. #Pre vs. − 48 h: p = .010; effect size = 1.0; statistical power = 0.94. The blue bar represents the CCombat protocol in scale in both graphs. AVG ± SE.
Figure 3
Figure 3
The CCombat protocol promoted an increase in both serum lactate and urate without changing glycemia or uremia. (a) Glucose; (b) lactate #Pre vs. Post: p < .001; effect size = 1.9; statistical power = 0.99; (c) urate #Pre vs. Post: p = .017; effect size = 0.9; statistical power = 0.92; #Pre vs. + 60 min: p = .004; effect size = 1.0; statistical power = 0.97; #Pre vs. + 120 min: p = .005; effect size = 1.1; statistical power = 0.98; (d) urea and (e) cortisol #Pre vs. − 48 h: p = .010; effect size = 1.0; statistical power = 0.94; #Pre vs. + 60 min: p = .031; effect size = 0.8; statistical power = 0.83; #Pre vs. + 120 min: p < .001; effect size = 1.5; statistical power = 0.99. The blue bar represents the CCombat protocol in scale in both graphs. AVG ± SE.
Figure 4
Figure 4
The microinjury muscle biomarkers myoglobin and CK-MB as D-dimer increased in response to the CCombat protocol. (a) Myoglobin #Pre vs. Post: p = .001; effect size = 1.1; statistical power = 0.98; #Pre vs. + 60 min: p < .001; effect size = 1.2; statistical power = 0.99; #Pre vs. + 120 min: p < .001; effect size = 1.0; statistical power = 0.96; (b) d-dimer #Pre vs. − 48 h: p < .001; effect size = 0.9; statistical power = 0.94; #Pre vs. − 24 h: p < .001; effect size = 0.5; statistical power = 0.54; #Pre vs. Post: p < .001; effect size = 0.8; statistical power = 0.89; #Pre vs. + 60 min: p = .002; effect size = 0.9; statistical power = 0.93; #Pre vs. + 120 min: p < .001; effect size = 1.3; statistical power = 0.99; #Pre vs. + 24 h: p = .010; effect size = 1.0; statistical power = 0.95 and (c) comparison of CK-MB and d-dimer concentrations up to 24 h after the protocol (Pre; Post; + 60 min; 120 min and + 24 h). The blue bar represents the CCombat protocol in scale in both graphs. AVG ± SE.
Figure 5
Figure 5
Both serum creatinine and cystatin C increased after the CCombat protocol, followed by serum albumin. (a) Serum albumin (HSA) #Pre vs. + 60 min: p = .008; effect size = 0.9; statistical power = 0.93; #Pre vs. + 120 min: p = .001; effect size = 1.2; statistical power = 0.99; (b) serum creatinine #Pre vs. Post: p = .047; effect size = 0.7; statistical power = 0.80; (c) cystatin C #Pre vs. − 48 h: p < .001; effect size = 2.4; statistical power = 1.00; #Pre vs. Post: p < .001; effect size = 2.4; statistical power = 1.00; #Pre vs. + 24 h: p = .007; effect size = 0.8; statistical power = 0.89; #Pre vs. + 48 h: p < .001; effect size = 2.2; statistical power = 1.00 and (d) normalized HSA, creatinine and CysC. The blue bar represents the CCombat protocol in scale in both graphs. AVG ± SE.
Figure 6
Figure 6
Blood pH did not change physiologically due to the CCombat protocol, although serum bicarbonate and urinary pH decreased. (a) Blood pH (SpH) #Pre vs. − 48 h: p = .046; effect size = 0.5; statistical power = 0.55; #Pre vs. Post: p < .001; effect size = 1.3; statistical power = 0.99; #Pre vs. + 60 min: p = .046; effect size = 0.7; statistical power = 0.76; #Pre vs. + 24 h: p = .038; effect size = 0.6; statistical power = 0.71; #Pre vs. + 48 h: p = .002; effect size = 1.1; statistical power = 0.98; (b) serum bicarbonate (SHCO3) #Pre vs. Post: p < .001; effect size = 2.3; statistical power = 1.00; (c) urine pH (upH) #Pre vs. − 48 h: p < .001; effect size = 1.4; statistical power = 0.99; #Pre vs. − 24 h: p = .002; effect size = 1.2; statistical power = 0.99; #Pre vs. Post: p = .016; effect size = 0.9; statistical power = 0.92; #Pre vs. + 24 h: p < .001; effect size = 1.4; statistical power = 0.99; #Pre vs. + 48 h: p = .014; effect size = 0.8; statistical power = 0.90 and (d) comparison of pH values and bicarbonate concentrations during CCombat protocol and short recovery. The blue bar represents the CCombat protocol in scale in both graphs. AVG ± SE.
Figure 7
Figure 7
The CCombat protocol led to a 16-fold transient increase in albuminuria. #Pre vs. Post: p < .001; effect size = 1.4; statistical power = 0.99; #Pre vs. + 60 min: p < .001; effect size = 0.7; statistical power = 0.81. The blue bar represents the CCombat protocol in scale in both graphs. AVG ± SE.
Figure 8
Figure 8
Analyte correlations with the CCombat protocol. Correlation matrices related to (a) volemia (hematocrit; urea; serum albumin concentration (HSA); total blood proteins (TBP); sodium; glucose; calculated plasma osmolality (CPO); urine specific gravity (uSG) and urinary albumin (HuA)); (b) pH (blood pH (SpH); serum bicarbonate (SHCO3); urine pH (upH)); (c) kidney (serum albumin concentration (HSA); serum creatinine; cystatin C; urinary albumin (HuA); urea); (d) muscle (myoglobin; d-dimer and CK-MB); (e) metabolism (glucose; lactate; urate; urea and cortisol). The discussion focuses only on pairs with rs > 0.5 and a significance of p < 0.05.

References

    1. Bongiovanni T, et al. Sportomics: Metabolomics applied to sports. The new revolution? Eur. Rev. Med. Pharmacol. Sci. 2019;23:11011–11019. - PubMed
    1. Bragazzi NL, Khoramipour K, Chaouachi A, Chamari K. Toward sportomics: Shifting from sport genomics to sport postgenomics and metabolomics specialties promises, challenges, and future perspectives. Int. J. Sports Physiol. Perform. 2020;15:1201–1202. doi: 10.1123/ijspp.2020-0648. - DOI - PubMed
    1. Bassini A, Cameron LC. Sportomics: Building a new concept in metabolic studies and exercise science. Biochem. Biophys. Res. Commun. 2014;445:708–716. doi: 10.1016/j.bbrc.2013.12.137. - DOI - PubMed
    1. Sellami M, Elrayess MA, Puce L, Bragazzi NL. Molecular big data in sports sciences: State-of-art and future prospects of OMICS-based sports Sciences. Front. Mol. Biosci. 2021;8:815410. doi: 10.3389/fmolb.2021.815410. - DOI - PMC - PubMed
    1. Khoramipour K, et al. Metabolomics in exercise and sports: A systematic review. Sports Med. 2021;52:547–583. doi: 10.1007/s40279-021-01582-y. - DOI - PubMed