. 2022 Nov;43(11):2977-2992.
doi: 10.1038/s41401-022-00917-3. Epub 2022 May 17.

Apolipoprotein C1 promotes glioblastoma tumorigenesis by reducing KEAP1/NRF2 and CBS-regulated ferroptosis

Affiliations

Apolipoprotein C1 promotes glioblastoma tumorigenesis by reducing KEAP1/NRF2 and CBS-regulated ferroptosis

Xiang-Jin Zheng et al. Acta Pharmacol Sin. 2022 Nov.

Erratum in

Abstract

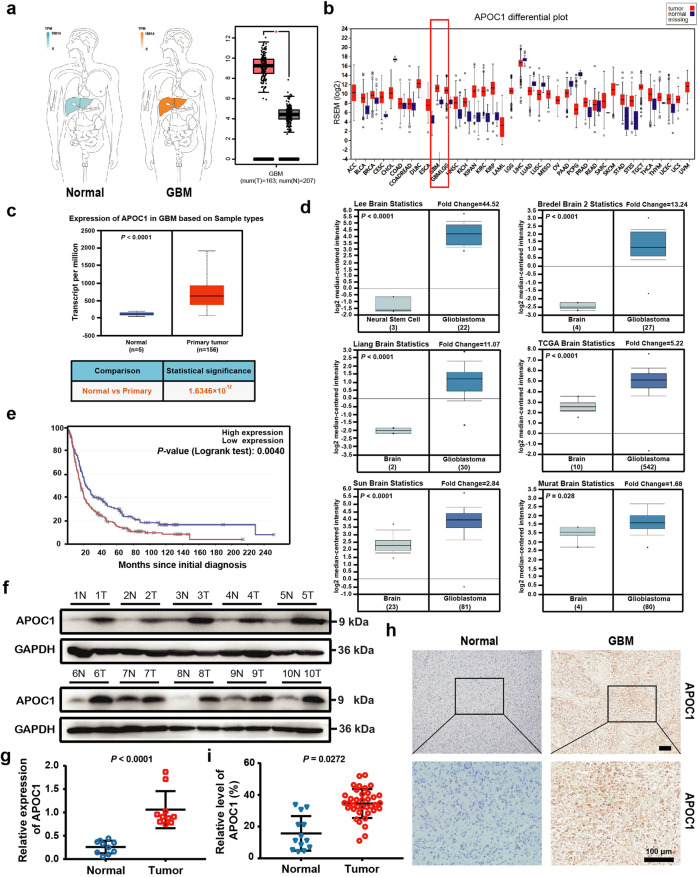
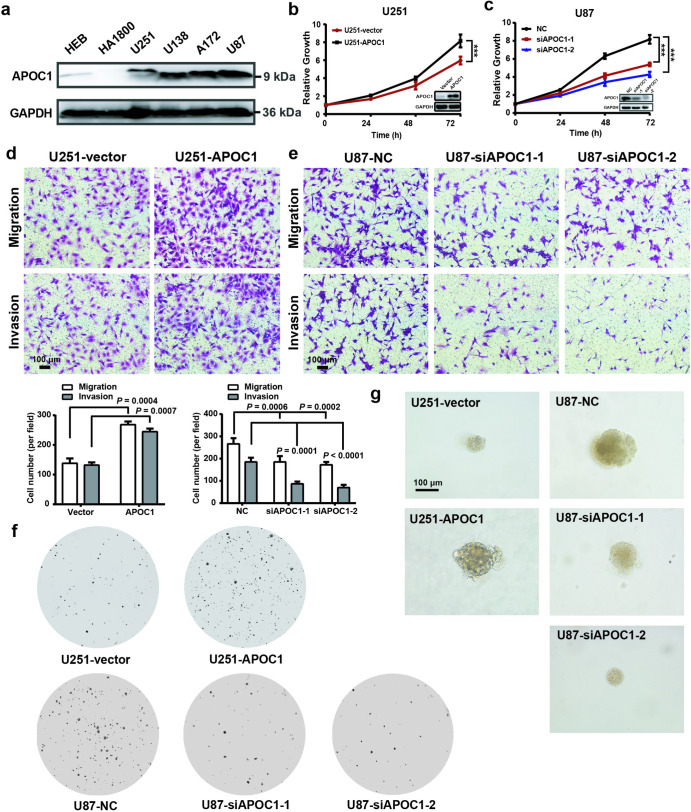
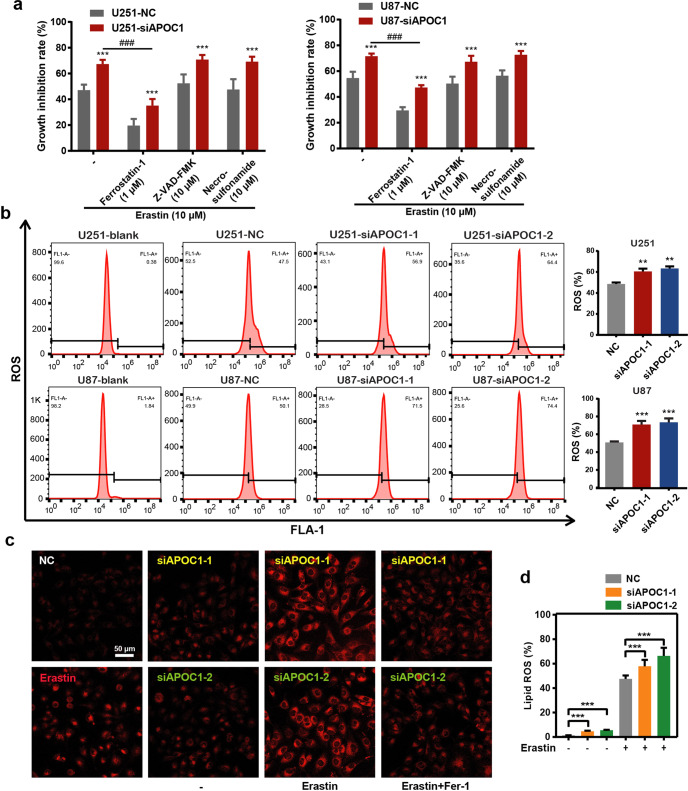
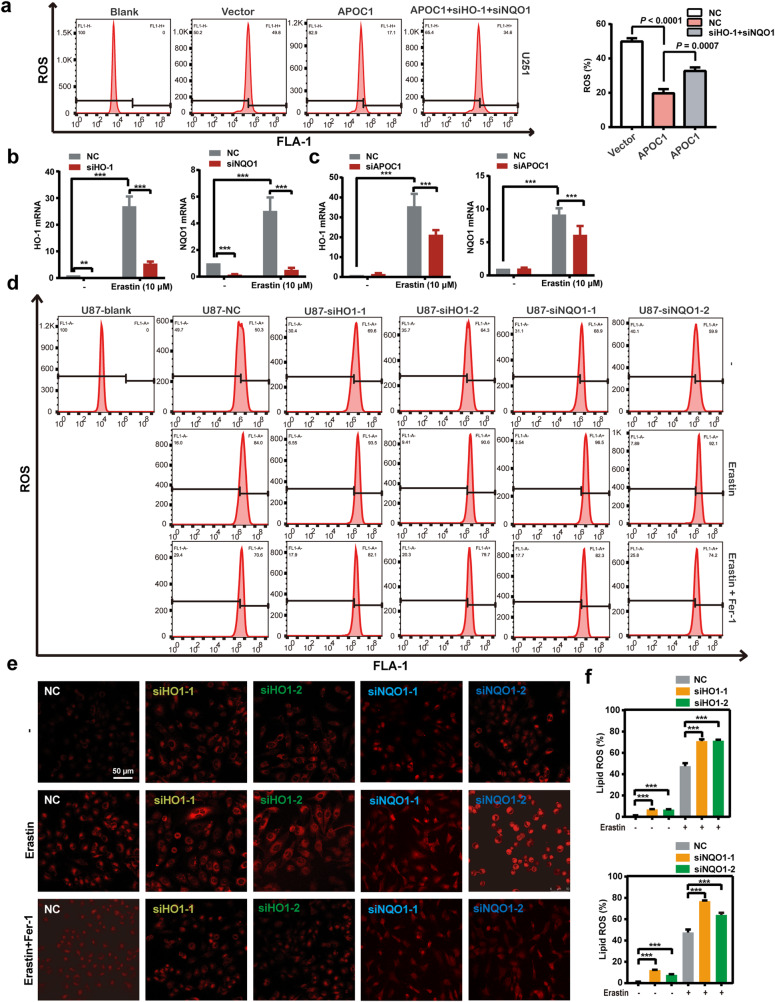
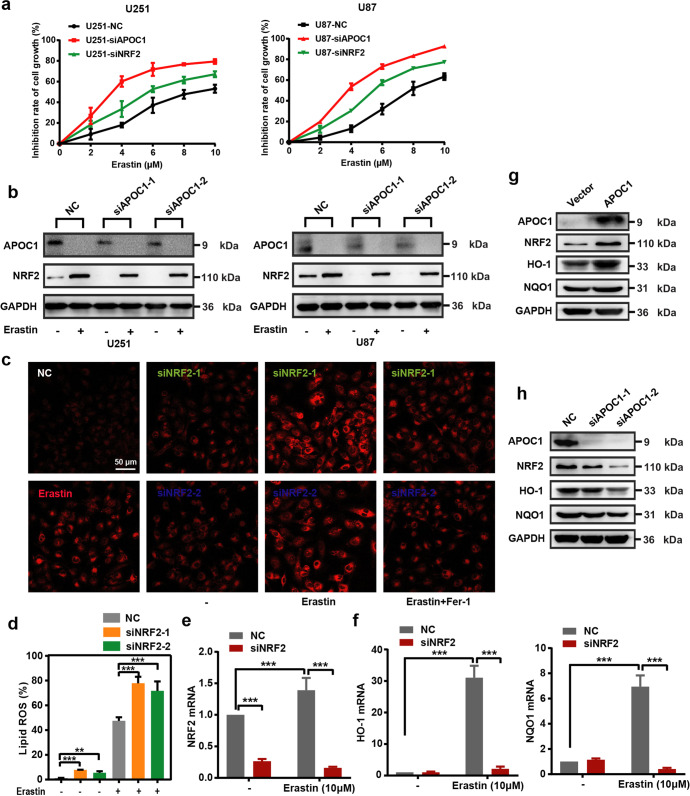
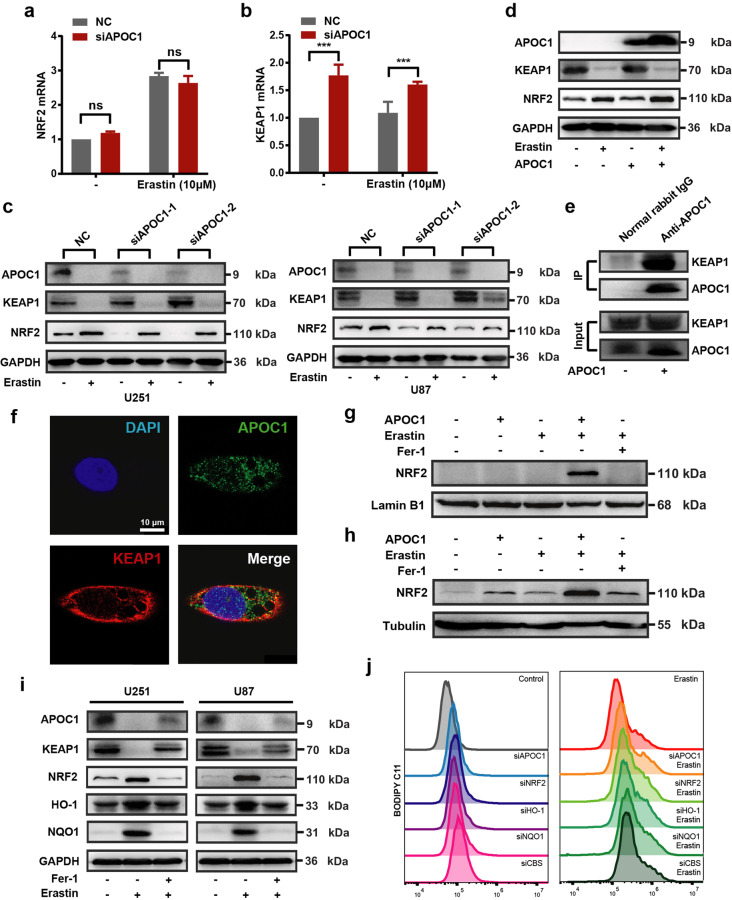
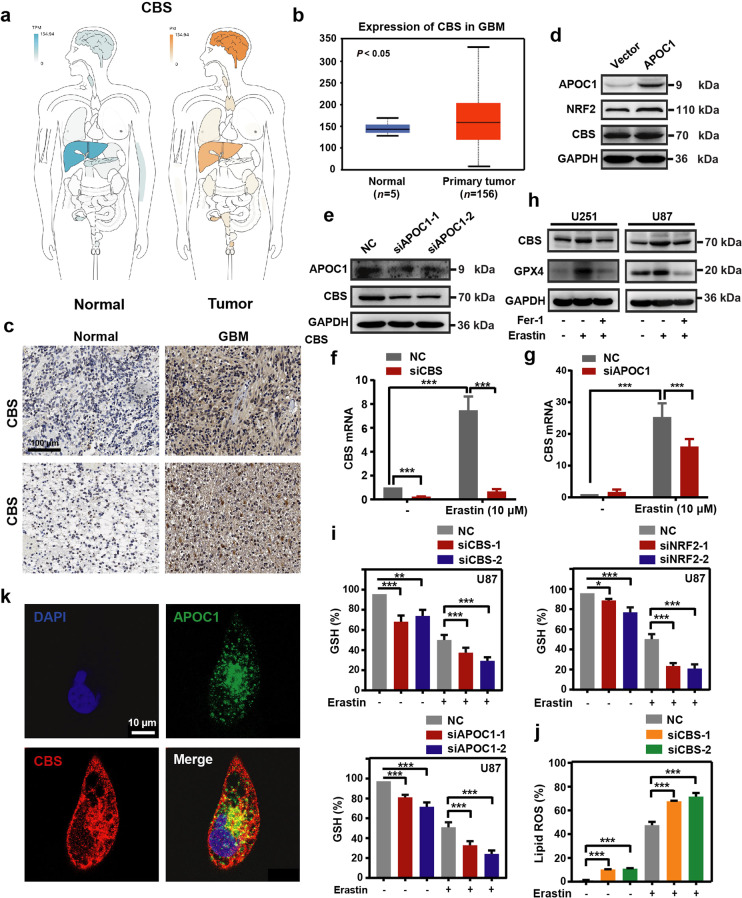
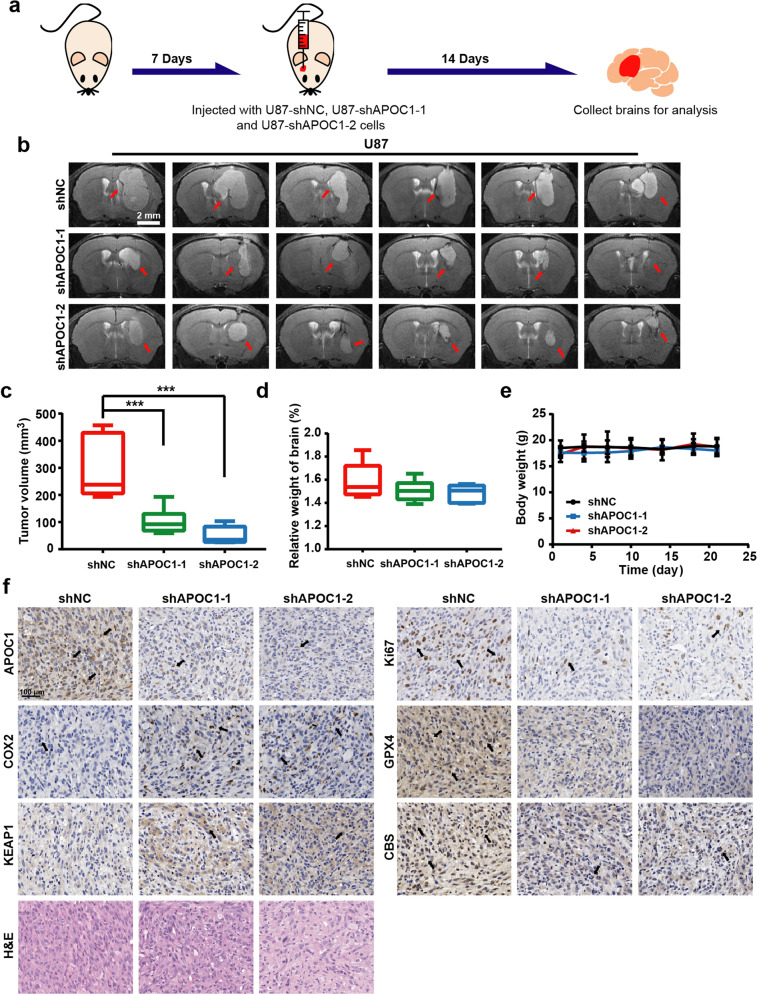
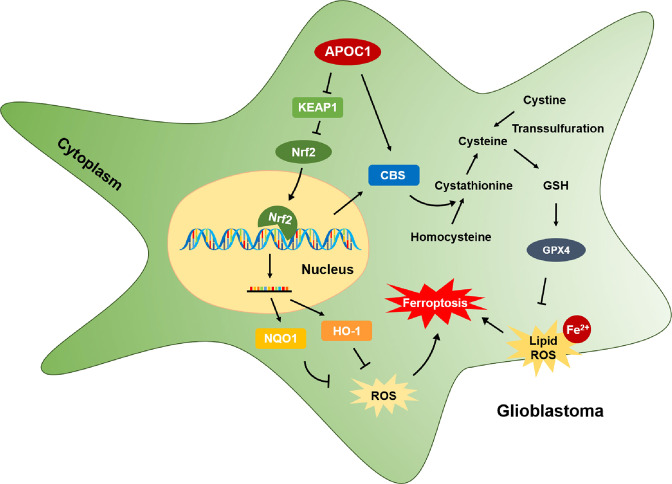
Glioblastoma (GBM), a malignant brain tumor, is a world-wide health problem because of its poor prognosis and high rates of recurrence and mortality. Apolipoprotein C1 (APOC1) is the smallest of apolipoproteins, implicated in many diseases. Recent studies have shown that APOC1 promotes tumorigenesis and development of several types of cancer. In this study we investigated the role of APOC1 in GBM tumorigenesis. Using in silico assays we showed that APOC1 was highly expressed in GBM tissues and its expression was closely related to GBM progression. We showed that APOC1 protein expression was markedly increased in four GBM cell lines (U251, U138, A172 and U87) compared to the normal brain glia cell lines (HEB, HA1800). In U251 cells, overexpression of APOC1 promoted cell proliferation, migration, invasion and colony information, which was reversed by APOC1 knockdown. APOC1 knockdown also markedly inhibited the growth of GBM xenografts in the ventricle of nude mice. We further demonstrated that APOC1 reduced ferroptosis by inhibiting KEAP1, promoting nuclear translocation of NRF2 and increasing expression of HO-1 and NQO1 in GBM cells. APOC1 also induced ferroptosis resistance by increasing cystathionine beta-synthase (CBS) expression, which promoted trans-sulfuration and increased GSH synthesis, ultimately leading to an increase in glutathione peroxidase-4 (GPX4). Thus, APOC1 plays a key role in GBM tumorigenesis, conferring resistance to ferroptosis, and may be a promising therapeutic target for GBM.

Keywords: APOC1; CBS; NRF2; ferroptosis; glioblastoma; lipid ROS; tumorigenesis.


Conflict of interest statement

The authors declare no competing interests.

Figures

Fig. 1
Fig. 1. APOC1 is highly expressed in GBM patients.
a There is higher APOC1 expression in GBM than that in normal tissues. APOC1 expression in tumor and normal tissues was analyzed in website (http://gepia.cancer-pku.cn/). b Expression of APOC1 is higher in GBM than normal tissues. Expression of APOC1 in tumor and normal tissues was analyzed in website (http://gdac.broadinstitute.org/). c APOC1 expression is high in GBM patients. Data of APOC1 expression in normal and GBM patients from TCGA database were analyzed in website (http://ualcan.path.uab.edu/analysis.html). d APOC1 is highly expressed in GBM. APOC1 expression between normal and GBM patients was analyzed in website (https://www.oncomine.org/). e Patients with high APOC1 expression have lower survival rates. Survival rate of GBM patients with high APOC1 expression and low APOC1 expression was analyzed in website (https://www.betastasis.com/). f APOC1 was highly expressed in GBM tissues than adjacent normal tissues. Western blotting analysis of APOC1 expression in GBM patients (n = 10). g Quantitative analysis of APOC1 expression in the GBM tissues and adjacent brain tissues. Bars indicates SD, P values represented the significant difference between GBM tissues and adjacent brain tissues, Student’s t test. h Immunohistochemical analysis of APOC1 expression in 37 glioma patient tissues and 13 adjacent normal tissues. Representative images showing the APOC1 protein in normal tissue and glioma tissue. Scale bar = 100 μm. i Quantitative analysis of APOC1 expression in the 37 glioma tissues and 13 normal tissues. Bars indicates SD, P values represented the significant difference between normal tissues and GBM tissues, Student’s t test.
Fig. 2
Fig. 2. APOC1 improved proliferation, migration, invasion, and colony formation of GBM cells.
a APOC1 expression in normal glial cells (HEB and HA1800) and GBM cells (U251, U138, A172 and U87). b Overexpression of APOC1 increased proliferation of U251 cells in 24, 48, and 72 h. c Knockdown of APOC1 inhibited proliferation of U87 cells in 24, 48, and 72 h. d Overexpression of APOC1 improved the migration and invasion of U251-APOC1 cells. Scale bar = 100 μm. e Knockdown of APOC1 inhibited the migration and invasion ability of U87-siAPOC1 cells. Scale bar = 100 μm. f Overexpression of APOC1 improved the colony formation of U251-APOC1 cells whereas knockdown of APOC1 inhibited colony formation of U87-siAPOC1 cells. g 3D matrigel assay showed overexpression of APOC1 promoted growth of U251-APOC1 cells whereas knockdown of APOC1 inhibited growth of U87-siAPOC1 cells in 3D Matrigel. Scale bar = 100 μm. Experiments were performed in triplicate. Data are presented as mean ± SD (n = 3). Statistical significance was determined by Student’s t test or one-way ANOVA, ***P < 0.001 vs. NC.
Fig. 3
Fig. 3. Knockdown of APOC1 expression significantly increased ferroptosis of GBM cells induced by Erastin through increasing Fe2+ concentration and ROS level.
a Knockdown of APOC1 promoted ferroptosis of U87 and U251 cells induced by Erastin. Cells were treated with Erastin (10 μM) with or without ferroptosis inhibitor, Ferrostatin-1 (1 μM), apoptosis inhibitor, Z-VAD-FMK (10 μM), necrosis inhibitor, Necrosulfonamide (10 μM) for 24 h. b Knockdown of APOC1 increased ROS production in U87 and U251 cells. Quantitative analysis of ROS level in indicated treatment U251 and U87 cells. c Knockdown of APOC1 increased intracellular Fe2+ in U251 cells. Representative images of Fe2+ in three assays were shown. Scale bar = 50 μm. d Knockdown of APOC1 increased lipid ROS level in U87 cells. Experiments were performed in triplicate. Data are presented as mean ± SD (n = 3). Statistical significance was determined by Student’s t test or one-way ANOVA, **P < 0.01, ***P < 0.001 vs. NC.
Fig. 4
Fig. 4. Knockdown of APOC1 promoted ferroptosis by reduced expression of HO-1 and NQO1 expression.
a Overexpression of APOC1 attenuated ROS level which can be reversed by knockdown of HO-1 and NQO1 expression in U251 cells. b mRNA expression of HO-1 and NQO1 was increased in U87 cells after treatment of Erastin for 24 h. c Knockdown of APOC1 expression decreased HO-1 and NQO1 mRNA level in U87 cells treated by Erastin for 24 h. d Knockdown of HO-1 or NQO1 expression increased ROS level of U87 cells treated by Erastin for 24 h. e Knockdown of HO-1 or NQO1 increased intracellular Fe2+ of U251 cells in Erastin-induced ferroptosis. Representative images of Fe2+ with identical results in three assays were shown. Scale bar = 50 μm. f Knockdown of HO-1 or NQO1 increased lipid ROS level of U87 cells. Experiments were performed in triplicate. Data are presented as mean ± SD (n = 3). Statistical significance was determined by Student’s t test or one-way ANOVA, **P < 0.01, ***P < 0.001 vs. NC.
Fig. 5
Fig. 5. Knockdown of APOC1 conferred sensitivity of cells to Erastin by reducing NRF2-mediated HO-1 and NQO1 expression.
a Knockdown of APOC1 or NRF2 in U87 and U251 cells increased cell sensitivity to Erastin. b Knockdown of APOC1 decreased expression of NRF2 protein in cells treated by Erastin. The experiments were performed in triplicate. c Knockdown of NRF2 increased intracellular Fe2+ in U251 cells. Representative images of Fe2+ with identical results in three assays were shown. Scale bar = 50 μm. d Knockdown of NRF2 increased lipid ROS level of U87 cells in Erastin-induced ferroptosis. e, f NRF2 regulated HO-1 and NQO1 expression during ferroptosis in U87 cells. g Overexpression of APOC1 upregulated NRF2, HO-1 and NQO1 expression in U251 cells. h Knockdown of APOC1 reduced protein expression of NRF2, HO-1 and NQO1 in U87 cells. Experiments were performed in triplicate. Data are presented as mean ± SD (n = 3). Statistical significance was determined by Student’s t test or one-way ANOVA, **P < 0.01, ***P < 0.001 vs. NC.
Fig. 6
Fig. 6. APOC1 promote translocation of NRF2 by KEAP1-NRF2 pathway.
a, b Knockdown of APOC1 increased mRNA expression of KEAP1 but did not change mRNA expression of NRF2 in U87 cells treated by Erastin for 24 h. c Knockdown of APOC1 increased protein expression of KEAP1 and attenuated NRF2 expression in U87 and U251 cells treated by Erastin for 24 h. d Overexpression of APOC1 enhanced NRF2 expression while decreased KEAP1 protein expression in U251 cells. e Co-Immunoprecipitation assay showed APOC1 can interact with KEAP1. f Immunofluorescence images of APOC1 and KEAP1 in U251 cell. Green for APOC1 and red for KEAP1. Scale bar = 10 μm. Data are representative images of three assays with identical results. g, h APOC1 promotes nuclear translocation of NRF2. i Expression of APOC1, KEAP1, NRF2, HO-1 and NQO1 in U87 and U251 cells treated by Erastin with or without Fer-1 for 24 h. j Representative image of lipid ROS with identical results in three assays was shown. Experiments were performed in triplicate. Data are presented as mean ± SD (n = 3). Statistical significance was determined by Student’s t test, ***P < 0.001, n.s. nonsignificant vs. NC.
Fig. 7
Fig. 7. CBS participates in ferroptosis resistance which can be regulated by APOC1.
a, b CBS is highly expressed in brain of GBM. CBS expression in GBM was analyzed in GEPIA database (http://gepia.cancer-pku.cn/) (a) and Oncomine database (https://www.oncomine.org/) (b). c Immunohistochemical analysis of CBS expression in GBM patients. Representative images showed expression of CBS protein was higher in GBM than adjacent normal tissues. Scale bar = 100 μm. d Overexpression APOC1 improved CBS expression in U251 cells. e Knockdown of APOC1 decreased CBS expression in U87 cells. f mRNA level of CBS increased in Erastin-induced ferroptosis for 24 h. g Knockdown of APOC1 decreased mRNA expression of CBS in cells treated by Erastin for 24 h. h CBS and GPX4 were highly expressed in U87 and U251 cells treated by Erastin for 24 h. i Knockdown of APOC1, NRF2, or CBS attenuates GSH level in Erastin-induced ferroptosis in U87 cells. j Knockdown of CBS increases lipid ROS level in U87 cells treated by Erastin for 24 h. k Immunofluorescence images of APOC1 and CBS. Green for APOC1 and red for CBS. Scale bar = 10 μm. Data are representative images of three assays with identical results. Experiments were performed in triplicate. Data are presented as mean ± SD (n = 3). Statistical significance was determined by Student’s t test or one-way ANOVA, *P < 0.05, **P < 0.01, ***P < 0.001 vs. NC.
Fig. 8
Fig. 8. Down-regulation of APOC1 inhibited GBM growth in vivo.
a Schematic of APOC1 function in orthotopic GBM tumor growth in vivo. b Representative MRI images of intracranial tumors from U87-shNC, U87-shAPOC1-1, and U87-shRNA-2. Scale bar = 2 mm. c Tumor volumes of U87 orthotopic model. The tumor volume was calculated with formula: V tumor volume = L maximum length × W maximum width × T thickness of the tumor slice. d Relative weight of brain in U87-shNC, U87-shAPOC1-1, and U87-shRNA-2 group. e Body weight change of U87-shNC, U87-shAPOC1-1, and U87-shRNA-2 group. f H&E staining and immunohistochemical results of APOC1, Ki67, COX2, KEAP1, CBS, and GPX4 expression in brain tissues of GBM orthotopic nude mice model. Representative images of each protein with identical results were shown in the shNC, shAPOC1-1, and shAPOC1-2 tumor tissues. Scale bar = 100 μm. Data are presented as mean ± SD (n = 6). Statistical significance was determined by one-way ANOVA, ***P < 0.001 vs. shNC.
Fig. 9
Fig. 9. Mechanism of APOC1 in ferroptosis regulation of GBM.
APOC1 reduced the sensitivity of GBM cells to ferroptosis by up-regulating the KEAP1/NRF2/HO-1 and NQO1 pathway and the CBS/GPX4 axis, which finally decreasing intracellular ROS and Fe2+ level.

References

    1. Chen R, Smith-Cohn M, Cohen A, Colman H. Glioma Subclassifications and Their Clinical Significance. Neurotherapeutics: the journal of the American Society for Experimental. NeuroTherapeutics. 2017;14:284–97. doi: 10.1007/s13311-017-0519-x. - DOI - PMC - PubMed
    1. Louis DN, Perry A, Reifenberger G, von Deimling A, Figarella-Branger D, Cavenee WK, et al. The 2016 World Health Organization Classification of Tumors of the Central Nervous System: a summary. Acta Neuropathol. 2016;131:803–20. doi: 10.1007/s00401-016-1545-1. - DOI - PubMed
    1. Weller M, Cloughesy T, Perry JR, Wick W. Standards of care for treatment of recurrent glioblastoma–are we there yet? Neuro Oncol. 2013;15:4–27. doi: 10.1093/neuonc/nos273. - DOI - PMC - PubMed
    1. Kumar AA, Abraham Koshy A. Regression of recurrent high-grade glioma with temozolomide, dexamethasone, and levetiracetam: case report and review of the literature. World Neurosurg. 2017;108:990.e11–e16. doi: 10.1016/j.wneu.2017.08.136. - DOI - PubMed
    1. Wen PY, Kesari S. Malignant gliomas in adults. N Engl J Med. 2008;359:492–507. doi: 10.1056/NEJMra0708126. - DOI - PubMed