

ZnO size and shape effect on antibacterial activity and cytotoxicity profile
- PMID: 35581357
- PMCID: PMC9114415
- DOI: 10.1038/s41598-022-12134-3
ZnO size and shape effect on antibacterial activity and cytotoxicity profile
Erratum in
-
Author Correction: ZnO size and shape effect on antibacterial activity and cytotoxicity profile.Sci Rep. 2023 Aug 1;13(1):12465. doi: 10.1038/s41598-023-39615-3. Sci Rep. 2023. PMID: 37528225 Free PMC article. No abstract available.
Abstract
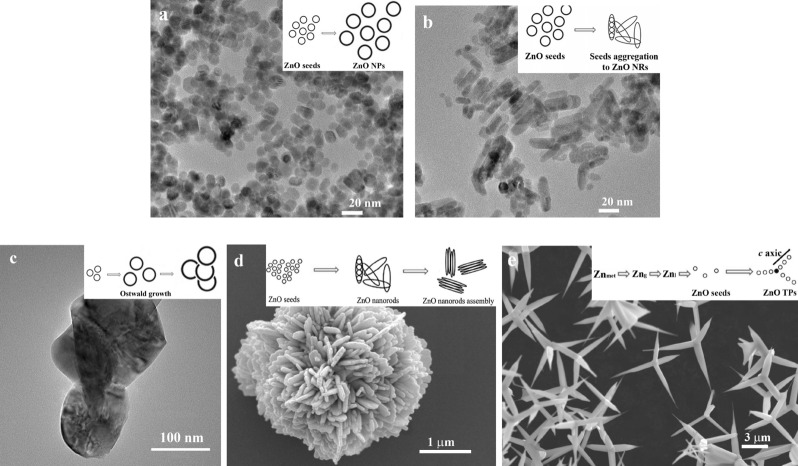
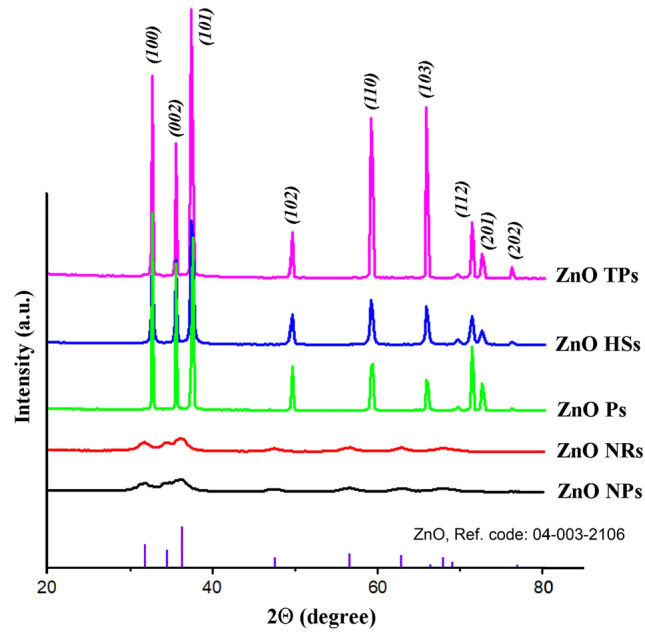
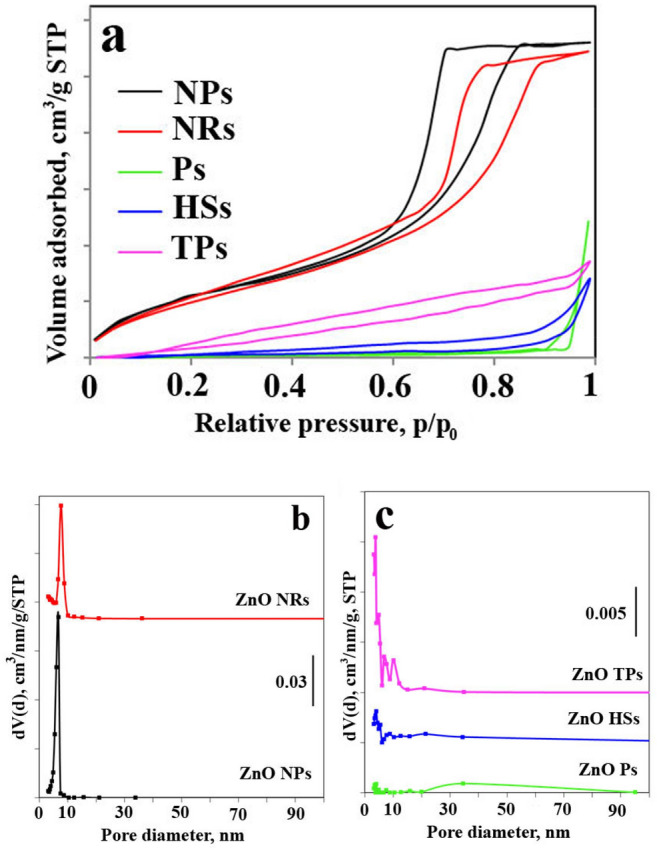
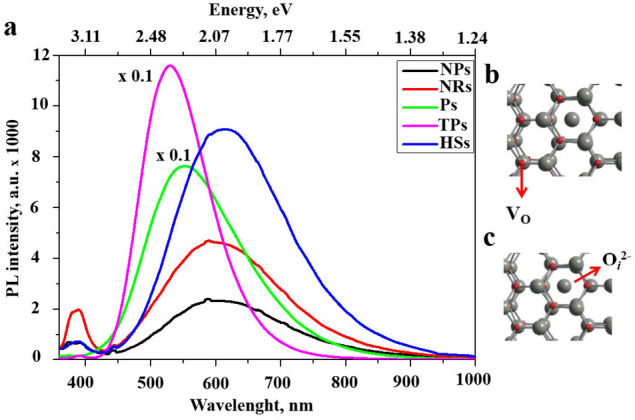
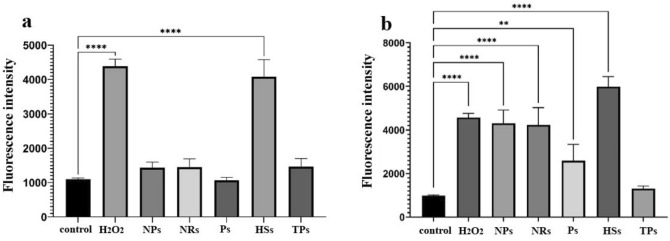
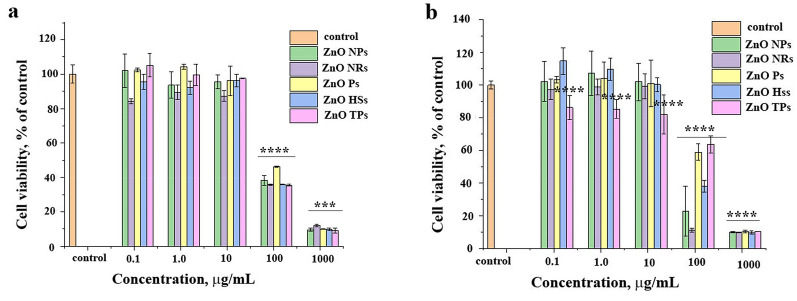
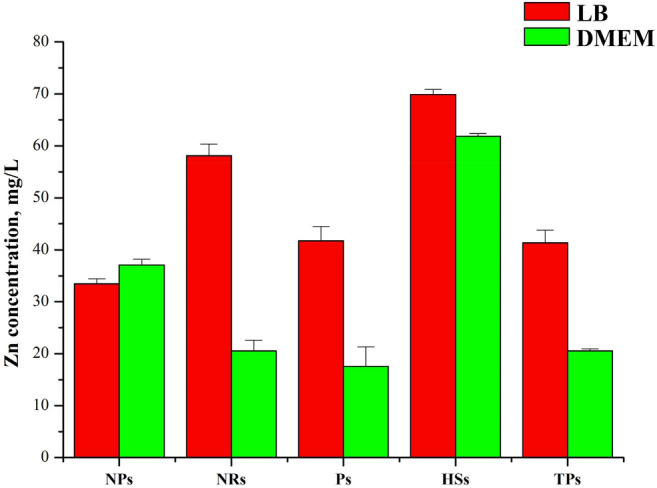
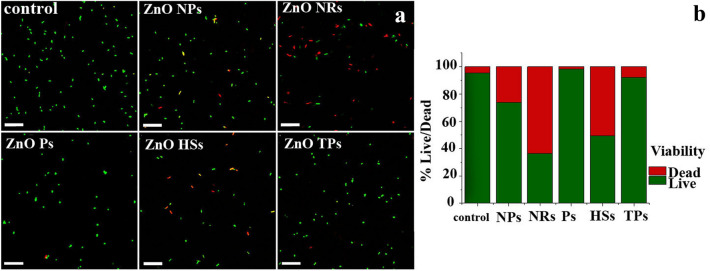
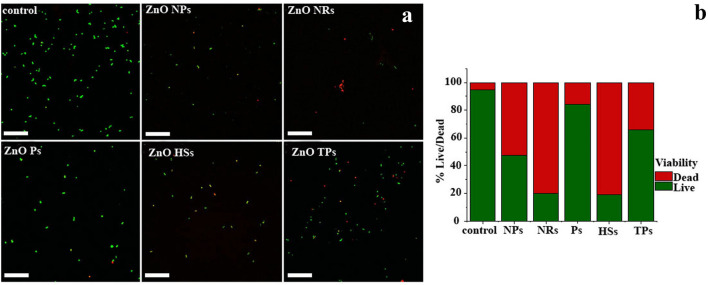
The aim of our work was the synthesis of ZnO nano- and microparticles and to study the effect of shapes and sizes on cytotoxicity towards normal and cancer cells and antibacterial activity toward two kinds of bacteria. We fabricated ZnO nano- and microparticles through facile chemical and physical routes. The crystal structure, morphology, textural properties, and photoluminescent properties were characterized by powder X-ray diffraction, electron microscopies, nitrogen adsorption/desorption measurements, and photoluminescence spectroscopy. The obtained ZnO structures were highly crystalline and monodispersed with intensive green emission. ZnO NPs and NRs showed the strongest antibacterial activity against Escherichia coli and Staphylococcus aureus compared to microparticles due to their high specific surface area. However, the ZnO HSs at higher concentrations also strongly inhibited bacterial growth. S. aureus strain was more sensitive to ZnO particles than the E. coli. ZnO NPs and NRs were more harmful to cancer cell lines than to normal ones at the same concentration.
© 2022. The Author(s).
Conflict of interest statement
The authors declare no competing interests.
Figures

References
-
- Boopathi Raja R, Parthibavarman M. Reagent induced formation of NiCo2O4 with different morphologies with large surface area for high performance asymmetric supercapacitors. Chem. Phys. Lett. 2020;755:137809.
-
- Sharma N, Sharma SK, Sachdev K. Effect of precursors on the morphology and surface area of LaFeO3. Ceram. Int. 2019;45:7217–7225.
-
- Morales Flores N, Pal U, Galeazzia R, Sandoval A. Effects of morphology, surface area, and defect content on the photocatalytic dye degradation performance of ZnO nanostructures. RSC Adv. 2014;4:41099.
-
- Kanjwal MA, Barakat NAM, Sheikh FA, Baek W-L, Khil MS, Kim HY. Effects of silver content and morphology on the catalytic activity of silver-grafted titanium oxide nanostructure. Fibers Polym. 2010;11(5):700–709.
Publication types
MeSH terms
Substances
LinkOut - more resources
Full Text Sources
Molecular Biology Databases
