. 2022 May 17;12(1):8230.
doi: 10.1038/s41598-022-12301-6.

An immune gene signature to predict prognosis and immunotherapeutic response in lung adenocarcinoma

Affiliations

An immune gene signature to predict prognosis and immunotherapeutic response in lung adenocarcinoma

Hongquan Chen et al. Sci Rep. .

Abstract

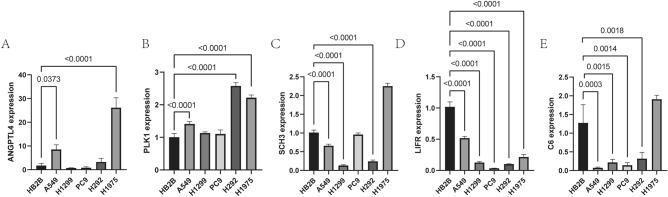
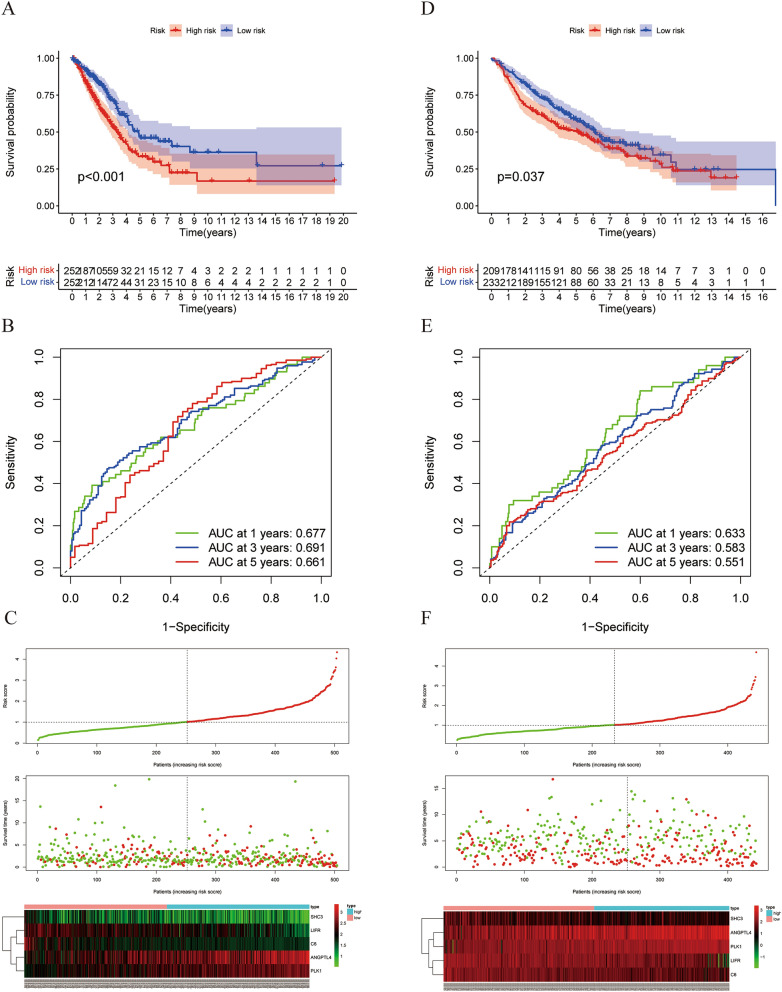
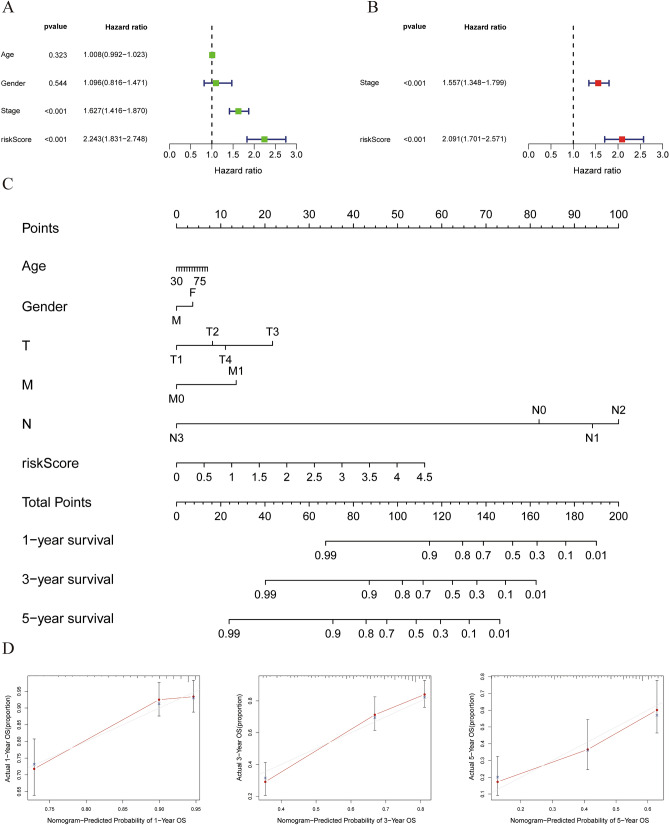
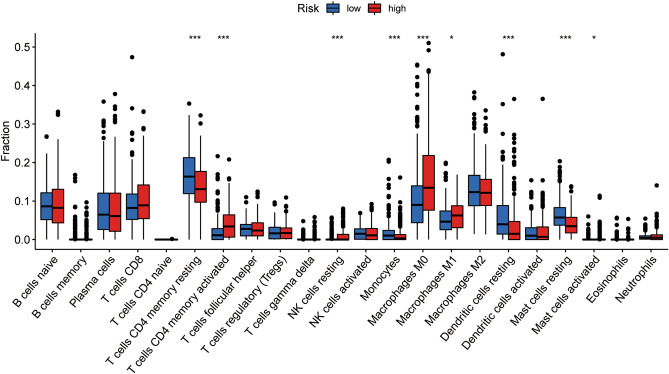
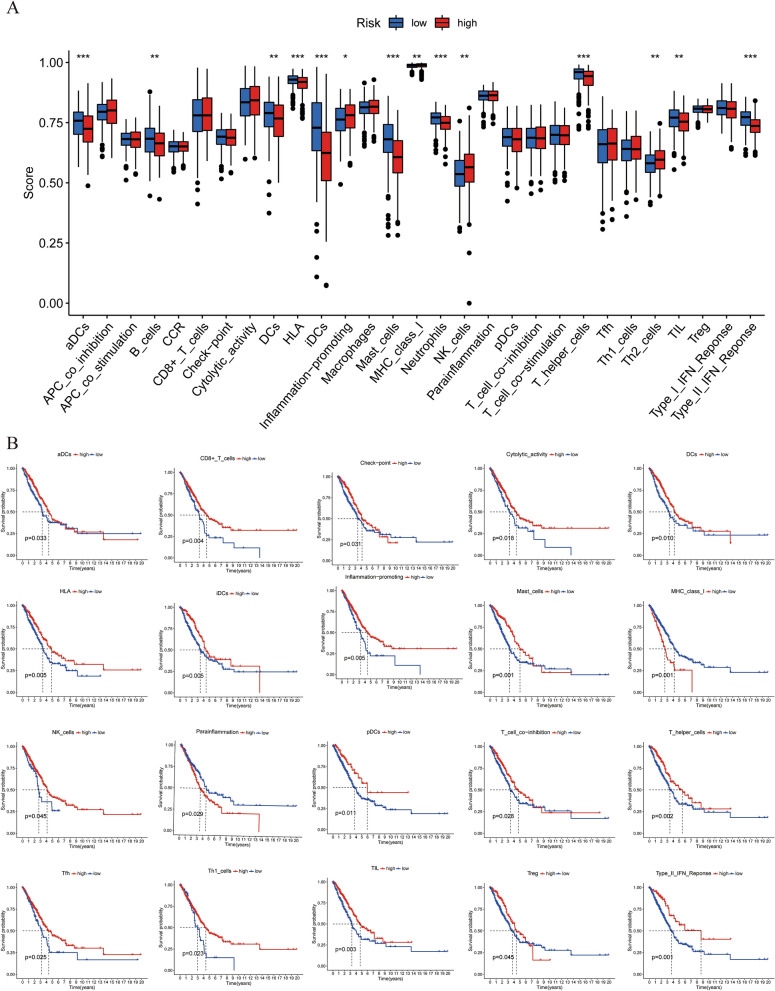
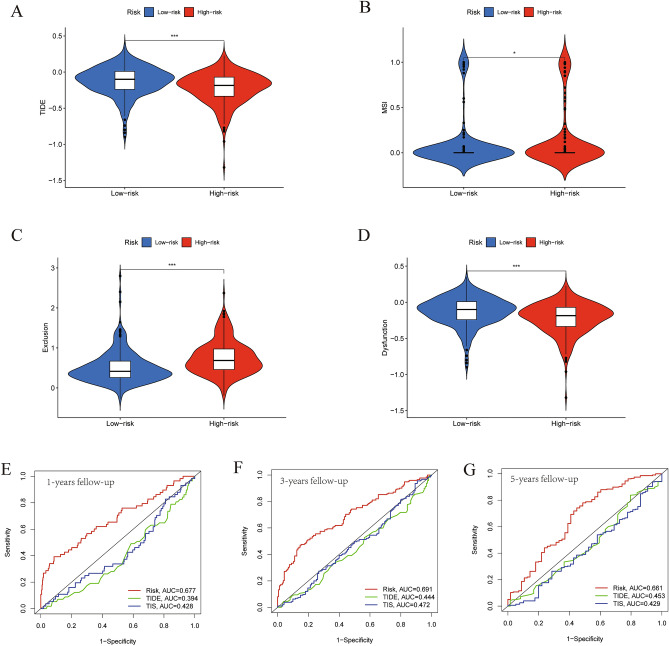
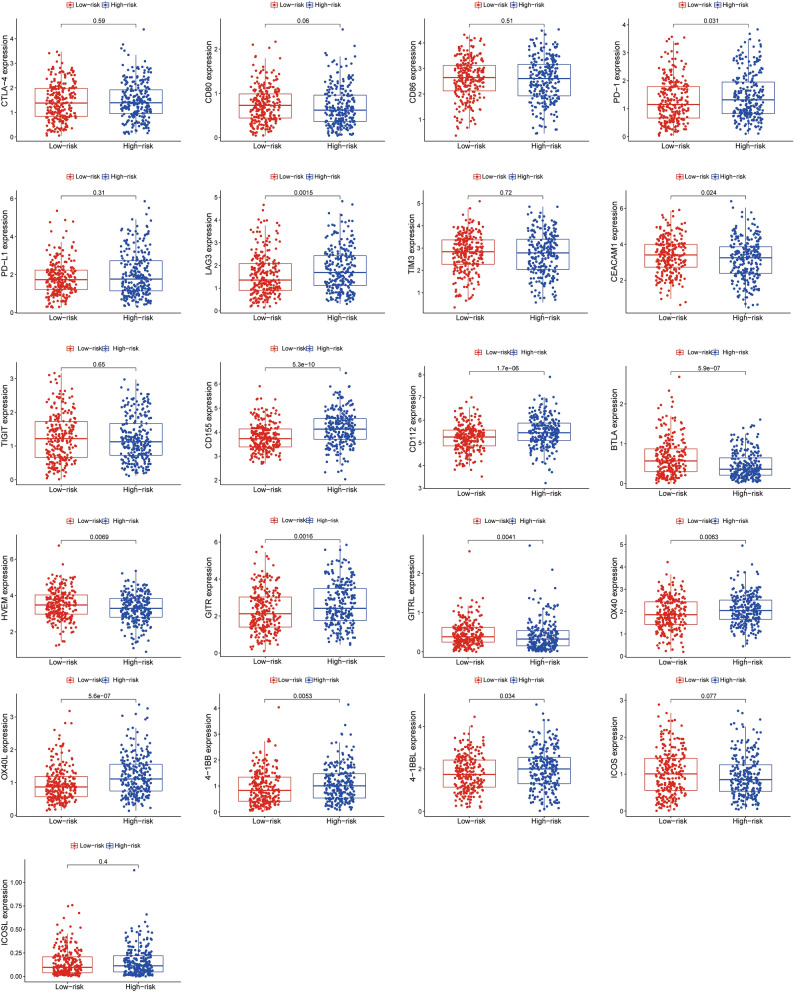
Lung adenocarcinoma is one of the most common malignant tumors worldwide. The purpose of this study was to construct a stable immune gene signature for prediction of prognosis (IGSPP) and response to immune checkpoint inhibitors (ICIs) therapy in LUAD patients. Five genes were screened by weighted gene coexpression network analysis, Cox regression and LASSO regression analyses and were used to construct the IGSPP. The survival rate of the IGSPP low-risk group was higher than that of the IGSPP high-risk group. Multivariate Cox regression analysis showed that IGSPP could be used as an independent prognostic factor for the overall survival of LUAD patients. IGSPP genes were enriched in cell cycle pathways. IGSPP gene mutation rates were higher in the high-risk group. CD4 memory-activated T cells, M0 and M1 macrophages had higher infiltration abundance in the high-risk group, which was associated with poor overall survival. In contrast, the abundance of resting CD4 memory T cells, monocytes, resting dendritic cells and resting mast cells associated with a better prognosis was higher in the low-risk group. TIDE scores and the expressions of different immune checkpoints showed that patients in the high-risk IGSPP group benefited more from ICIs treatment. In short, an IGSPP of LUAD was constructed and characterized. It could be used to predict the prognosis and benefits of ICIs treatment in LUAD patients.


Conflict of interest statement

The authors declare no competing interests.

Figures

Figure 1
Figure 1
Differentially expressed immune-related genes in LUAD. (A) Differentially expressed genes (DEGs) (logFC filter = 1, FDR Filter = 0.05) between 535 LUAD samples (red) and 59 para-cancerous samples (blue). (B) Differentially expressed immune-related genes (DEIRGs) between 539 LUAD samples (red) and 59 para-cancerous samples (blue). (C) Gene Ontology (GO) enrichment analysis of DEIRGs (p < 0.05). (D) Kyoto Encyclopedia of Gene and Genome (KEGG) pathway analysis of DEIRGs (p < 0.05).
Figure 2
Figure 2
Identification of immune-related hub genes. (A) The horizontal threshold is 0.85. (B) The best soft threshold for WGCNA is 4. (C) DEIRG clustering tree based on dissimilarity measure (1-TOM). (D) The gene modules related to LUAD obtained by WGCNA. (E) Functional enrichment analysis of 263 genes in the turquoise module. (F) KEGG pathway enrichment analysis of 263 genes in the turquoise module.
Figure 3
Figure 3
Kaplan–Meier survival curves of 30 immune-related hub genes obtained by univariate Cox regression analysis.
Figure 4
Figure 4
Construction of IGSPP for LUAD patients. (A) Mutation analysis of 30 immune-related hub genes. (B) The confidence interval of each λ. (C) Establishment of the LASSO regression model. (D) Multivariate Cox regression analysis was used to identify 5 immune-related hub genes used to construct the IGSPP.
Figure 5
Figure 5
The expression levels of five genes in the construction of IGSPP. A-E. The expression levels of five genes in cell lines.
Figure 6
Figure 6
The relationship between the IGSPP scores and the prognosis of patients. (A, D) KM survival curves of IGSPP high- and low-risk groups TCGA training cohort (A) and GEO validation cohort (D). (B, E) Time ROC curves of the TCGA cohort (B) and GEO cohort (E). (C, F) (From top to bottom) patient risk score distribution, scatter diagram of patient survival status, and expression patterns of risk genes.
Figure 7
Figure 7
Prognostic value of IGSPP in the TCGA cohort. (A) Univariate Cox regression analysis. (B) Multivariate Cox regression analysis. (C) OS nomograms of 1-, 3- and 5-year. (D) Consistency between predicted and observed 1-, 3- and 5-year survival rates.
Figure 8
Figure 8
Molecular characteristics of IGSPP subgroups. (A, B) GSEA enrichment analysis in the IGSPP high-risk group (p < 0.05). (C) GSEA enrichment analysis in the IGSPP low-risk group (p < 0.05). (D) Gene mutations of patients within the IGSPP high-risk group. (E) Gene mutations of patients within the IGSPP low-risk group. (F) Correlation between the TMB and IGSPP score. (G) Correlation between the TMB and OS in patients with LUAD.
Figure 9
Figure 9
Immune cell infiltration in the IGSPP subgroups. Infiltration abundance of 22 immune cells in the IGSPP subgroups. Blue represents the low-risk group of IGSPP, and red represents the high-risk group. The horizontal line represents the median, and the bottom and top of the box are the 25th and 75th percentiles (quartile intervals), respectively. The Wilcoxon test was used to evaluate the differences between the two subgroups (*P < 0.05, **P < 0.01, ***P < 0.001, ****P < 0.0001).
Figure 10
Figure 10
Immune characteristics of the IGSPP subgroups. (A) Immune-related functions were enriched and analyzed by ssGSEA and then compared among different IGSPP subgroups. The scattered points represent the ssGSEA scores of the two subgroups, the horizontal line represents the median, and the bottom and top of the box represent the 25th and 75th percentiles (quartile intervals), respectively. The Wilcoxon test was used to evaluate the difference between two subgroups (*p < 0.05, **P < 0.01, ***P < 0.001). (B) Correlation between immune-related function score and overall survival time.
Figure 11
Figure 11
The prognostic value of IGSPP for ICI treatment. (AD) Scores of TIDE, MSI, T cell exclusion and T cell dysfunction in different IGSPP groups. The Wilcoxon test was used to evaluate the difference (*P < 0.05, **P < 0.01, ***P < 0.001). (EG) The 1-, 3- and 5-year ROC curves based on the IGSPP, TIS and TIDE scores of the TCGA cohort.
Figure 12
Figure 12
The expression of some key immune checkpoint molecules.

References

    1. Sung H, et al. Global Cancer Statistics 2020: GLOBOCAN estimates of incidence and mortality worldwide for 36 cancers in 185 countries. CA Cancer J. Clin. 2021;71:209–249. doi: 10.3322/caac.21660. - DOI - PubMed
    1. Blandin Knight S., et al. Progress and prospects of early detection in lung cancer. Open Biol.7 (2017). - PMC - PubMed
    1. Ma J, Ward EM, Smith R, Jemal A. Annual number of lung cancer deaths potentially avertable by screening in the United States. Cancer. 2013;119:1381–1385. doi: 10.1002/cncr.27813. - DOI - PubMed
    1. Nooreldeen, R., Bach, H. Current and future development in lung cancer diagnosis. Int. J. Mol. Sci.22 (2021). - PMC - PubMed
    1. Reck M, et al. Atezolizumab in combination with bevacizumab, paclitaxel and carboplatin for the first-line treatment of patients with metastatic non-squamous non-small cell lung cancer, including patients with EGFR mutations. Expert Rev. Respir. Med. 2020;14:125–136. doi: 10.1080/17476348.2020.1701439. - DOI - PubMed

Publication types

Substances