

Identification of spatio-temporal clusters of lung cancer cases in Pennsylvania, USA: 2010-2017
- PMID: 35581566
- PMCID: PMC9112439
- DOI: 10.1186/s12885-022-09652-8
Identification of spatio-temporal clusters of lung cancer cases in Pennsylvania, USA: 2010-2017
Abstract
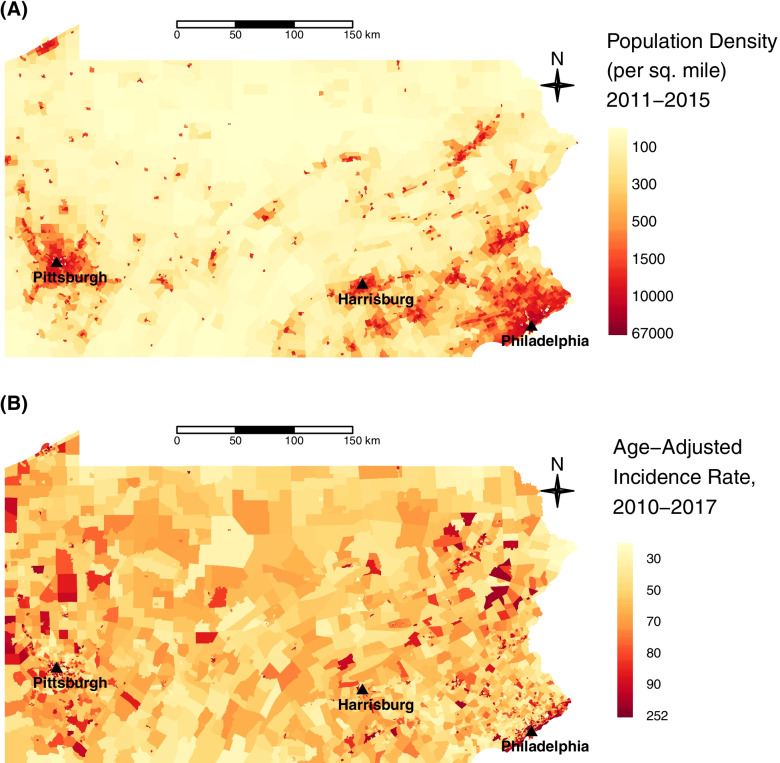
Background: It is known that geographic location plays a role in developing lung cancer. The objectives of this study were to examine spatio-temporal patterns of lung cancer incidence in Pennsylvania, to identify geographic clusters of high incidence, and to compare demographic characteristics and general physical and mental health characteristics in those areas.
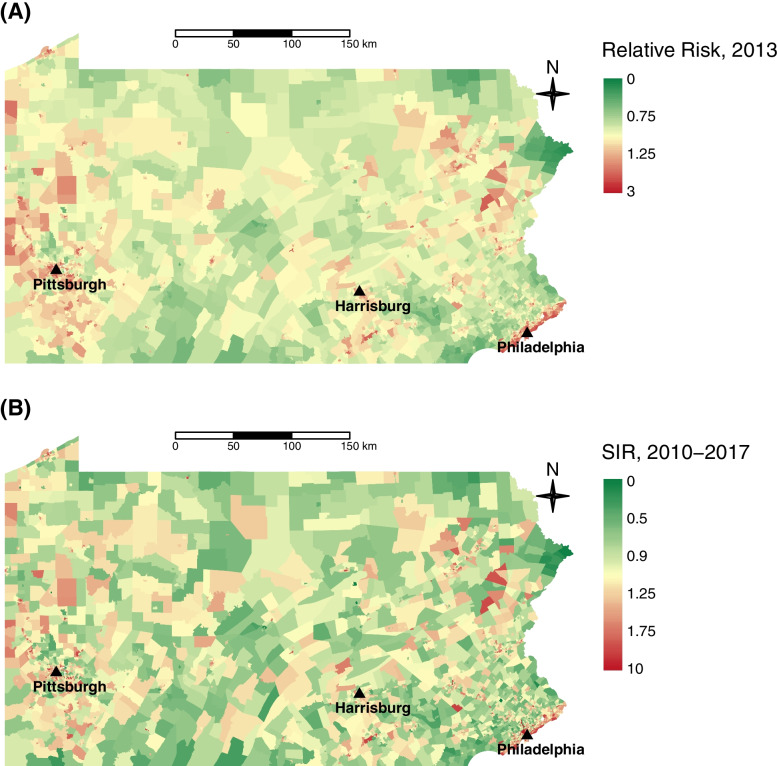
Method: We geocoded the residential addresses at the time of diagnosis for lung cancer cases in the Pennsylvania Cancer Registry diagnosed between 2010 and 2017. Relative risks over the expected case counts at the census tract level were estimated using a log-linear Poisson model that allowed for spatial and temporal effects. Spatio-temporal clusters with high incidence were identified using scan statistics. Demographics obtained from the 2011-2015 American Community Survey and health variables obtained from 2020 CDC PLACES database were compared between census tracts that were part of clusters versus those that were not.
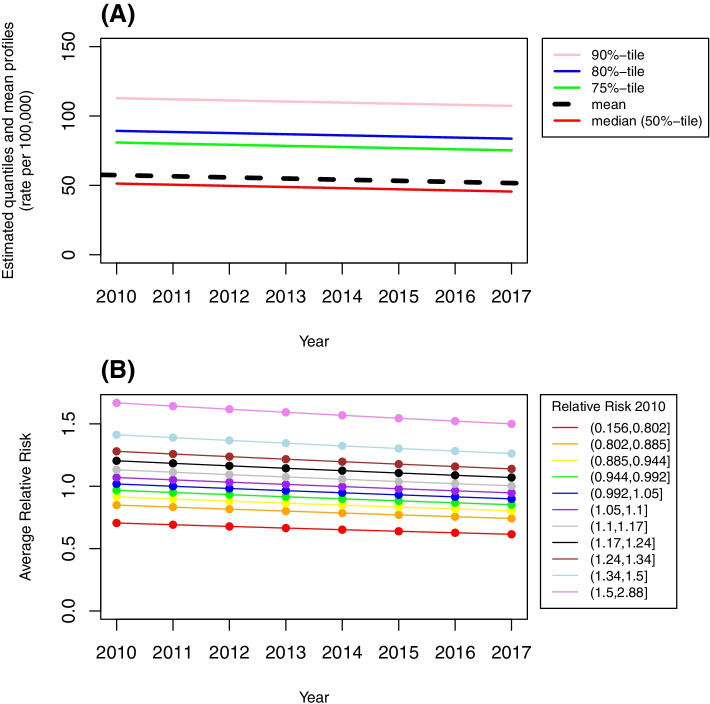
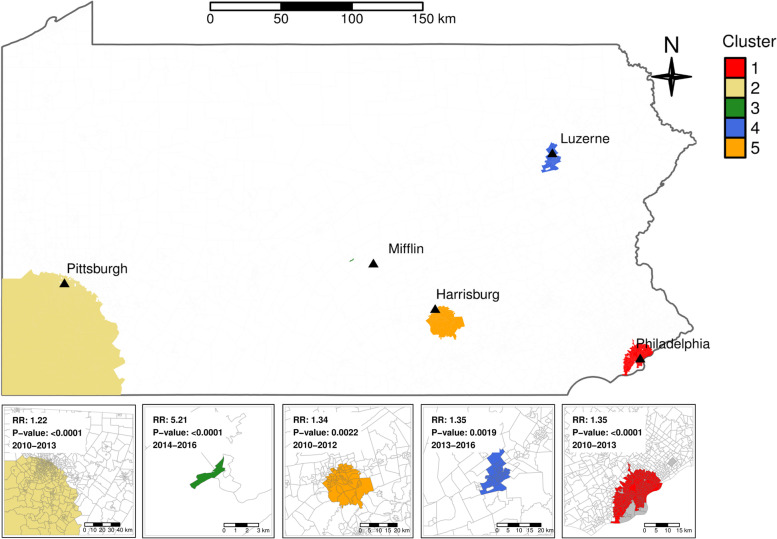
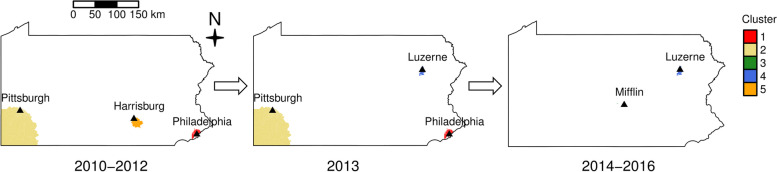
Results: Overall, the age-adjusted incidence rates and the relative risk of lung cancer decreased from 2010 to 2017 with no statistically significant space and time interaction. The analyses detected 5 statistically significant clusters over the 8-year study period. Cluster 1, the most likely cluster, was in southeastern PA including Delaware, Montgomery, and Philadelphia Counties from 2010 to 2013 (log likelihood ratio = 136.6); Cluster 2, the cluster with the largest area was in southwestern PA in the same period including Allegheny, Fayette, Greene, Washington, and Westmoreland Counties (log likelihood ratio = 78.6). Cluster 3 was in Mifflin County from 2014 to 2016 (log likelihood ratio = 25.3), Cluster 4 was in Luzerne County from 2013 to 2016 (log likelihood ratio = 18.1), and Cluster 5 was in Dauphin, Cumberland, and York Counties limited to 2010 to 2012 (log likelihood ratio = 17.9). Census tracts that were part of the high incidence clusters tended to be densely populated, had higher percentages of African American and residents that live below poverty line, and had poorer mental health and physical health when compared to the non-clusters (all p < 0.001).
Conclusions: These high incidence areas for lung cancer warrant further monitoring for other individual and environmental risk factors and screening efforts so lung cancer cases can be identified early and more efficiently.
Keywords: Geographic clustering; Incidence; Lung cancer; Pennsylvania; Scan statistics; Spatio-temporal.
© 2022. The Author(s).
Conflict of interest statement
The authors declared that they have no known competing financial interests or personal relationships that could have appeared to influence the work reported in this paper.
Figures
References
-
- American College of Chest Physicians. World Lung Cancer Day 2020 Fact Sheet. Available from: https://www.chestnet.org/newsroom/chest-news/2020/07/world-lung-cancer-d.... Accessed 15 May 2022.
-
- American Lung Association. Pennsylvania, State of Lung Cancer. Available from: https://www.lung.org/research/state-of-lung-cancer/states/pennsylvania. Accessed 15 May 2022.
-
- American Cancer Society. Cancer Facts and Figures. Available from: https://www.cancer.org/content/dam/cancer-org/research/cancer-facts-and-.... Accessed 15 May 2022.
-
- Koch T. Cartographies of Disease: Maps, Mapping, and Medicine. Redlands, CA: ESRI Press; 2005.
MeSH terms
Grants and funding
LinkOut - more resources
Full Text Sources
Medical
