. 2022 May 17;14(1):50.
doi: 10.1186/s13073-022-01055-5.

Human liver single nucleus and single cell RNA sequencing identify a hepatocellular carcinoma-associated cell-type affecting survival

Affiliations

Human liver single nucleus and single cell RNA sequencing identify a hepatocellular carcinoma-associated cell-type affecting survival

Marcus Alvarez et al. Genome Med. .

Abstract

Background: Hepatocellular carcinoma (HCC) is a common primary liver cancer with poor overall survival. We hypothesized that there are HCC-associated cell-types that impact patient survival.

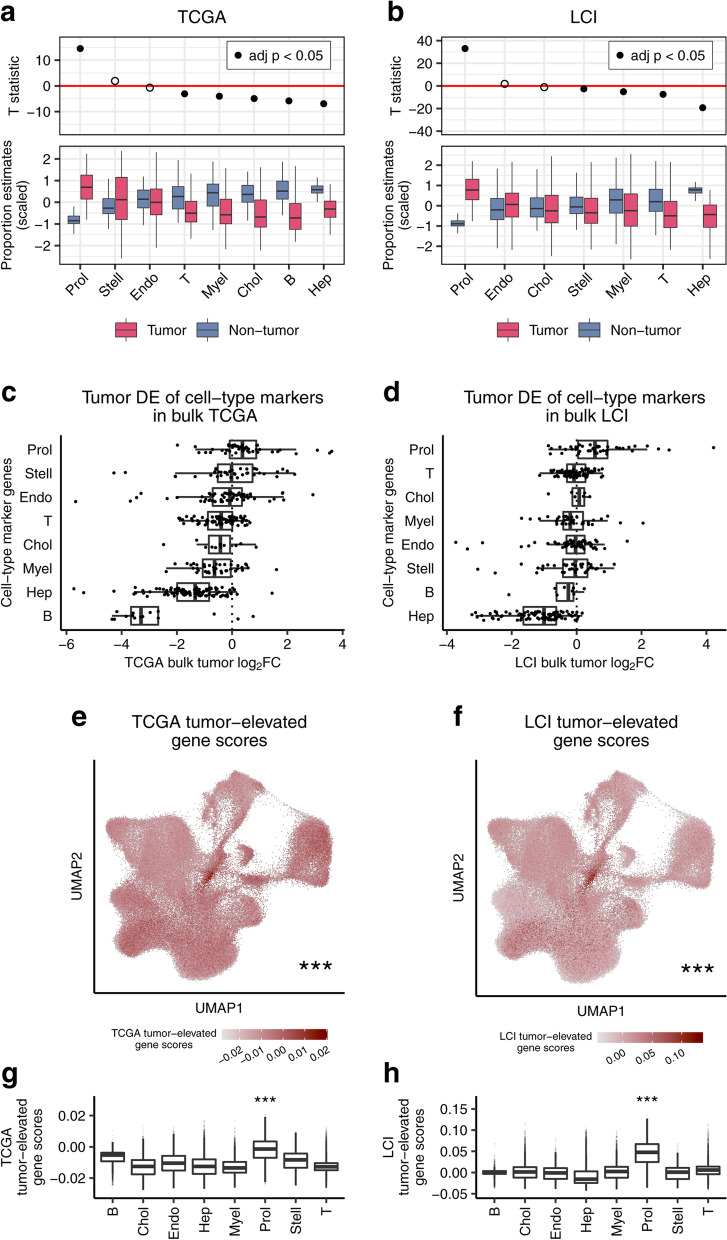
Methods: We combined liver single nucleus (snRNA-seq), single cell (scRNA-seq), and bulk RNA-sequencing (RNA-seq) data to search for cell-type differences in HCC. To first identify cell-types in HCC, adjacent non-tumor tissue, and normal liver, we integrated single-cell level data from a healthy liver cohort (n = 9 non-HCC samples) collected in the Strasbourg University Hospital; an HCC cohort (n = 1 non-HCC, n = 14 HCC-tumor, and n = 14 adjacent non-tumor samples) collected in the Singapore General Hospital and National University; and another HCC cohort (n = 3 HCC-tumor and n = 3 adjacent non-tumor samples) collected in the Dumont-UCLA Liver Cancer Center. We then leveraged these single cell level data to decompose the cell-types in liver bulk RNA-seq data from HCC patients' tumor (n = 361) and adjacent non-tumor tissue (n = 49) from the Cancer Genome Atlas (TCGA) multi-center cohort. For replication, we decomposed 221 HCC and 209 adjacent non-tumor liver microarray samples from the Liver Cancer Institute (LCI) cohort collected by the Liver Cancer Institute and Zhongshan Hospital of Fudan University.

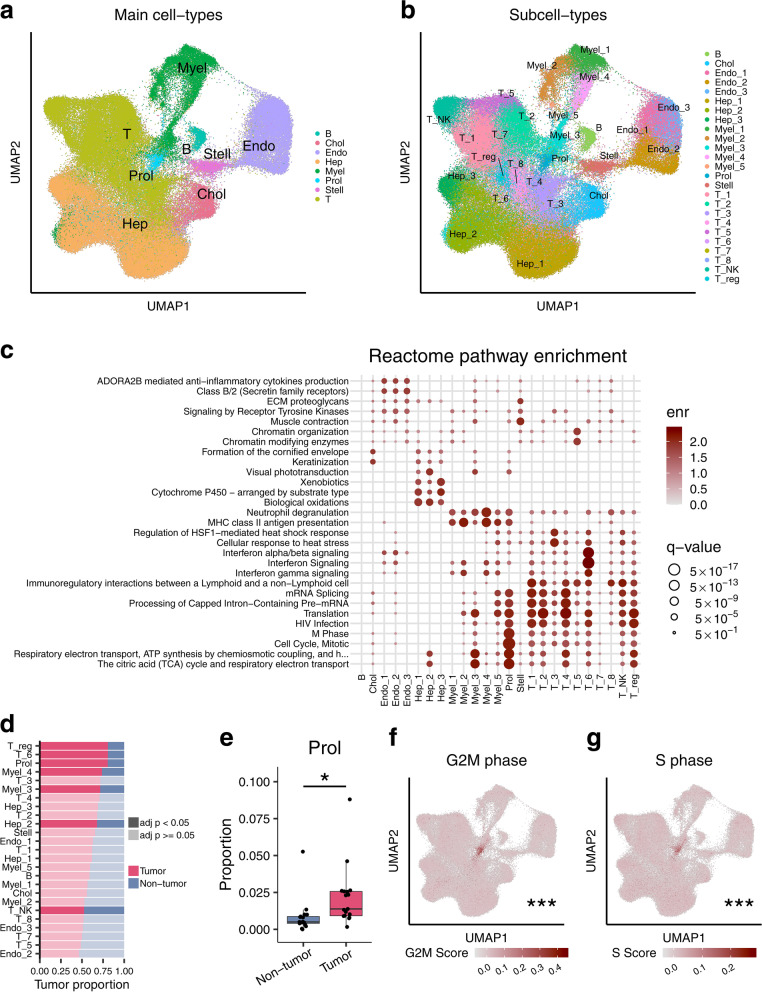
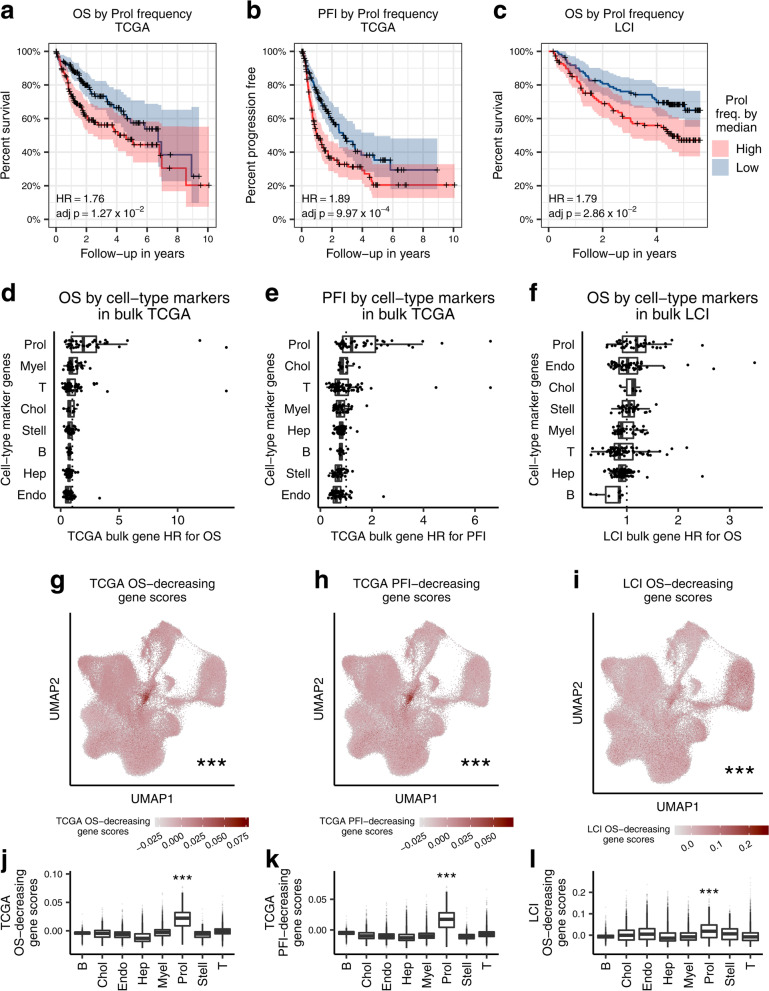
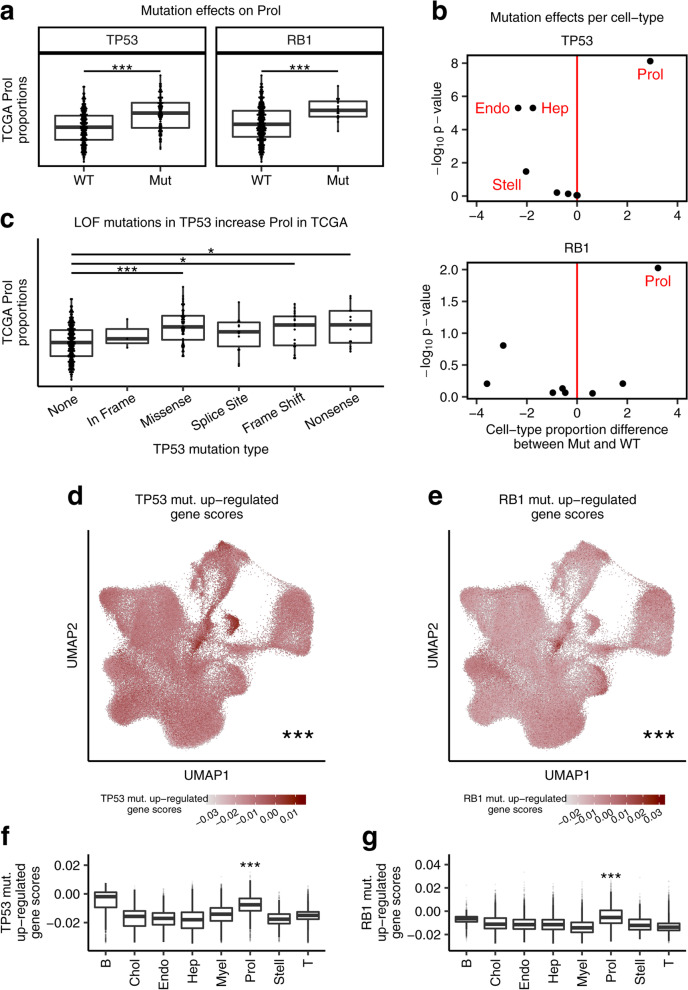
Results: We discovered a tumor-associated proliferative cell-type, Prol (80.4% tumor cells), enriched for cell cycle and mitosis genes. In the liver bulk tissue from the TCGA cohort, the proportion of the Prol cell-type is significantly increased in HCC and associates with a worse overall survival. Independently from our decomposition analysis, we reciprocally show that Prol nuclei/cells significantly over-express both tumor-elevated and survival-decreasing genes obtained from the bulk tissue. Our replication analysis in the LCI cohort confirmed that an increased estimated proportion of the Prol cell-type in HCC is a significant marker for a shorter overall survival. Finally, we show that somatic mutations in the tumor suppressor genes TP53 and RB1 are linked to an increase of the Prol cell-type in HCC.

Conclusions: By integrating liver single cell, single nucleus, and bulk expression data from multiple cohorts we identified a proliferating cell-type (Prol) enriched in HCC tumors, associated with a decreased overall survival, and linked to TP53 and RB1 somatic mutations.


Conflict of interest statement

The authors declare that they have no competing interests.

Figures

Fig. 1
Fig. 1
Multi-cohort integration of three liver HCC single cell level data sets identifies and characterizes an HCC-associated cell-type. We assessed liver cell-types and HCC-related cell-type changes by integrating Aizarani et al. [7] scRNA-seq data (n = 9 non-HCC samples), Sharma et al. [8] scRNA-seq data (n = 1 non-HCC, n = 14 HCC-tumor, and n = 14 adjacent non-tumor samples), and Rao et al. [25] snRNA-seq data (n = 3 HCC-tumor and n = 3 non-tumor samples). a, b Uniform Manifold Approximation and Projection (UMAP) visualization of 123,956 cells and nuclei integrated to remove cohort-specific effects. Clusters were assigned to (a) 8 major cell-types and (b) 25 subcell-types. c Pathway gene set enrichment analysis of the expression profiles for each subcell-type using the Reactome pathway database. The enr values indicate normalized enrichment scores and q-values denote Benjamini-Hochberg-adjusted p-values. Full pathway names are shown in Additional file 3: Table S2. d The bar plot shows the proportion of cells/nuclei in the full set of 123,956 cells/nuclei originating from HCC tumor and non-tumor samples separated by subcell-type. Darker fills indicate an FDR-adjusted p-value < 0.05 from a paired Wilcoxon test between proportions of HCC tumor and non-tumor samples. e Proportions of the Proliferative (Prol) cell-type are significantly higher in the 17 HCC tumor samples than in their 17 adjacent paired non-tumor samples after correcting for multiple testing with FDR, as assessed by a paired Wilcoxon test. f, g UMAP plots with cells/nuclei colored by their cell cycle score in the full single-cell level RNA-seq data of 123,956 droplets show that the Prol cluster consists of droplets with higher expression of (f) G2M phase genes and (g) S phase genes. The asterisks denote the significance of a difference between G2M and S phase gene scores between Prol and non-Prol cells/nuclei. Significance levels for p-values in (eg) *p < 0.05, **p < 0.005, ***p < 0.0005. B indicates B cells; Chol, cholangiocytes; Endo, endothelial cells; Hep, hepatocytes; Myel, myeloid cells; Stell, stellate cells; and T, T cells
Fig. 2
Fig. 2
Among all cell-types decomposed in the TCGA and LCI bulk liver cohorts, Prol has the highest enrichment in HCC when compared to adjacent non-tumor tissue. The Prol cell-type shows consistent upregulation in HCC tumors in two independent liver bulk cohorts. a, b Proportions were estimated in the liver bulk RNA-seq data for the major cell-types identified in the single-cell level data and then tested for differential abundance between the tumor and non-tumor samples. The upper panel shows the T-statistic from a paired t-test between tumor and adjacent non-tumor tissue, with FDR-adjusted p-values calculated from a paired Wilcoxon test. The bottom panel shows a bar plot of the proportion estimates separated by tumor status. The differential abundance tests highlight the Prol cell-type as upregulated in the (a) TCGA (n = 49) and (b) LCI (n = 209) cohorts. B cell proportions were not estimated for LCI (b) as its marker genes did not show evidence of co-expression. c, d Association of the Prol cell-type with HCC tumors is highlighted by the log2 fold-changes (log2FC) of tumor over adjacent non-tumor samples for the marker genes of the cell-types that are indicated on the y-axis. Log2FC values were derived from a paired differential expression (DE) analysis in (c) TCGA (n = 49) and (d) LCI (n = 209) cohorts. eh The Prol cells/nuclei significantly express tumor-elevated genes, as shown by droplet scores in the single-cell level data for tumor-elevated genes derived from the TCGA and LCI cohorts. Genome-wide DE analysis was performed between the paired tumor and non-tumor samples, and genes with an FDR-adjusted p-value less than 0.05 and a log2FC greater than 1 were considered tumor-elevated genes. Module scores of the tumor-elevated genes for each droplet were calculated based on their expression compared to a background set. e, f UMAP plots for (e) TCGA and (f) LCI are shown with cells and nuclei colored by their tumor module score. g, h Bar plots show the droplet tumor scores calculated from (g) TCGA and (h) LCI tumor-elevated genes separated by major cell-type. eh Asterisks denote a significant difference in gene scores between Prol and non-Prol cells/nuclei as assessed by a Wilcoxon test. Significance levels for p-values: *p < 0.05, **p < 0.005, ***p < 0.0005
Fig. 3
Fig. 3
The HCC-enriched Prol cell-type associates with overall survival (OS) and progression free interval (PFI) in TCGA and with OS in LCI. Increased Prol cell-type proportion estimates are associated with poor survival outcomes in TCGA and LCI. ac Kaplan-Meier survival curves for (a) overall survival (OS) and (b) progression free interval (PFI) in TCGA and (c) OS in LCI show worse survival outcomes for patients with high liver Prol cell-type frequency estimates. Patients with Prol frequency (freq.) estimates above and below the median were classified into high and low groups, respectively. The “+” signs on the line indicate right censoring of the event. The hazard ratios (HR) and FDR adjusted p-values were calculated from a Cox proportional hazards regression adjusting for age, sex, and for TCGA, race. df Association of the Prol cell-type with poor survival outcomes is highlighted by the HR values for cell-type marker genes calculated from a Cox proportional hazards regression of their expression in TCGA and LCI. Survival tests were performed for (d) OS and (e) PFI in TCGA and (f) OS in LCI. Each dot indicates a gene, with its HR on the x-axis and its cell-type on the y-axis. gl Module scores of survival-decreasing genes in the single-cell level data are significantly higher in cells/nuclei from the Prol cell-type. Survival-decreasing genes were derived from genome-wide Cox proportional hazards regression analyses of all genes for the indicated event and cohort and taking the genes with FDR-adjusted p-values less than 0.05 and HR values greater than 1.0 into the module score analyses in (g–l). gi UMAP plots show cells/nuclei colored by (g) TCGA OS score, (h) TCGA PFI score, and (i) LCI OS scores. j, l Bar plots of survival-decreasing module scores for (j) TCGA OS, (k) TCGA PFI, and (l) LCI OS separated by the cell-type. gl Asterisks denote a significant difference in survival-decreasing gene scores between Prol and non-Prol cells/nuclei as assessed by a Wilcoxon test. Significance levels for p-values: *p < 0.05, **p < 0.005, ***p < 0.0005
Fig. 4
Fig. 4
Associations between estimated cell-type proportions and somatic mutations in the TCGA cohort link TP53 and RB1 mutations to increased Prol abundance. Mutations associated with changes in the bulk TCGA liver proportion estimates of the Prol cell-type. a Prol proportion estimates are significantly higher in the HCC cases harboring a mutation (Mut) in TP53 (left panel) and RB1 (right panel) compared to those with both wildtype (WT) alleles. b The Prol cell type is highlighted as the only cell-type significantly increased in HCC cases with Mut TP53 and Mut RB1. Differential abundance for the 8 cell-types testing for differences in proportions between Mut vs. WT TP53 (top panel) and RB1 (bottom panel) cases. Differential abundance was performed with a Wilcoxon test (n = 357 tumor samples). The difference in means of the scaled proportions is plotted in the x-axis and the -log10 p-value in the y-axis. The vertical red line (x = 0) indicates no difference. c Prol proportion estimates are plotted against no TP53 mutation (None) and different TP53 mutation types. Prol estimates are significantly increased in individuals with loss of function (LOF) mutations in TP53. dg The cells/nuclei in the Prol cell-type significantly express mutation-upregulated genes, as shown by the droplet module scores of mutation upregulated genes for the indicated mutation in TCGA. Mutation upregulated genes were derived by running genome-wide differential expression (DE) between patients with and without a somatic mutation in the indicated gene and taking those over-expressed in HCC patients harboring a mutation and with an FDR-adjusted p value less than 0.05. Droplet module scores were calculated by comparing the average expression of mutation upregulated genes to a background set of genes. d, e UMAP of the single-cell-level data showing droplets colored by scores for genes upregulated in patients with (d) TP53 and (e) RB1 mutations. f, g Bar plots of the (e) TP53 mutation upregulated scores and (g) RB1 mutation upregulated scores separated by cell-type. d, g Asterisks denote a significant increase in mutation upregulated gene scores between Prol and non-Prol cells/nuclei as assessed by a Wilcoxon test. Significance levels for nominal p-values in (a, c, d-g): *p < 0.05, **p < 0.005, ***p < 0.0005

References

    1. Sung H, Ferlay J, Siegel RL, et al. Global Cancer Statistics 2020: GLOBOCAN estimates of incidence and mortality worldwide for 36 cancers in 185 countries. CA Cancer J Clin. 2021;71:209–249. - PubMed
    1. Singal AG, Pillai A, Tiro J. Early detection, curative treatment, and survival rates for hepatocellular carcinoma surveillance in patients with cirrhosis: a meta-analysis. PLoS Med. 2014;11:e1001624. doi: 10.1371/journal.pmed.1001624. - DOI - PMC - PubMed
    1. Jemal A, Ward EM, Johnson CJ, et al. Annual Report to the Nation on the Status of Cancer, 1975-2014, Featuring Survival. J Natl Cancer Inst. 2017;109:djx030. doi: 10.1093/jnci/djx030. - DOI - PMC - PubMed
    1. Caruso S, Calatayud AL, Pilet J, et al. Analysis of liver cancer cell lines identifies agents with likely efficacy against hepatocellular carcinoma and markers of response. Gastroenterology. 2019;157:760–776. doi: 10.1053/j.gastro.2019.05.001. - DOI - PubMed
    1. Llovet JM, Zucman-Rossi J, Pikarsky E, et al. Hepatocellular carcinoma. Nat Rev Dis Primers. 2016;2:16018. doi: 10.1038/nrdp.2016.18. - DOI - PubMed

Publication types

Substances