

Identifying common transcriptome signatures of cancer by interpreting deep learning models
- PMID: 35581644
- PMCID: PMC9112525
- DOI: 10.1186/s13059-022-02681-3
Identifying common transcriptome signatures of cancer by interpreting deep learning models
Abstract
Background: Cancer is a set of diseases characterized by unchecked cell proliferation and invasion of surrounding tissues. The many genes that have been genetically associated with cancer or shown to directly contribute to oncogenesis vary widely between tumor types, but common gene signatures that relate to core cancer pathways have also been identified. It is not clear, however, whether there exist additional sets of genes or transcriptomic features that are less well known in cancer biology but that are also commonly deregulated across several cancer types.
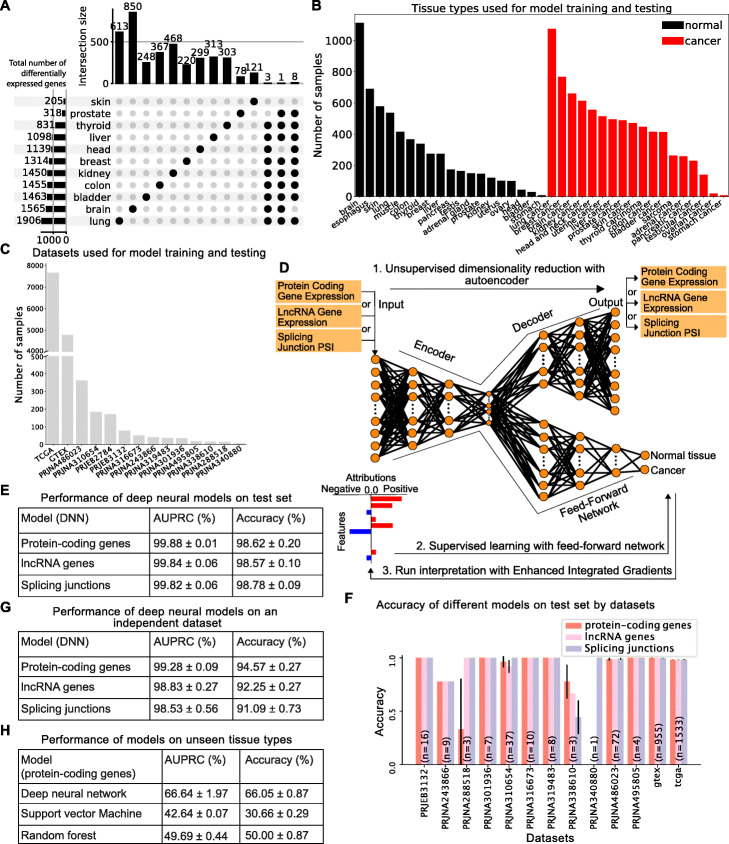
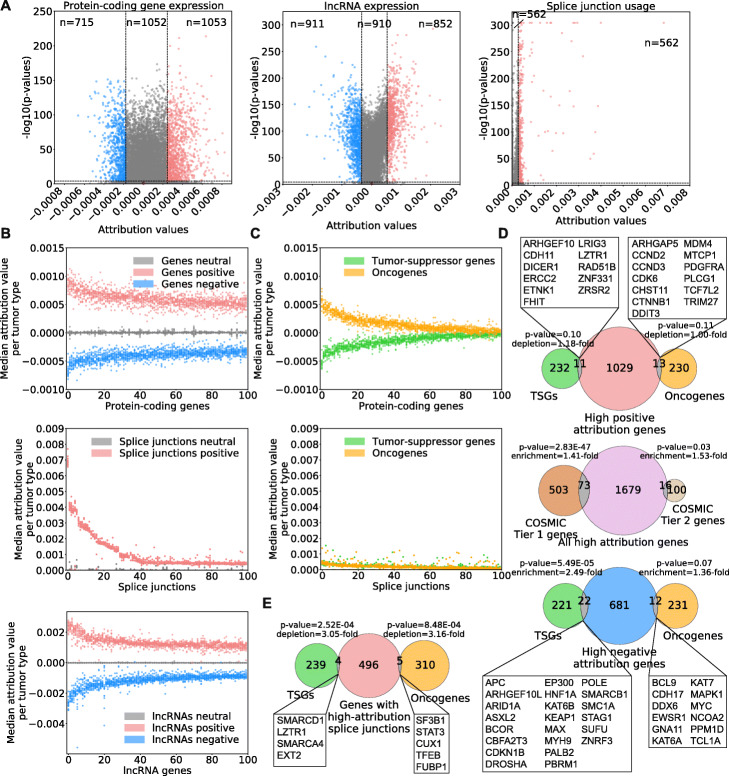
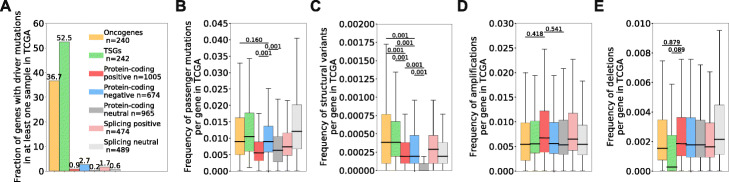
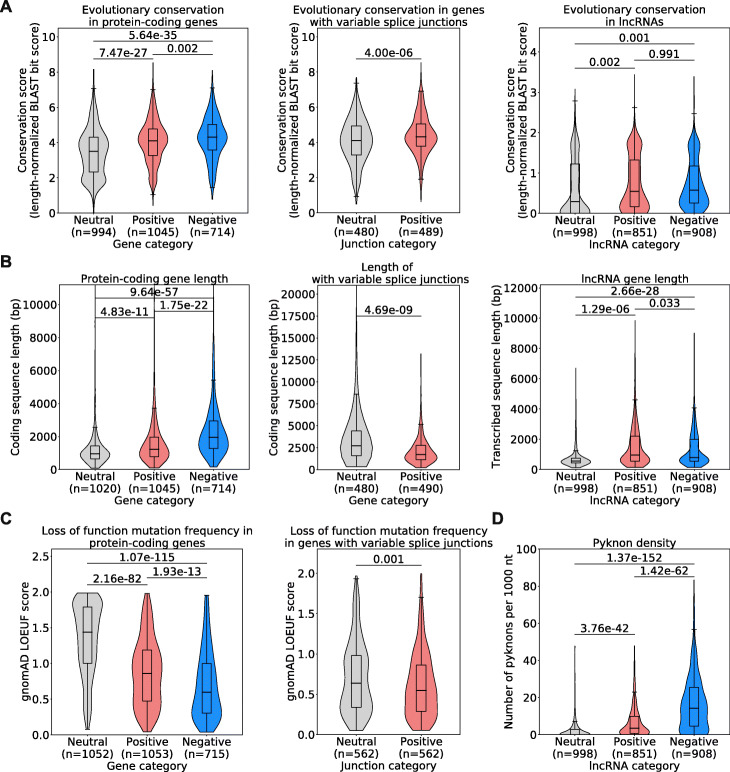
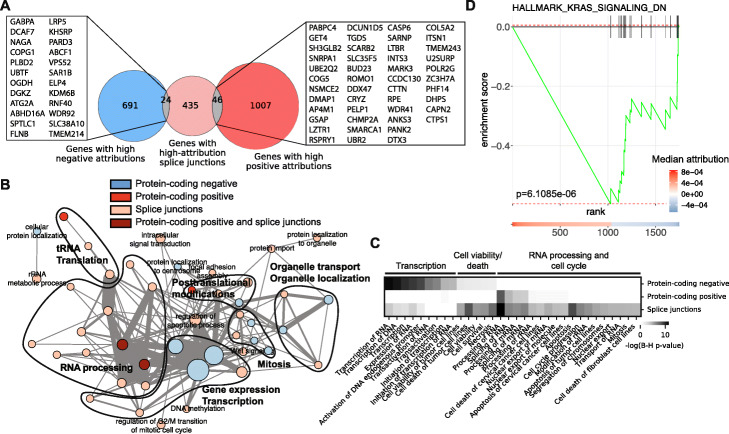
Results: Here, we agnostically identify transcriptomic features that are commonly shared between cancer types using 13,461 RNA-seq samples from 19 normal tissue types and 18 solid tumor types to train three feed-forward neural networks, based either on protein-coding gene expression, lncRNA expression, or splice junction use, to distinguish between normal and tumor samples. All three models recognize transcriptome signatures that are consistent across tumors. Analysis of attribution values extracted from our models reveals that genes that are commonly altered in cancer by expression or splicing variations are under strong evolutionary and selective constraints. Importantly, we find that genes composing our cancer transcriptome signatures are not frequently affected by mutations or genomic alterations and that their functions differ widely from the genes genetically associated with cancer.
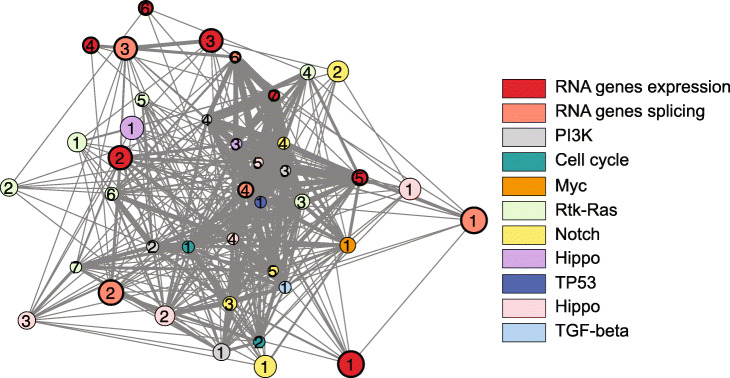
Conclusions: Our results highlighted that deregulation of RNA-processing genes and aberrant splicing are pervasive features on which core cancer pathways might converge across a large array of solid tumor types.
Keywords: Cancer genomics; Deep learning; Transcriptomics.
© 2022. The Author(s).
Conflict of interest statement
The authors declare that they have no competing interests.
Figures

Similar articles
-
Single cell genomics reveals activation signatures of endogenous SCAR's networks in aneuploid human embryos and clinically intractable malignant tumors.Cancer Lett. 2016 Oct 10;381(1):176-93. doi: 10.1016/j.canlet.2016.08.001. Epub 2016 Aug 3. Cancer Lett. 2016. PMID: 27497790
-
Graph convolution networks model identifies and quantifies gene and cancer specific transcriptome signatures of cancer driver events.Comput Biol Med. 2025 Feb;185:109491. doi: 10.1016/j.compbiomed.2024.109491. Epub 2024 Dec 19. Comput Biol Med. 2025. PMID: 39700860
-
Deep learning with evolutionary and genomic profiles for identifying cancer subtypes.J Bioinform Comput Biol. 2019 Jun;17(3):1940005. doi: 10.1142/S0219720019400055. J Bioinform Comput Biol. 2019. PMID: 31288637
-
The role of alternative splicing in cancer: From oncogenesis to drug resistance.Drug Resist Updat. 2020 Dec;53:100728. doi: 10.1016/j.drup.2020.100728. Epub 2020 Sep 28. Drug Resist Updat. 2020. PMID: 33070093 Review.
-
Opportunities and methods for studying alternative splicing in cancer with RNA-Seq.Cancer Lett. 2013 Nov 1;340(2):179-91. doi: 10.1016/j.canlet.2012.11.010. Epub 2012 Nov 27. Cancer Lett. 2013. PMID: 23196057 Review.
Cited by
-
Deep Learning Approaches for lncRNA-Mediated Mechanisms: A Comprehensive Review of Recent Developments.Int J Mol Sci. 2023 Jun 18;24(12):10299. doi: 10.3390/ijms241210299. Int J Mol Sci. 2023. PMID: 37373445 Free PMC article. Review.
-
Designing interpretable deep learning applications for functional genomics: a quantitative analysis.Brief Bioinform. 2024 Jul 25;25(5):bbae449. doi: 10.1093/bib/bbae449. Brief Bioinform. 2024. PMID: 39293804 Free PMC article. Review.
-
Novel research and future prospects of artificial intelligence in cancer diagnosis and treatment.J Hematol Oncol. 2023 Nov 27;16(1):114. doi: 10.1186/s13045-023-01514-5. J Hematol Oncol. 2023. PMID: 38012673 Free PMC article. Review.
-
Pathologic features of brain hemorrhage after radiation treatment: case series with somatic mutation analysis.J Stroke Cerebrovasc Dis. 2024 Jul;33(7):107699. doi: 10.1016/j.jstrokecerebrovasdis.2024.107699. Epub 2024 Mar 27. J Stroke Cerebrovasc Dis. 2024. PMID: 38552890 Free PMC article.
-
Transcriptional patterns of cancer-related genes in primary and metastatic tumours revealed by machine learning.BMC Biol. 2025 Aug 7;23(1):246. doi: 10.1186/s12915-025-02339-z. BMC Biol. 2025. PMID: 40775769 Free PMC article.
References
-
- Paull EO, Aytes A, Jones SJ, Subramaniam PS, Giorgi FM, Douglass EF, Tagore S, Chu B, Vasciaveo A, Zheng S, Verhaak R, Abate-Shen C, Alvarez MJ, Califano A. A modular master regulator landscape controls cancer transcriptional identity. Cell. 2021;184(2):334–35120. doi: 10.1016/j.cell.2020.11.045. - DOI - PMC - PubMed
-
- Dave SS, Wright G, Tan B, Rosenwald A, Gascoyne RD, Chan WC, Fisher RI, Braziel RM, Rimsza LM, Grogan TM, et al. Prediction of survival in follicular lymphoma based on molecular features of tumor-infiltrating immune cells. N Engl J Med. 2004;351(21):2159–69. doi: 10.1056/NEJMoa041869. - DOI - PubMed
-
- Roessler S, Jia H-L, Budhu A, Forgues M, Ye Q-H, Lee J-S, Thorgeirsson SS, Sun Z, Tang Z-Y, Qin L-X, et al. A unique metastasis gene signature enables prediction of tumor relapse in early-stage hepatocellular carcinoma patients. Cancer Res. 2010;70(24):10202–12. doi: 10.1158/0008-5472.CAN-10-2607. - DOI - PMC - PubMed
Publication types
MeSH terms
Grants and funding
LinkOut - more resources
Full Text Sources
Medical
