

Tensor Gradient L₀-Norm Minimization-Based Low-Dose CT and Its Application to COVID-19
- PMID: 35582003
- PMCID: PMC8769022
- DOI: 10.1109/TIM.2021.3050190
Tensor Gradient L₀-Norm Minimization-Based Low-Dose CT and Its Application to COVID-19
Abstract
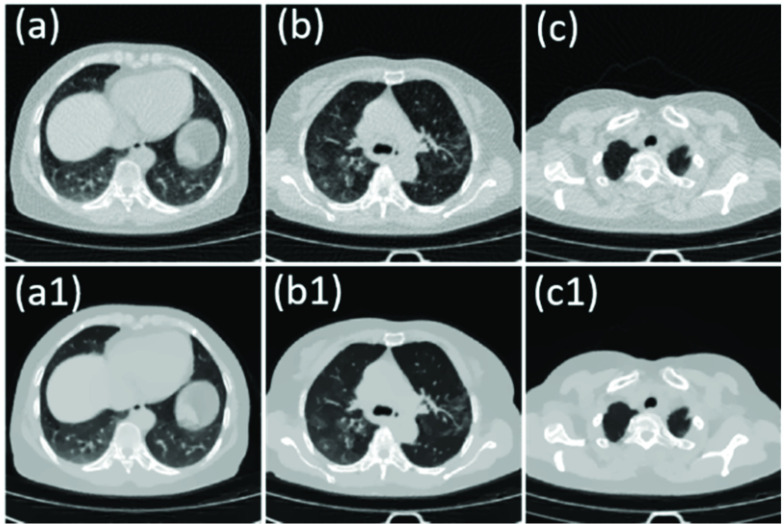
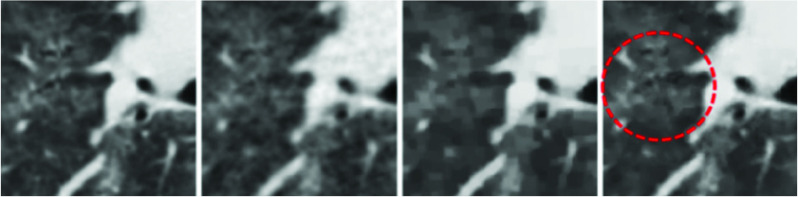
Methods to recover high-quality computed tomography (CT) images in low-dose cases will be of great benefit. To reach this goal, sparse-data subsampling is one of the common strategies to reduce radiation dose, which is attracting interest among the researchers in the CT community. Since analytic image reconstruction algorithms may lead to severe image artifacts, the iterative algorithms have been developed for reconstructing images from sparsely sampled projection data. In this study, we first develop a tensor gradient L0-norm minimization (TGLM) for low-dose CT imaging. Then, the TGLM model is optimized by using the split-Bregman method. The Coronavirus Disease 2019 (COVID-19) has been sweeping the globe, and CT imaging has been deployed for detection and assessing the severity of the disease. Finally, we first apply our proposed TGLM method for COVID-19 to achieve low-dose scan by incorporating the 3-D spatial information. Two COVID-19 patients (64 years old female and 56 years old man) were scanned by the [Formula: see text]CT 528 system, and the acquired projections were retrieved to validate and evaluate the performance of the TGLM.
Keywords: Chest CT; Coronavirus Disease 2019 (COVID-19); low-dose computed tomography (CT); tensor gradient L₀-norm.
Figures


Similar articles
-
Low-dose spectral CT reconstruction using image gradient ℓ 0-norm and tensor dictionary.Appl Math Model. 2018 Nov;63:538-557. doi: 10.1016/j.apm.2018.07.006. Epub 2018 Jul 21. Appl Math Model. 2018. PMID: 32773921 Free PMC article.
-
Locally linear transform based three-dimensional gradient -norm minimization for spectral CT reconstruction.Med Phys. 2020 Oct;47(10):4810-4826. doi: 10.1002/mp.14420. Epub 2020 Aug 25. Med Phys. 2020. PMID: 32740956
-
Low dose CT reconstruction via L1 norm dictionary learning using alternating minimization algorithm and balancing principle.J Xray Sci Technol. 2018;26(4):603-622. doi: 10.3233/XST-17358. J Xray Sci Technol. 2018. PMID: 29689766
-
Basics of iterative reconstruction methods in computed tomography: A vendor-independent overview.Eur J Radiol. 2018 Dec;109:147-154. doi: 10.1016/j.ejrad.2018.10.025. Epub 2018 Oct 26. Eur J Radiol. 2018. PMID: 30527298 Review.
-
CT artifact correction for sparse and truncated projection data using generative adversarial networks.Med Phys. 2021 Feb;48(2):615-626. doi: 10.1002/mp.14504. Epub 2020 Dec 30. Med Phys. 2021. PMID: 32996149 Review.
Cited by
-
A proficient approach to forecast COVID-19 spread via optimized dynamic machine learning models.Sci Rep. 2022 Feb 14;12(1):2467. doi: 10.1038/s41598-022-06218-3. Sci Rep. 2022. PMID: 35165290 Free PMC article.
-
Semi-Supervised KPCA-Based Monitoring Techniques for Detecting COVID-19 Infection through Blood Tests.Diagnostics (Basel). 2023 Apr 18;13(8):1466. doi: 10.3390/diagnostics13081466. Diagnostics (Basel). 2023. PMID: 37189568 Free PMC article.
-
Deep Generative Learning-Based 1-SVM Detectors for Unsupervised COVID-19 Infection Detection Using Blood Tests.IEEE Trans Instrum Meas. 2021 Nov 25;71:2500211. doi: 10.1109/TIM.2021.3130675. eCollection 2022. IEEE Trans Instrum Meas. 2021. PMID: 35582656 Free PMC article.
-
McS-Net: Multi-class Siamese network for severity of COVID-19 infection classification from lung CT scan slices.Appl Soft Comput. 2022 Dec;131:109683. doi: 10.1016/j.asoc.2022.109683. Epub 2022 Oct 17. Appl Soft Comput. 2022. PMID: 36277300 Free PMC article.
References
-
- Han Y. and Ye J. C., “Framing U-Net via deep convolutional framelets: Application to sparse-view CT,” IEEE Trans. Med. Imag., vol. 37, no. 6, pp. 1418–1429, Jun. 2018. - PubMed
-
- Wu W.et al., “Stabilizing deep tomographic reconstruction networks,” 2020, arXiv:2008.01846. [Online]. Available: http://arxiv.org/abs/2008.01846
-
- Tuy H. K., “An inversion formula for cone-beam reconstruction,” SIAM J. Appl. Math., vol. 43, no. 3, pp. 546–552, Jun. 1983.
-
- Eda S., Kubo K., Fujimoto K., Matsuzawa Y., Sekiguchi M., and Sakai F., “The relations between expiratory chest CT using helical CT and pulmonary function tests in emphysema,” Amer. J. Respiratory Crit. Care Med., vol. 155, no. 4, pp. 1290–1294, 1997. - PubMed
LinkOut - more resources
Full Text Sources