. 2022 May 11;9(5):211893.
doi: 10.1098/rsos.211893. eCollection 2022 May.

Radial porosity profiles: a new bone histological method for comparative developmental analysis of diametric limb bone growth

Affiliations

Radial porosity profiles: a new bone histological method for comparative developmental analysis of diametric limb bone growth

Edina Prondvai et al. R Soc Open Sci. .

Abstract

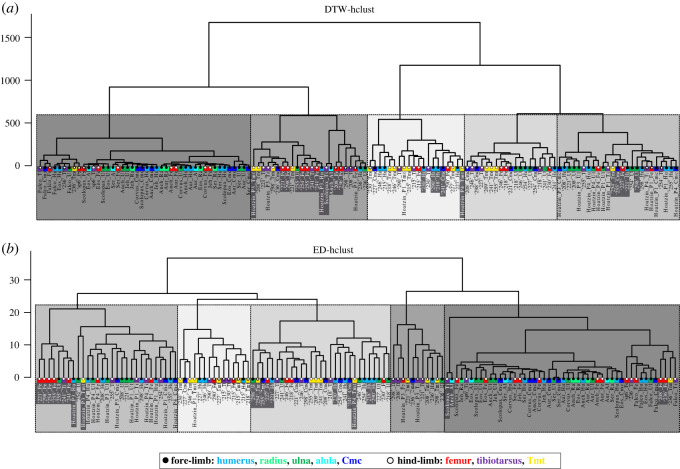
In fossil tetrapods, limb bone histology is considered the most reliable tool not only for inferring skeletal maturity-a crucial assessment in palaeobiological and evolutionary studies-but also for evaluating the growth dynamics within the ontogenetic window represented by the primary bone cortex. Due to its complex relationship with bone growth and functional maturation, primary cortical vascularity is an indispensable osteohistological character for reconstructing growth dynamics, especially in the context of various developmental strategies along the precocial-altricial spectrum. Using this concept as our working hypothesis, we developed a new quantitative osteohistological parameter, radial porosity profile (RPP), that captures relative cortical porosity changes in limb bones as trajectories. We built a proof-of-concept RPP dataset on extant birds, then added fossil paravian dinosaurs and performed a set of trajectory-grouping analyses to identify potential RPP categories and evaluate them in the context of our ontogeny-developmental strategy working hypothesis. We found that RPPs, indeed, reflect important developmental features within and across elements, specimens and taxa, supporting their analytical power. Our RPPs also revealed unexpected potential osteohistological correlates of growth and functional development of limb bones. The diverse potential applications of RPPs open up new research directions in the evolution of locomotor ontogeny.

Keywords: birds; growth and functional maturity; ontogeny; precocial–altricial development; quantitative bone histology; radial porosity profile.


Conflict of interest statement

The authors have no conflict of interest to declare.

Figures

Figure 1.
Figure 1.
Patterns of development of primary cortical porosity in the growing limb bones of ducks (ag) and an adult rook (h,i) shown in mid-shaft transverse ground sections. (a,b) Overview of the sections of humerus and femur of duckling ‘218’ at 8 dph following altricial and precocial development, respectively. Black dashed arrows indicate direction of radial cortex growth from medullary cavity (mc) to periosteal surface (ps). Note the more compact inner bony ring representing the prehatching cortex (prc) and the highly porous early stage posthatching cortex (poc) separated by a distinct hatching line (hl). (c,d) Humerus and femur of duckling ‘241’ with different degrees of osteonal compaction of vascular spaces from the inner to the outer cortex at 15 dph. Higher osteonal compaction is evident in the inner cortex of the precocially developing femur. (e) Radius of ‘241’ at 15 dph showing a partial layer of early developing endosteal lamellae (el) rimming the medullary cavity and large resorption cavities in between the pre- and posthatching cortices. A thick layer of the soft periosteum (po) is also preserved in this section. (f) Tibia of duckling ‘221’ at 30 dph reveals active resorption opening up large cavities between a prominent layer of endosteal lamellae and the innermost primary bone cortex with some primary bone remnants still visible inside the resorption cavities. Enlarged vascular spaces (svs) in this area also indicate inner cortical resorption associated with medullary cavity expansion. Note (also in e) that in contrast with the general assumption (see main text and electronic supplementary material, Information), the EL is present despite the still ongoing radial cortical growth and dynamically changing and expanding medullary cavity. Well-developed primary osteons (pro) characterize most of the cortex at this stage; however, the outer cortical region clearly shows less compacted vascular spaces, i.e. higher porosity, indicating still ongoing diametric bone growth. (g) Femur of an adult duck of unknown age. Note the abrupt decrease in vascularity from the inner to the outer cortex. However, only incipient OCL and no EL can be observed. (h,i) Femur of an adult rook (Corvus frugilegus) showing tripartite cortex with well-developed EL (el), vascularized but highly compacted primary cortex, and a thick OCL. Note in (i) that the diameters of highly compacted vascular canals (versus) are almost within the size range of the osteocytic lacunae. Scale bars: 300 µm in (a,b,f); 120 µm in (ce), (g,h); 50 µm in (i).
Figure 2.
Figure 2.
Measurement method for defining RPP shown on the example of the humeral cross-section of the duckling ‘218’ at 8 dph. (a) The positions of the three sectors (green shaded polygons) are assigned based on set homologous anatomical directions and/or to cover representative and roughly equally distributed sampling areas in the posthatching cortex. Note that the shapes and dimensions of sectors 1, 2 and 3 are not set the same but are rather adjusted to local posthatching cortex qualities, including cortex thickness, radial growth direction, arch shape of inner and outer posthatching cortex surface, and a representative inclusion of primary cortical porosity in each quadrant (Q). (b) The outline and subdivision of the sectors into four quadrants (3Qa-d), using sector 3 as an example. The radial extent of each quadrant is determined by dividing the lengths of the two radii (r1 and r2) of the polygon into four equal sections. 3Qa designates the innermost (i.e. oldest) and 3Qd the outermost (i.e. youngest) posthatching cortical quadrant. (c) Areas of vascular spaces (v, blue shaded areas) are measured in each quadrant separately, and porosity (P) is determined as the percentage of the summed area of all vascular spaces (V) in a quadrant to total quadrant area. The porosity values of the four quadrants give the RPP of sector 3 taken from the inner (3Qa) to the outer (3Qd) cortex. (d) RPPs taken of the three sectors demonstrated in a single graph reflecting RPP diversity throughout the cortex. (e) Mean RPP of the humerus of ‘218’ calculated from the mean porosity values of matching quadrants over the three sectors. Scale bars: 300 µm in (a); 120 µm in (b,c).
Figure 3.
Figure 3.
Various visual RPP assessments using graphical representations exemplified on the RPPs of the 15 dph cohort of ducklings. (a) RPPs of homologous bones in ducklings ‘241’, ‘254’ and ‘255’ showing both intrasectional (among sectors) and intracohort (among specimens) variance at 15 dph. Note that the porosity value of Qa in a single tibial RPP is off the scale which is due to its Qa being occupied by a large resorption cavity. Line types and colours code the sectors and specimens, respectively, as indicated in the panel legend. (b) Intracohort variance among homologous bones narrowed down to mean RPPs averaged over all sectors in each element. Line types and colours code the specimens and elements, respectively, as indicated in the panel legend. (c) Mean RPPs averaged over homologous bones of pooled individuals within the cohort. Line types and colours code fore-limb versus hind-limb and elements, respectively, as indicated in the panel legend. (d) Mean RPPs averaged over all fore-limb versus all hind-limb elements of pooled duck individuals within the cohort. Line types code fore-limb versus hind-limb, as indicated in the panel legend. Abbreviations: cmc, carpometacarpus; tmt, tarsometatarsus.
Figure 4.
Figure 4.
Summary of results of the GBTM analysis of the duck RPP dataset. (a) Model selection output of CVE, AIC and BIC showing that the overall best-supported group number is four with a polynomial degree of two. (b) Predicted trajectories of the four groups of RPPs indicated by different colours and the mean RPP averaged over the dataset shown with a dashed line. (cf) RPP distribution pattern in each group overlain by their respective estimated trajectories.
Figure 5.
Figure 5.
4-group K-means clustering of the duck RPP dataset—excluding two hind-limb elements with missing data points—demonstrated by different graphical representations. (a) Raw RPPs with their cluster memberships indicated by the four different colours. (b) Cluster compositions with each element identifiable within their respective groups. Elements are sorted along the horizontal axis by the age of the ducks. Black polygons connect bones belonging to the same individual. Note how cluster memberships within cohorts reflect the characteristics of skeletal dissociation (i.e. assignment of an individual's bones into different clusters) as ontogeny progresses, showing a trend of separation of certain wing and leg elements. Colours indicate homologous elements as shown in the legend. Element IDs as given in the electronic supplementary material, table S1.
Figure 6.
Figure 6.
Clustering of the complete RPP dataset—including RPPs with missing points—by DTW-hclust (a) and ED-hclust (b) with cut-off points at five groups demonstrated on dendrograms. Clusters are indicated by five different shades of grey with each shade representing a corresponding cluster-pair between (a) DTW-hclust and (b) ED-hclust dendrograms. Corresponding cluster-pairs were assessed based on the high congruency in cluster composition. Elements that have differing cluster assignments in DTW-hclust and ED-hclust are highlighted by white font against a dark grey background. Overall, 82% of the elements are clustered identically. Colours indicate homologous bones, black and white circles indicate fore- and hind-limb elements, respectively, as shown in the legend. Element IDs as given in the electronic supplementary material, table S1.

References

    1. Chinsamy A. 1997. Assessing the biology of fossil vertebrates through bone histology. Palaeont. Afr. 33, 29-35.
    1. De Ricqlès A, Castanet J, Francillon-Vieillot H. 2004. The ‘message’ of bone tissue in paleoherpetology. Ital. J. Zool. 71, 3-12. (10.1080/11250000409356599) - DOI
    1. Sánchez-Villagra MR. 2010. Developmental palaeontology in synapsids: the fossil record of ontogeny in mammals and their closest relatives. Proc. R. Soc. B 277, 1139-1147. (10.1098/rspb.2009.2005) - DOI - PMC - PubMed
    1. Varricchio DJ. 2010. A distinct dinosaur life history? Hist. Biol. 23, 91-107. (10.1080/08912963.2010.500379) - DOI
    1. Heers AM, Dial KP. 2012. From extant to extinct: locomotor ontogeny and the evolution of avian flight. Trends Ecol. Evol. 27, 296-305. (10.1016/j.tree.2011.12.003) - DOI - PubMed

LinkOut - more resources