. 2022 Jun;55(6):e13235.
doi: 10.1111/cpr.13235. Epub 2022 May 17.

Hoxb5 reprogrammes murine multipotent blood progenitors into haematopoietic stem cell-like cells

Affiliations

Hoxb5 reprogrammes murine multipotent blood progenitors into haematopoietic stem cell-like cells

Dehao Huang et al. Cell Prolif. 2022 Jun.

Abstract

Objectives: The expression of transcription factor Hoxb5 specifically marks the functional haematopoietic stem cells (HSC) in mice. However, our recent work demonstrated that ectopic expression of Hoxb5 exerted little effect on HSC but could convert B-cell progenitors into functional T cells in vivo. Thus, cell type- and development stage-specific roles of Hoxb5 in haematopoietic hierarchy await more extensive exploration. In this study, we aim to investigate the effect of Hoxb5 expression in multipotent blood progenitor cells.

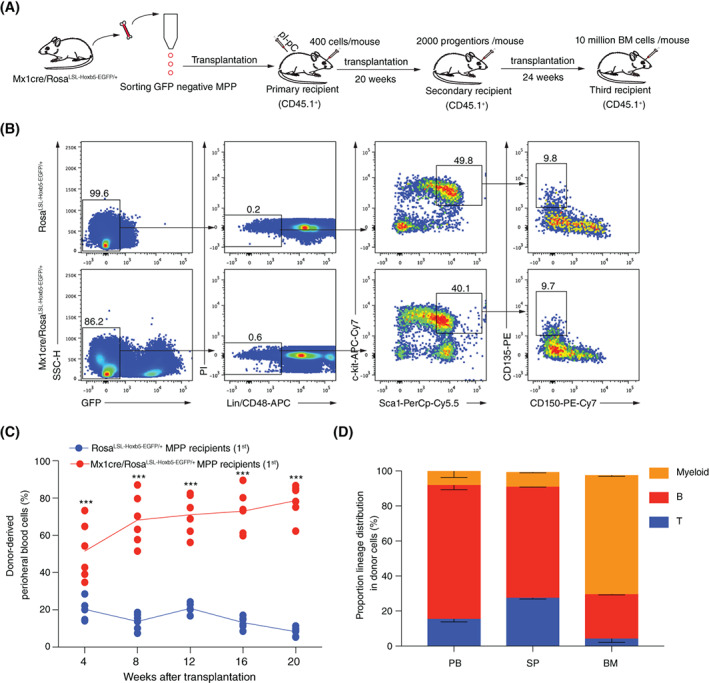
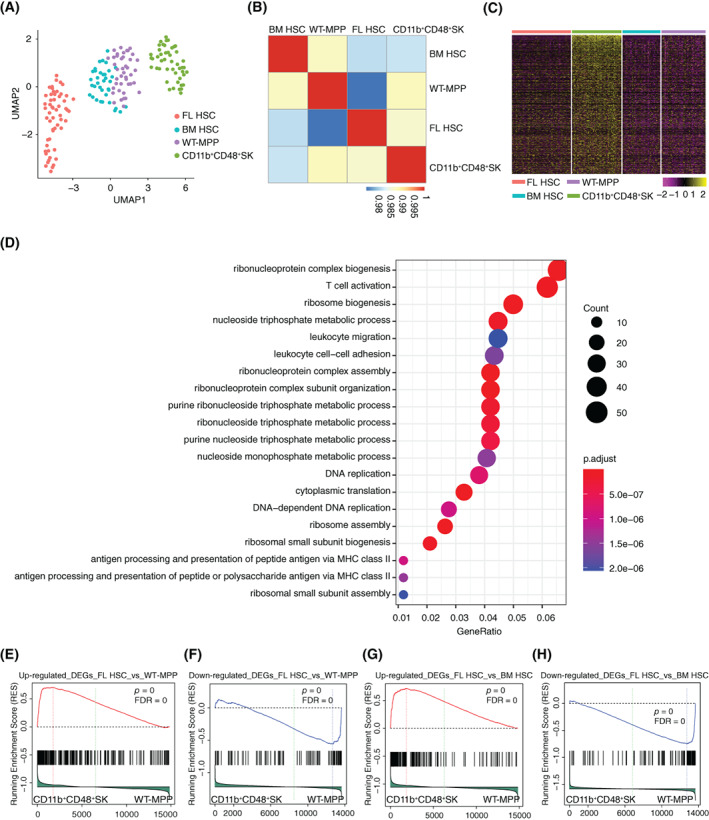
Materials and methods: A Mx1cre/RosaLSL-Hoxb5-EGFP/+ mouse model was used to evaluate the effect of Hoxb5 expression in blood multipotent progenitor cells (MPP). Golden standard serial transplantation experiments were used to test the long-term haematopoiesis potential of Hoxb5-expressing MPP. Single-cell RNA-seq analysis was used to characterize the gained molecular features of Hoxb5-expressing MPP and to compare with the global transcriptome features of natural adult HSC and fetal liver HSC (FL HSC).

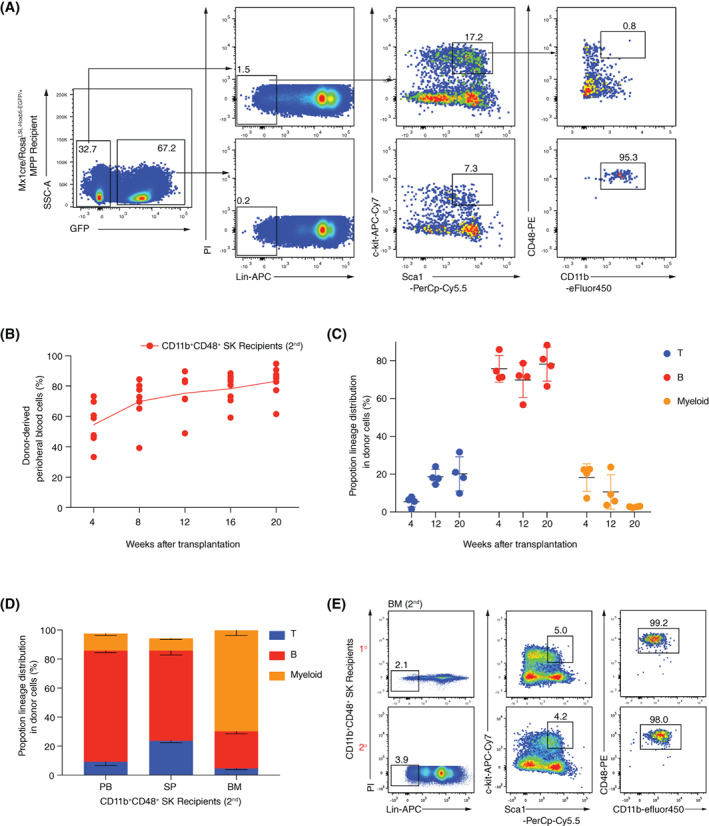
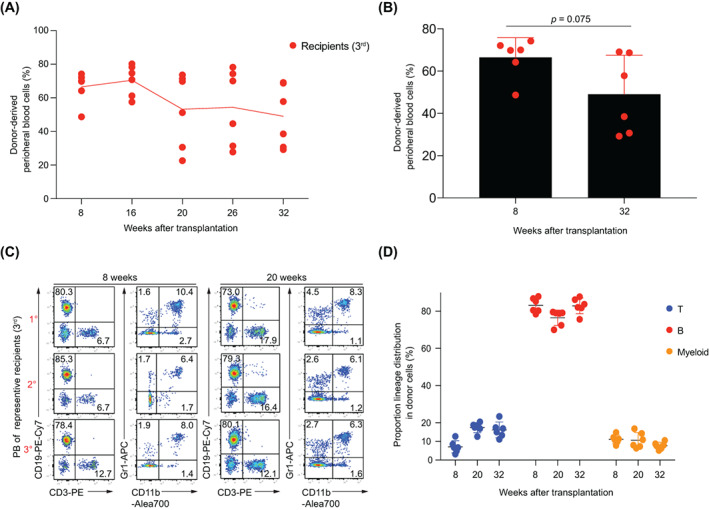
Results: Here, with a mouse strain engineered with conditional expression of Hoxb5, we unveiled that induced expression of Hoxb5 in MPP led to the generation of a de novo Sca1+ c-kit+ CD11b+ CD48+ (CD11b+ CD48+ SK) cell type, which can repopulate long-term multilineage haematopoiesis in serial transplantations. RNA-seq analysis showed that CD11b+ CD48+ SK cells exhibited acquired features of DNA replication and cell division.

Conclusions: Our current study uncovers that Hoxb5 can empower MPP with self-renewal ability and indicates an alternative approach for generating HSC-like cells in vivo from blood lineage cells.


Conflict of interest statement

The authors declare that there are no competing financial interests in relation to the work described.

Figures

FIGURE 1
FIGURE 1
Overexpression of Hoxb5 empowers long‐term reconstitution capacity on MPP. (A) The scheme for MPP transplantation. (B) Gating strategy for sorting the MPP. MPP were defined as CD45.2+GFPLin (CD2CD3CD4CD8CD11bGr1B220Ter119) CD48Sca1+c‐kit+CD150CD135+ from either the Mx1cre/RosaLSL‐Hoxb5‐EGFP/+ mice or RosaLSL‐Hoxb5‐EGFP/+ control mice (8‐week old). The sorted MPP were transplanted into lethally irradiated (9.0 Gy) recipients (CD45.1+, C57BL/6 background, 400 cells/mouse) with Sca1 helper cells (CD45.1+, 0.25 million/mouse). Recipients were injected with pIpC (i.p. 250 μg/mouse) every other day for six times starting from day 5 before transplantation. (C) Contribution curves of the donor‐derived cells in peripheral blood cells (PB) of the primary recipients. The donor cells were defined as CD45.2+GFP+ (Mx1cre/RosaLSL‐Hoxb5‐EGFP/+ MPP recipients) or CD45.2+ (RosaLSL‐Hoxb5‐EGFP/+ recipients). The PB of the recipients transplanted with Mx1cre/RosaLSL‐Hoxb5‐EGFP/+ MPP (n = 6, as indicated by the red dot) or RosaLSL‐Hoxb5‐EGFP/+ MPP (n = 6, as indicated by the blue dot) was analysed every 4 weeks until the Week 20 after transplantation. Mean ± SD, ***p < 0.001 independent samples t‐test. (D) Lineage distribution of the recipients (n = 3) at Week 20 after Mx1cre/RosaLSL‐Hoxb5‐EGFP/+ MPP transplantation. Columns shown are percentages of donor‐derived T cells (CD3+), B cells (CD19+) and myeloid cells (CD11b+ or Gr1+) in PB, spleen (SP) and bone marrow (BM)
FIGURE 2
FIGURE 2
A de novo CD11b+CD48+SK cell population reconstitutes haematopoiesis in secondary recipients. (A) FACS analysis of the donor‐derived BM progenitors in the primary recipients at Week 20 post‐transplantation. Antibodies of lineages (CD2CD3CD4CD8Gr1B220Ter119) (Lin), Sca1, c‐kit, CD11b and CD48 were stained the BM of Mx1cre/RosaLSL‐Hoxb5‐EGFP/+ MPP recipients. CD11b+CD48+SK cells were defined as CD45.2+GFP+LinSca1+c‐kit+CD48+CD11b+ were sorted from the primary recipients at Week 20 post‐transplantation and retro‐orbitally transplanted into the lethally irradiated secondary recipients (CD45.1+, C57BL/6 background, 2000 cells/mouse). (B) Chimeras curves of the donor cells to the peripheral blood (PB) cells of the secondary recipients (n = 7, as indicated by the red dot). For the secondary transplantation, CD11b+CD48+SK cells were retro‐orbitally injected into the lethally irradiated recipients (9.0 Gy, 2000 cells/mouse). The donor‐derived cells (CD45.2+GFP+) in the PB were analysed every 4 weeks post‐transplantation. (C) Lineage distribution in PB of the secondary recipients (n = 4) at weeks 4, 12 and 20 post‐transplantation. Proportions of the CD3+ (T), CD19+ (B) and CD11b+ (myeloid) in donor‐derived cells were analysed. Each symbol represents an individual host mouse. (D) Lineage distribution of the recipients (n = 3) at Week 24 after CD11b+CD48+SK cell transplantation. Columns shown are percentages of donor‐derived T cells (CD3+), B cells (CD19+) and myeloid cells (CD11b+ or Gr1+) in PB, spleen (SP) and bone marrow (BM). (E) Immunophenotypes of the donor‐derived CD11b+CD48+SK cells in the bone marrow (BM) of the secondary recipients (two representative mice)
FIGURE 3
FIGURE 3
CD11b+CD48+SK cells still maintained the repopulation capacity in the third transplantation recipients. (A) Chimeric curves of the donor cells in PB of the secondary recipients (n = 6, as indicated by the red dot). Donor‐derived cells (CD45.2+GFP+) in PB were analysed at weeks 8, 16, 20, 26 and 32 post‐transplantation. For the third transplantation, recipients (CD45.1+, C57BL/6 background) were lethally irradiated and then were retro‐orbitally injected with the nucleated BM cells (10 million/mouse) isolated from the secondary recipients. (B) Comparison of the donor‐derived cells (CD45.2+GFP+) at Weeks 8 and 32 post‐transplantation. Mean ± SD, no significant difference, p = 0.075, independent samples t‐test. (C) Representative FACS analysis (n = 3, as indicated by the red dot) of the PB from the third transplantation recipients (3rd) after transplanting with the total BM cells of the secondary recipients at Weeks 8 and 20 post‐transplantation. (D) Lineage distribution in PB of the third recipients (n = 6) at Weeks 8, 20 and 32 post‐transplantation. Proportions of CD3+ (T), CD19+ (B), CD11b+or Gr1+ (myeloid) in donor‐derived cells were analysed. Each symbol represents an individual host mouse
FIGURE 4
FIGURE 4
Characterization of CD11b+CD48+SK cells at single‐cell resolution. (A) UMAP analysis of the WT‐MPP (n = 42), BM HSC (n = 36), FL HSC (n = 56) and CD11b+CD48+SK cells (n = 47). Each colour represents one of the four cell populations. (B) Spearman correlation analysis of the WT‐MPP, BM HSC, FL HSC and CD11b+CD48+SK cells. (C) Heatmap analysis of CD11b+CD48+SK cells and other three populations (BM HSC, WT‐MPP and FL HSC). Upregulated differential expressed genes of CD11b+CD48+SK cells were used for plotting. (D) Gene ontology (GO) enrichment analysis of upregulated DEGs (adjusted p value <0.05) in (C) of CD11b+CD48+SK cells. (E) Gene set enrichment analysis of WT‐MPP (n = 42) and CD11b+CD48+SK cells (n = 47). The gene set used for analysis was from the upregulated genes in FL HSC (n = 56) versus WT‐MPP (n = 42) (adjusted p value <0.05). (F) Gene set enrichment analysis of WT‐MPP (n = 42) and CD11b+CD48+SK cells (n = 47). The gene set used for analysis was from the downregulated genes in FL HSC (n = 56) versus WT‐MPP (n = 42) (adjusted p value <0.05). (G) Gene set enrichment analysis of WT‐MPP (n = 42) and CD11b+CD48+SK cells (n = 47). The gene set used for analysis was from the upregulated genes in FL HSC (n = 56) versus BM HSC (n = 36) (adjusted p value <0.05). (H) Gene set enrichment analysis of WT‐MPP (n = 42) and CD11b+CD48+SK cells (n = 47). The gene set used for analysis was from the downregulated genes in FL HSC (n = 56) versus BM HSC (n = 36) (adjusted p value <0.05)

Similar articles

Cited by

References

    1. Morrison SJ, Weissman IL. The long‐term repopulating subset of hematopoietic stem cells is deterministic and isolatable by phenotype. Immunity. 1994;1:661‐673. doi:10.1016/1074-7613(94)90037-x - DOI - PubMed
    1. Seita J, Weissman IL. Hematopoietic stem cell: self‐renewal versus differentiation. Wiley Interdiscip Rev Syst Biol Med. 2010;2:640‐653. doi:10.1002/wsbm.86 - DOI - PMC - PubMed
    1. Abkowitz JL, Catlin SN, McCallie MT, Guttorp P. Evidence that the number of hematopoietic stem cells per animal is conserved in mammals. Blood. 2002;100:2665‐2667. doi:10.1182/blood-2002-03-0822 - DOI - PubMed
    1. Bernitz JM, Kim HS, MacArthur B, Sieburg H, Moore K. Hematopoietic stem cells count and remember self‐renewal divisions. Cell. 2016;167:1296, e1210‐1309. doi:10.1016/j.cell.2016.10.022 - DOI - PMC - PubMed
    1. Tajer P, Pike‐Overzet K, Arias S, Havenga M, Staal FJT. Ex vivo expansion of hematopoietic stem cells for therapeutic purposes: lessons from development and the niche. Cell. 2019;8(2):169. doi:10.3390/cells8020169 - DOI - PMC - PubMed