. 2022 Jul;48(1):122.
doi: 10.3892/or.2022.8333. Epub 2022 May 18.

Colony‑stimulating factor CSF2 mediates the phenotypic plasticity of small‑cell lung cancer by regulating the p‑STAT3/MYC pathway

Affiliations

Colony‑stimulating factor CSF2 mediates the phenotypic plasticity of small‑cell lung cancer by regulating the p‑STAT3/MYC pathway

Hui Li et al. Oncol Rep. 2022 Jul.

Abstract

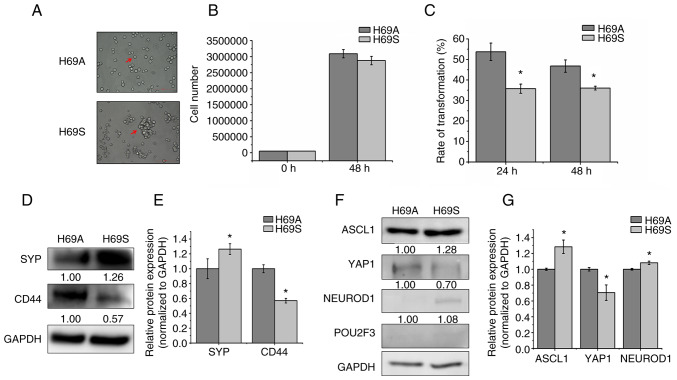
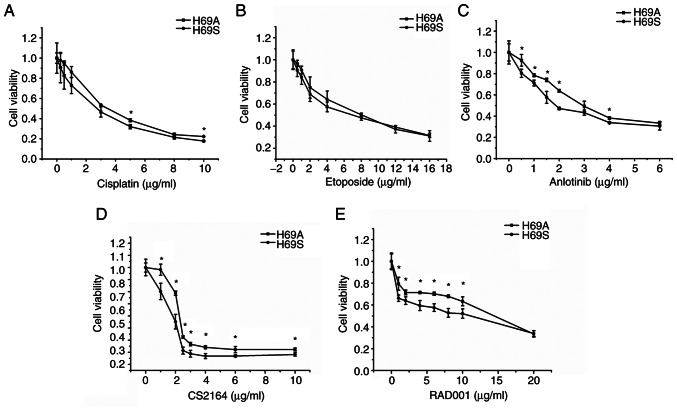
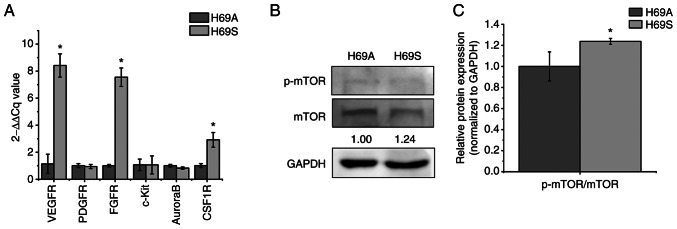
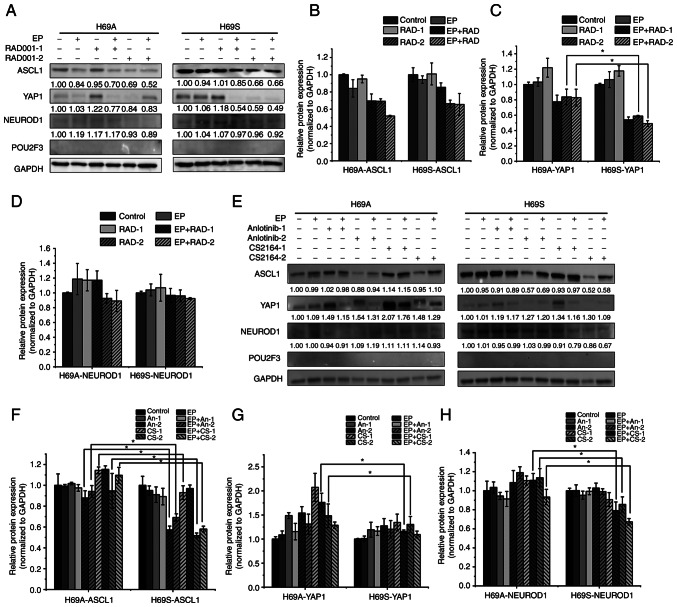
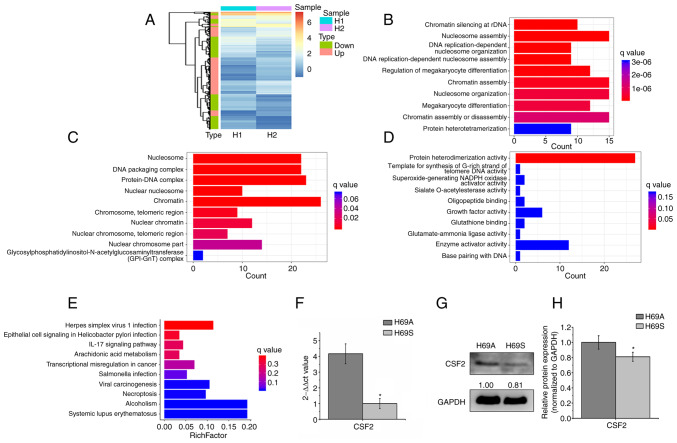
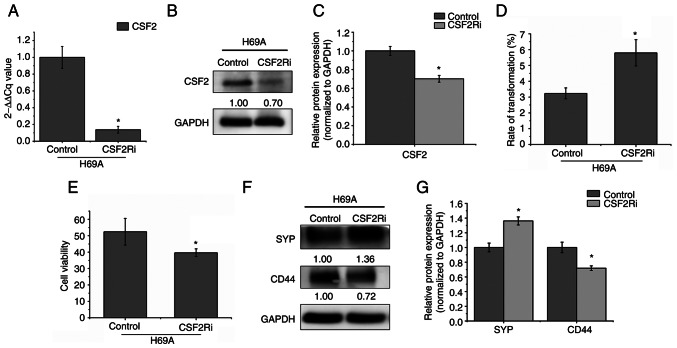
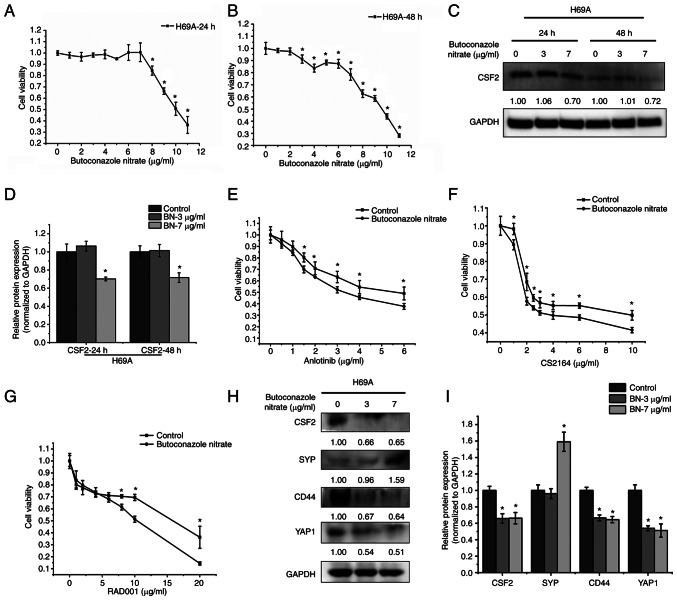
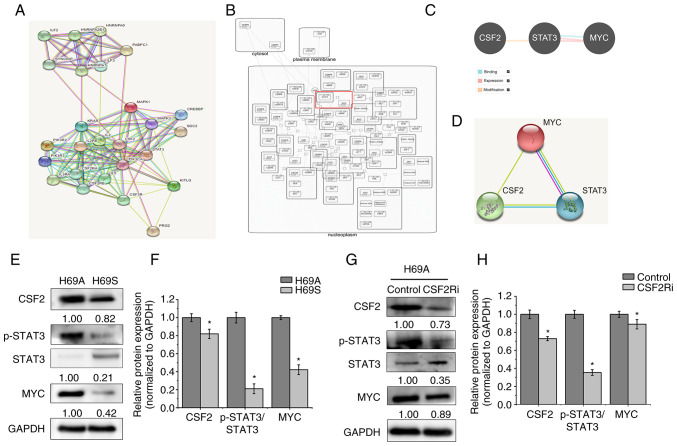
Relapse and drug resistance are the main causes of mortality in patients with small‑cell lung cancer (SCLC). Intratumoral heterogeneity (ITH) is a key biological mechanism that leads to relapse and drug resistance. Phenotypic plasticity is an important factor that leads to ITH in SCLC, although its mechanisms and key regulatory factors remain to be elucidated. In the present study, cell proliferation and cell switch assay were measured using trypan blue. Alamar Blue was used to test drug sensitivity. Differential genes were screened by RNA sequencing. Reverse transcription‑quantitative PCR and western blotting were performed to assess the expressions of CSF2/p‑STAT3/MYC pathway related molecules, neuroendocrine (NE)/non‑neuroendocrine (non‑NE), transcription factors and drug‑related targets. The present study found that SCLC cell line NCI‑H69 exhibited adherent (H69A) and suspensive (H69S) phenotypes, which could switch back and forth. The two phenotypic cells had significant differences in cellular NE and non‑NE characteristics, drug sensitivity and expression of drug‑related targets. RNA sequencing showed that granulocyte‑macrophage colony‑stimulating factor [i.e., colony‑stimulating factor 2 (CSF2)] was the main differentially expressed gene between the two phenotypes and that H69A cells highly expressed CSF2. The inhibition of CSF2 promoted the transformation from H69A to H69S, increased drug sensitivity and NE marker expression and decreased the non‑NE marker expression in H69A. The STRING, Pathway Commons and Reactome databases showed a potential regulatory relationship between CSF2 and phosphorylated signal transducer and activator of transcription 3 (p‑STAT3)/MYC. p‑STAT3 and MYC expression was higher in H69A cells than in H69S cells and CSF2 silencing inhibited their expression. Taken together, these results indicated that CSF2 may regulate the phenotypic plasticity of SCLC through the phosphorylated STAT3/MYC pathway, thereby limiting the transformation between cell clones with different phenotypes and changing the sensitivity of specific cell clones to targeted drugs. Targeting CSF2 may be a potential therapeutic strategy to overcome drug resistance in SCLC treatment by influencing ITH.

Keywords: drug resistance; granulocyte‑macrophage colony‑stimulating factor; intratumoral heterogeneity; phenotypic plasticity; small cell lung cancer.


Conflict of interest statement

The authors declare that they have no competing interests.

Figures

Figure 1.
Figure 1.
Two distinct phenotypes of SCLC cell line NCI-H69. (A) The arrows indicated the bright-field images of H69A and H69S cells. Magnification, ×200. (B) H69A and H69S cells were cultured for 48 h and then stained with trypan blue. Cell proliferation was analyzed using Countstar. (C) H69A and H69S cells were each cultured for 24 and 48 h and then stained with trypan blue. Adherent cells and suspended cells were collected. Cell numbers were counted using Countstar. (D) H69A and H69S cells were collected and western blotting was used to detect the expression of SYP and CD44. GAPDH was the internal standard. (E) Quantitative analysis of (D): H69A was the control (100%). Data are presented as the mean ± standard deviation of three independent experiments. (F) Western blotting was used to detect the expression of ASCL1, NEUROD1, POU2F3, YAP1 and GAPDH. (G) Quantitative analysis of (F): H69A was the control (100%). Data are presented as the mean ± standard deviation of three independent experiments. *P<0.05. SCLC, small cell lung cancer; SYP, synaptophysin; ASCL1, achaete-scute homologue 1; NEUROD1, neurogenic differentiation factor 1; POU2F3, POU class 2 homeobox 3; YAP1, YES-associated protein 1.
Figure 2.
Figure 2.
Different drug sensitivities in suspended cells and adherent cells. H69A cells and H69S cells were treated with different concentrations of (A) cisplatin (0, 0.25, 0.5, 1, 3, 5, 8 and 10 µg/ml), (B) etoposide (0, 0.25, 0.5, 1, 3, 5, 8, 12 and 16 µg/ml), (C) anlotinib (0, 0.5, 1, 1.5, 2, 3, 4 and 6 µg/ml), (D) CS2164 (0, 1, 2, 2.5, 3, 4, 6 and 10 µg/ml) and (E) RAD001 (0, 1, 2, 4, 6, 8, 10 and 20 µg/ml) for 48 h. Cell viability was tested using Alamar Blue reagent. All experiments were repeated three times. *P<0.05, vs. adherent group.
Figure 3.
Figure 3.
Expression of receptors targeted by anlotinib, CS2164 and RAD001 in H69S cells and H69A cells. H69A and H69S cells were collected. (A) Reverse-transcription quantitative PCR analysis of VEGFR, PDGFR, FGFR, c-Kit, Aurora B and CSF1R mRNA levels were assessed using the 2-ΔΔCq method. (B) Phosphorylated mTOR/mTOR were tested by using western blotting. GAPDH was used as the internal standard. (C) Quantitative analysis of (B): H69A was the control (100%). Data are presented as the mean ± the SD of three independent experiments. *P<0.05. VEGFR, vascular endothelial growth factor receptor; PDGFR, platelet-derived growth factor receptor; FGFR, fibroblast growth factor receptors; c-Kit, stem cell factor receptor; CSF1R, colony-stimulating factor 1 receptor; mTOR, mammalian target of rapamycin; p-, phosphorylated.
Figure 4.
Figure 4.
Alternative transcriptional genetic subtypes in H69A and H69S cells. (A) H69A and H69S cells were treated with RAD001 (1 or 8 µg/ml), cisplatin (1 µg/ml) + etoposide (2 µg/ml), or in combination for 48 h. The cells were then harvested and subjected to western blotting analysis using the indicated antibodies. (B-D) Quantitative analysis of (A): mock-treated H69A cells were used as the control. Data are presented as the mean ± the SD of three independent experiments. (E) For 48 h, H69A and H69S cells were treated with cisplatin (1 µg/ml) + etoposide (2 µg/ml), anlotinib (0.5 or 2 µg/ml), CS2164 (0.5 or 2 µg/ml), cisplatin (1 µg/ml) + etoposide (2 µg/ml) + anlotinib (0.5 or 2 µg/ml) and cisplatin (1 µg/ml) + etoposide (2 µg/ml) + CS2164 (0.5 or 2 µg/ml). Western blotting analysis was used to detect the expression of ASCL1, NEUROD1, POU2F3 and YAP1. GAPDH was used as the internal standard. (F-H) Quantitative analysis of (E): mock-treated H69A cells were used as the control (100%). Data are presented as the mean ± standard deviation of three independent experiments. *P<0.05. EP, cisplatin (1 µg/ml) + etoposide (2 µg/ml); ASCL1, achaete-scute homologue 1; NEUROD1, neurogenic differentiation factor 1; POU2F3, POU class 2 homeobox 3; YAP1, YES-associated protein 1; RAD-1, RAD001 1 µg/ml; RAD-2, RAD001 8 µg/ml; An-1, anlotinib 0.5 µg/ml; An-2, anlotinib 2 µg/ml; CS-1, CS2164 0.5 µg/ml; CS-2, CS2164 2 µg/ml.
Figure 5.
Figure 5.
CSF2 is the main difference gene between the adherent and the suspended SCLC phenotypes. H69A and H69S were detected with RNA sequencing. (A) Heat map representation of 404 differentially expressed genes. The significantly enriched GO annotations in (B) Biological Process, (C) Cellular Components and (D) Molecular Function analysis of 404 differentially expressed genes. (E) KEGG pathway analysis of 404 different genes. (F) H69A and H69S cells were collected and CSF2 mRNA levels were evaluated with reverse-transcription quantitative PCR by using the 2-ΔΔCq method. (G) CSF2 was tested by using western blotting. GAPDH was used as the internal standard (*P<0.05, vs. the adherent group). (H) Quantitative analysis of (G): H69A was used as the control (100%). Data are presented as the mean ± standard deviation of three independent experiments (*P<0.05). SCLC, small cell lung cancer; GO, Gene Ontology; KEGG, Kyoto Encyclopedia of Genes and Genomes.
Figure 6.
Figure 6.
CSF2 silencing inhibits the transformation from the adherent phenotype to the suspension phenotype. H69A was transfected with CSF2 shRNA. (A) The mRNA level of CSF2 was determined using reverse-transcription quantitative PCR. (B) CSF2 protein expression was detected by using western blotting. (C) Quantitative analysis of (B): H69A cells transfected with the control plasmid was used as the control (100%). Data are presented as the mean ± standard deviation of three independent experiments. (D) The conversion rate from the adherent phenotype to the suspended phenotype was detected by using trypan blue staining. (E) Cell viability was detected by using Alamar Blue. (F) The levels of SYP, CD44 and GAPDH were detected by using western blotting (*P<0.05, vs. the control group). (G) Quantitative analysis of (F): H69A cells transfected with the control plasmid were used as the control (100%). Data are presented as mean ± standard deviation of three independent experiments (*P<0.05). CSF2, colony-stimulating factor 2; sh, short hairpin; SYP, synaptophysin.
Figure 7.
Figure 7.
The effect of CSF2 inhibitors on drug sensitivity and the conversion of the non-NE phenotype to the NE phenotype. H69A cells were treated with different concentrations of butoconazole nitrate (0, 1, 2, 3, 4, 5, 6, 7, 8, 9, 10 and 11 µg/ml) and cell viability was detected with Alamar Blue after treatment for (A) 24 h and (B) 48 h. (C) H69A cells treated with 3 and 7 µg/ml butoconazole nitrate. The cells were collected after treatment for 24 and 48 h. The expression of CSF2 and GAPDH were analyzed by using western blotting. (D) Quantitative analysis of (C), mock-treated H69A cells were used as the control (100%). Data are presented as the mean ± standard deviation of three independent experiments. (E) H69A cells were treated with butoconazole nitrate (7 µg/ml) combined with anlotinib (0, 0.5, 1, 1.5, 2, 3, 4 and 6 µg/ml), (F) CS2164 (0, 1, 2, 2.5, 3, 4, 6 and 10 µg/ml) and (G) RAD001 (0, 1, 2, 4, 6, 8, 10 and 20 µg/ml) for 24 h. Cell viability was tested by using Alamar Blue. (H) H69A cells were treated with butoconazole nitrate (3 and 7 µg/ml) for 24 h. Western blotting was used to detect the expression of CSF2, SYP, CD44, YAP1 and GAPDH. (I) Quantitative analysis of (H), mock-treated H69A cells were used as the control (100%). Data are presented as the mean ± standard deviation of three independent experiments. *P<0.05. CSF2, colony-stimulating factor 2; NE, neuroendocrine; CSF2, colony-stimulating factor 2; SYP, synaptophysin; YAP1, YES-associated protein 1.
Figure 8.
Figure 8.
CSF2 regulated phenotypic transformation through p-STAT3/MYC. (A) The STRING database was used to search for proteins that interact with CSF2. Known interactions are indicated with edges of pink (i.e., experimentally determined) and deep sky blue (i.e., database obtained). Predicted interactions are indicated with edges of green (i.e., gene neighborhood), blue (i.e., gene co-occurrence) and red (i.e., gene fusions). Edges of yellow indicate text-mining. Edges of black indicate co-expression. Edges of light purple indicate protein homology. (B) The Reactome database was used to analyze the regulatory relationship between MYC and STAT3. (C) The Pathway Commons database was used to analyze the relationship between CSF2, STAT3 and MYC. The relationship of binding (deep sky blue), expression (pink) and modification (orange) are shown. (D) The STRING database was used to analyze the regulatory relationship between CSF2, STAT3 and MYC. (E) The levels of CSF2, p-STAT3 and MYC in H69A and H69S cells were tested with western blotting. (F) Quantitative analysis of (E): H69A was the control (100%). Data are presented as the mean ± standard deviation of three independent experiments. (G) H69A was transfected with CSF2 shRNA and the expressions of CSF2, p-STAT3, STAT3 and MYC were detected by using western blotting. (H) Quantitative analysis of (G): H69A cells transfected with control plasmid were used as the control (100%). Data are presented as the mean ± standard deviation of three independent experiments. *P<0.05. p-STAT3, phosphorylated signal transducer and activator of transcription 3; CSF2, colony-stimulating factor 2.

Similar articles

Cited by

References

    1. Oronsky B, Reid TR, Oronsky A, Carter CA. What's new in sclc? A review. Neoplasia. 2017;19:842–847. doi: 10.1016/j.neo.2017.07.007. - DOI - PMC - PubMed
    1. Jahchan NS, Lim JS, Bola B, Morris K, Seitz G, Tran KQ, Xu L, Trapani F, Morrow CJ, Cristea S, et al. Identification and targeting of long-term tumor-propagating cells in small cell lung cancer. Cell Rep. 2016;16:644–656. doi: 10.1016/j.celrep.2016.06.021. - DOI - PMC - PubMed
    1. Nicholson AG, Chansky K, Crowley J, Beyruti R, Kubota K, Turrisi A, Eberhardt WE, van Meerbeeck J, Rami-Porta R; Staging, Prognostic Factors Committee, et al. The international association for the study of lung cancer lung cancer staging project: Proposals for the revision of the clinical and pathologic staging of small cell lung cancer in the forthcoming eighth edition of the tnm classification for lung cancer. J Thorac Oncol. 2016;11:300–311. doi: 10.1016/j.jtho.2015.10.008. - DOI - PubMed
    1. Song Y, Sun Y, Lei Y, Yang K, Tang R. YAP1 promotes multidrug resistance of small cell lung cancer by CD74-related signaling pathways. Cancer Med. 2020;9:259–268. doi: 10.1002/cam4.2668. - DOI - PMC - PubMed
    1. Prabavathy D, Ramadoss N. Heterogeneity of small cell lung cancer stem cells. Adv Exp Med Biol. 2019;1139:41–57. doi: 10.1007/978-3-030-14366-4_3. - DOI - PubMed

MeSH terms

Substances