. 2022 Jul;61(1):82.
doi: 10.3892/ijo.2022.5372. Epub 2022 May 18.

MDIG, a 2‑oxoglutarate‑dependent oxygenase, acts as an oncogene and predicts the prognosis of multiple types of cancer

Affiliations

MDIG, a 2‑oxoglutarate‑dependent oxygenase, acts as an oncogene and predicts the prognosis of multiple types of cancer

Feng Geng et al. Int J Oncol. 2022 Jul.

Abstract

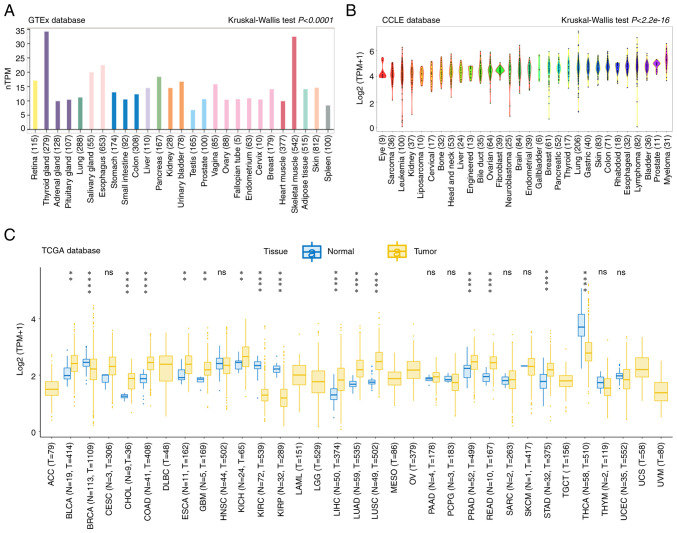
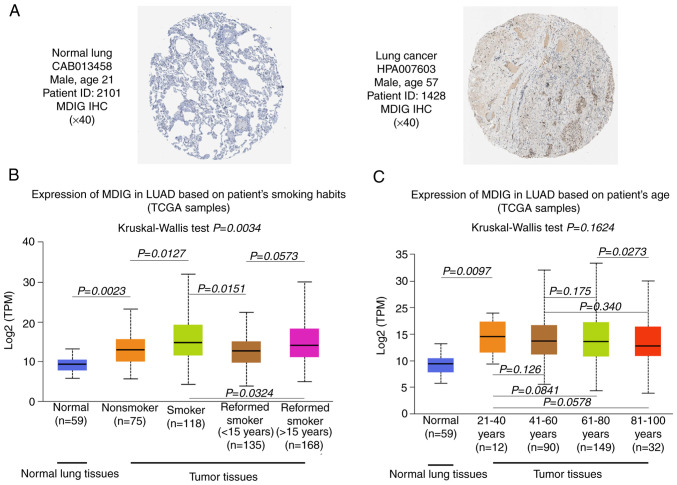
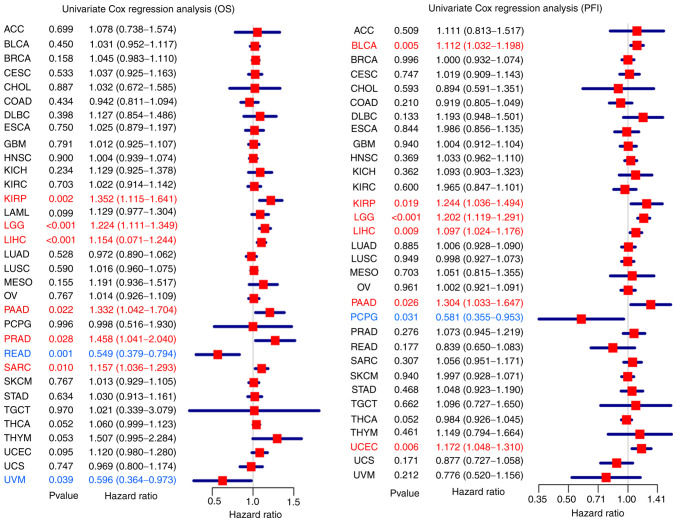
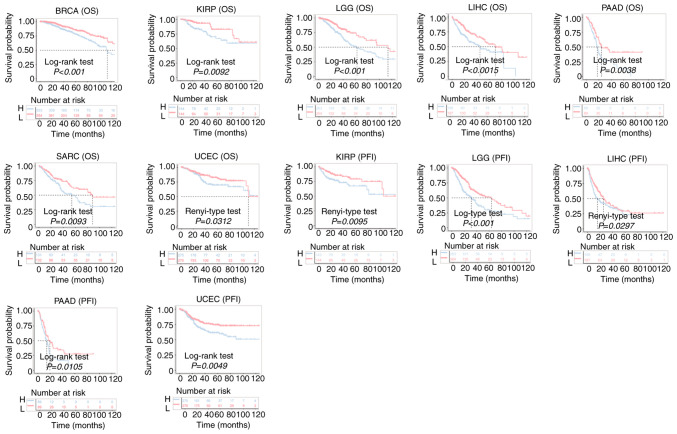
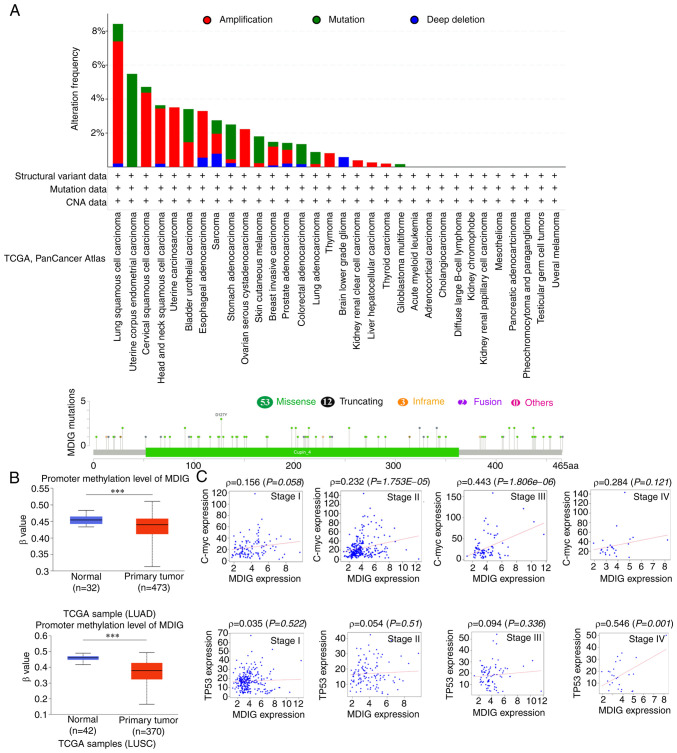
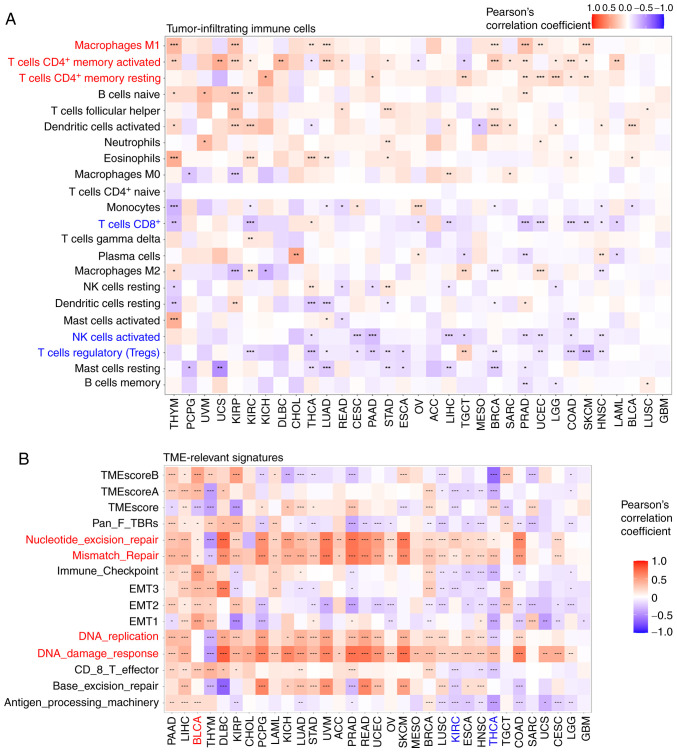
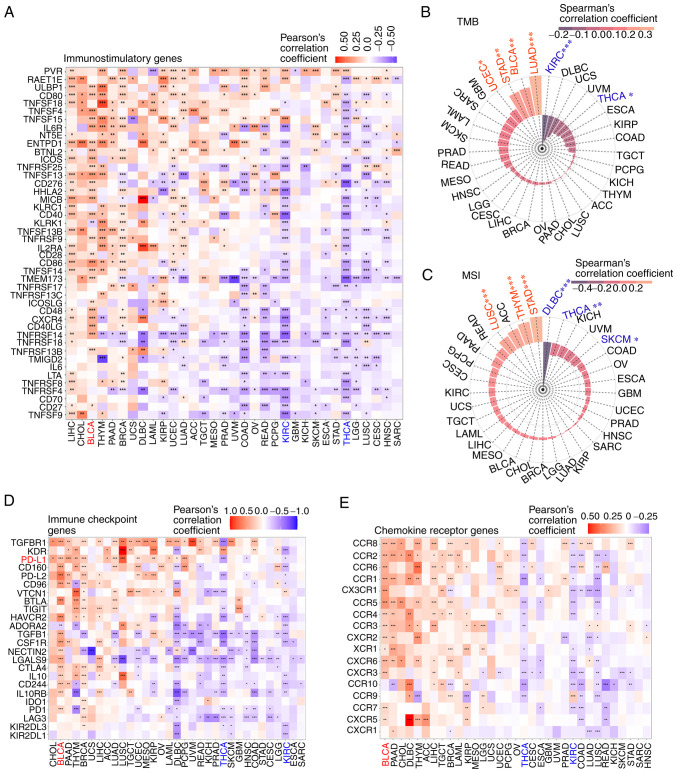
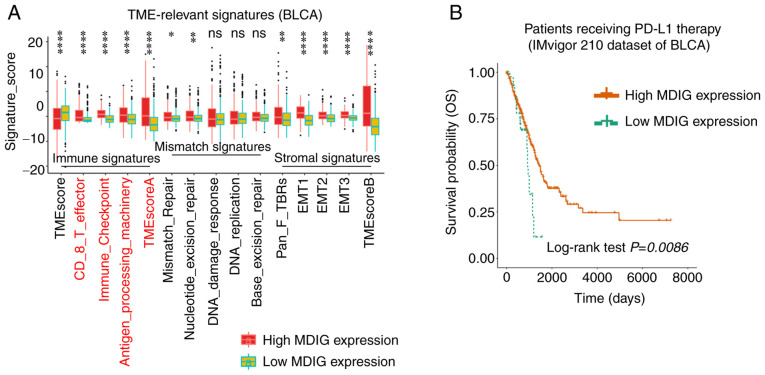
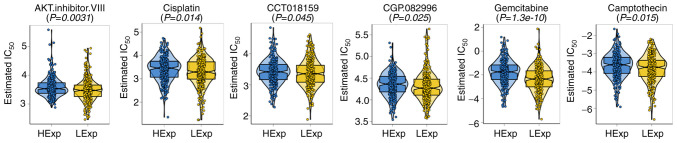
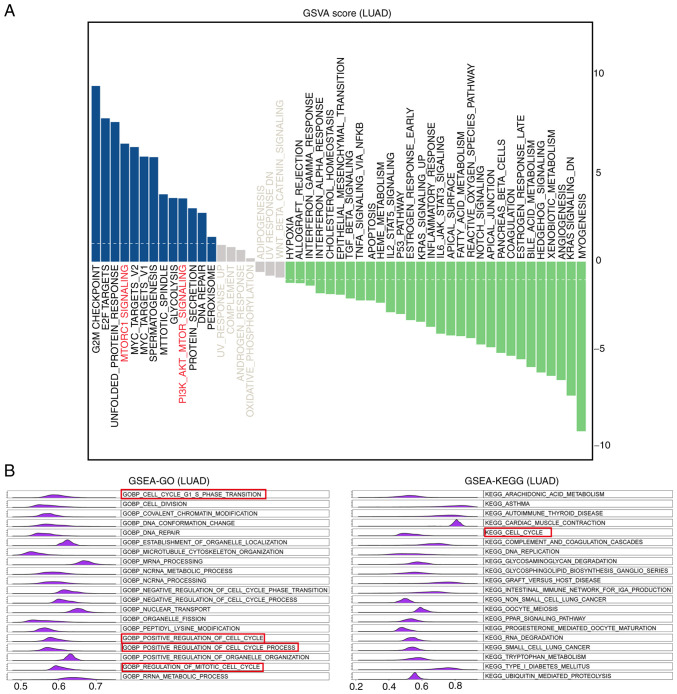
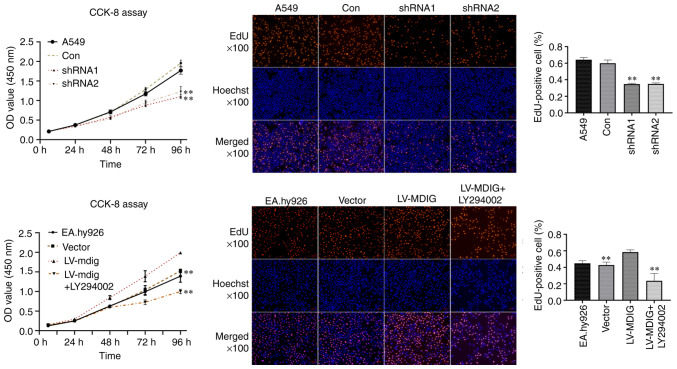
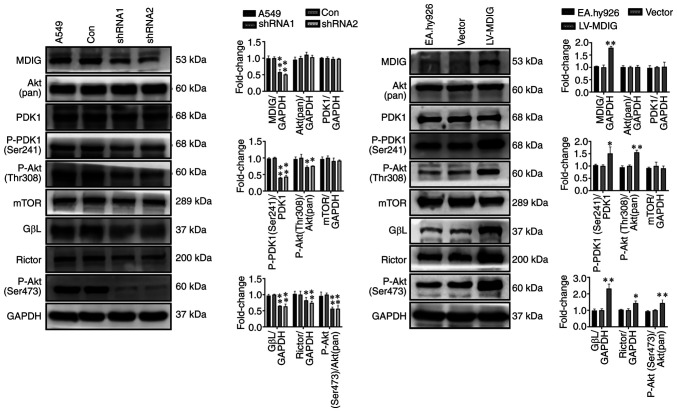
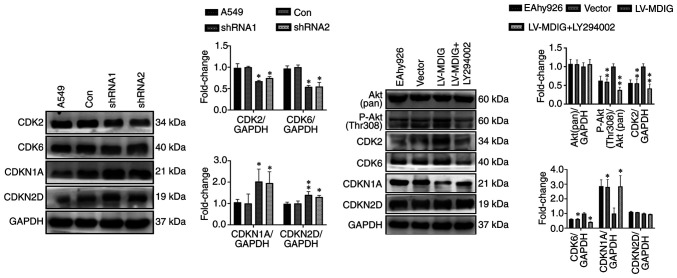
Recent studies have indicated that mineral dust‑induced gene (MDIG) is an oncogene induced by environmental factors, which has a key role in the development and progression of various tumor types, through epigenetic modifications; however, there are no previous pan‑cancer analyses of MDIG. In the present study, a comprehensive pan‑cancer analysis of MDIG was performed using public databases. The results demonstrated that MDIG was upregulated in tumor tissue samples compared with normal tissue, that it was present in all cancer cell lines and it was closely associated with the prognosis of patients with different tumor types. Furthermore, MDIG expression was closely associated with the immunological characteristics of the tumor microenvironment (TME), such as the frequency of tumor‑infiltrating immune cells, TME‑relevant signatures, immunostimulatory genes, immune checkpoint genes, chemokine receptor genes, tumor mutational burden and microsatellite instability. In parallel, high expression of MDIG was associated with improved overall survival of patients and this was verified in a cohort of patients who had received anti‑programmed cell death 1 ligand 1 treatment. Furthermore, high expression of MDIG led to multiple drug resistance in The Cancer Genome Atlas‑lung adenocarcinoma cohort. In addition, gene set variant analysis and gene set enrichment analysis indicated that MDIG was involved in cell cycle regulation. In vitro experiments suggested that MDIG promoted cell proliferation through the mTOR complex 2/Akt and pyruvate dehydrogenase kinase 1/Akt signaling pathways. In summary, the present study suggests that MDIG may be a prognostic biomarker and therapeutic target for various cancer types.

Keywords: AKT signaling; cell proliferation; mineral dust‑induced gene; pan‑cancer; prognostic and therapeutic biomarker.


Conflict of interest statement

The authors declare that they have no competing interests.

Figures

Figure 1
Figure 1
MDIG expression in various types of cancer. (A) Different expression levels of MDIG among 27 normal tissue types in a GTEx dataset determined using Kruskal-Wallis tests. (B) Different expression levels of MDIG among cancer cell lines representing 30 types of cancer in a CCLE dataset according to Kruskal-Wallis tests. (C) Expression levels of MDIG in a dataset from TCGA comprising 33 tumor tissue types and paired adjacent noncancerous tissue (Wilcoxon rank-sum test). Data in the box plot are presented as the median and 25-75th percentile, and the vertical bars indicate the standard deviation and the dots outliers. **P<0.01, ****P<0.0001. ns, no significance; N, normal; T, tumor; MDIG, mineral dust-induced gene; TPM, transcripts per million mapped reads; GTEx, Genotype-Tissue Expression; CCLE, Cancer Cell Line Encyclopedia; TCGA, The Cancer Genome Atlas; ACC, adrenocortical carcinoma; BLCA, bladder urothelial carcinoma; BRCA, breast invasive carcinoma; CESC, cervical squamous cell carcinoma; CHOL, cholangiocarcinoma; COAD, colon adenocarcinoma; DLBC, diffuse large B cell lymphoma; ESCA, esophageal carcinoma; GBM, glioblastoma; HNSC, head and neck squamous cell carcinoma; KICH, kidney chromophobe; KIRC, kidney renal clear cell carcinoma; KIRP, kidney renal papillary cell carcinoma; LAML, acute myeloid leukemia; LGG, brain lower grade glioma; LIHC, liver hepatocellular carcinoma; LUAD, lung adenocarcinoma; LUSC, lung squamous cell carcinoma; MESO, mesothelioma; OV, ovarian serous cystadenocarcinoma; PAAD, pancreatic adenocarcinoma; PCPG, pheochromocytoma and paraganglioma; PRAD, prostate adenocarcinoma; READ, rectum adenocarcinoma; SARC, sarcoma; SKCM, skin cutaneous melanoma; STAD, stomach adenocarcinoma; TGCT, testicular germ cell tumors; THCA, thyroid carcinoma; THYM, thymoma; UCEC, uterine corpus endometrial carcinoma; UCS, uterine carcinosarcoma; UVM, uveal melanoma.
Figure 2
Figure 2
MDIG expression in lung cancer. (A) MDIG expression in normal lung and lung cancer tissue samples from the Human Protein Atlas (magnification, ×40). (B) MDIG expression in patients with LUAD from TCGA data stratified according to their smoking history (Kruskal-Wallis tests followed by Dunn's tests). (C) MDIG expression in patients with LUAD from TCGA data stratified according to their age (Kruskal-Wallis tests followed by Dunn's tests). MDIG, mineral dust-induced gene; LUAD, lung adenocarcinoma; TCGA, The Cancer Genome Atlas; IHC, immunohistochemistry; TPM, transcripts per million mapped reads.
Figure 3
Figure 3
Relationship between high expression of MDIG and patient OS (left panel) and PFI (right panel). The forest plots were generated using univariate survival analysis in various cancer types. HR>1 indicates that MDIG high expression represents a risk factor, whereas HR<1 suggests that it is a protective factor. MDIG, mineral dust-induced gene; HR, hazard ratio; OS, overall survival; PFI, progression-free interval; ACC, adrenocortical carcinoma; BLCA, bladder urothelial carcinoma; BRCA, breast invasive carcinoma; CESC, cervical squamous cell carcinoma; CHOL, cholangiocarcinoma; COAD, colon adenocarcinoma; DLBC, diffuse large B cell lymphoma; ESCA, esophageal carcinoma; GBM, glioblastoma; HNSC, head and neck squamous cell carcinoma; KICH, kidney chromophobe; KIRC, kidney renal clear cell carcinoma; KIRP, kidney renal papillary cell carcinoma; LAML, acute myeloid leukemia; LGG, brain lower grade glioma; LIHC, liver hepatocellular carcinoma; LUAD, lung adenocarcinoma; LUSC, lung squamous cell carcinoma; MESO, mesothelioma; OV, ovarian serous cystadenocarcinoma; PAAD, pancreatic adenocarcinoma; PCPG, pheochromocytoma and paraganglioma; PRAD, prostate adenocarcinoma; READ, rectum adenocarcinoma; SARC, sarcoma; SKCM, skin cutaneous melanoma; STAD, stomach adenocarcinoma; TGCT, testicular germ cell tumors; THCA, thyroid carcinoma; THYM, thymoma; UCEC, uterine corpus endometrial carcinoma; UCS, uterine carcinosarcoma; UVM, uveal melanoma.
Figure 4
Figure 4
Kaplan-Meier curves for OS and PFI of patients from TCGA datasets stratified according to MDIG gene expression. MDIG, mineral dust-induced gene; OS, overall survival; PFI, progression-free interval; H, high expression; L, low expression; BRCA, breast invasive carcinoma; KIRP, kidney renal papillary cell carcinoma; LGG, brain lower grade glioma; LIHC, liver hepatocellular carcinoma; PAAD, pancreatic adenocarcinoma; SARC, sarcoma; UCEC, uterine corpus endometrial carcinoma.
Figure 5
Figure 5
MDIG mutations and promoter methylation status in various cancer types and association of MDIG with C-Myc and TP53 expression in NSCLC. (A) Alteration frequency and mutation count in the MDIG gene in TCGA datasets obtained through the cBioPortal database. (B) MDIG promoter methylation status in NSCLC datasets obtained from the UALCAN database. (C) Relationship between MDIG expression and C-Myc and TP53 in TCGA datasets. ***P<0.001. MDIG, mineral dust-induced gene; NSCLC, non-small cell lung cancer; TCGA, The Cancer Genome Atlas; LUAD, lung adenocarcinoma; LUSC, lung squamous carcinoma; ρ, Spearman's correlation coefficient; TP53, tumor protein 53; CNA, copy number alteration.
Figure 6
Figure 6
Correlation analysis between MDIG expression and the frequency of tumor-infiltrating immune cells and TME-relevant signatures in various cancer types. (A) Correlation analysis between MDIG expression and the frequency of tumor-infiltrating immune cells. (B) Correlation analysis between MDIG expression and TME-relevant signatures obtained through the CIBERSORT web portal. *P<0.05, **P<0.01, ***P<0.001. MDIG, mineral dust-induced gene; TME, tumor microenvironment; CIBERSORT, Cell type Identification by Estimating Relative Subsets of RNA Transcripts; EMT, epithelial-to-mesenchymal transition; Pan-F-TBR, pan tissue fibroblast TGF-β response signature; NK, natureal killer; ACC, adrenocortical carcinoma; BLCA, bladder urothelial carcinoma; BRCA, breast invasive carcinoma; CESC, cervical squamous cell carcinoma; CHOL, cholangiocarcinoma; COAD, colon adenocarcinoma; DLBC, diffuse large B cell lymphoma; ESCA, esophageal carcinoma; GBM, glioblastoma; HNSC, head and neck squamous cell carcinoma; KICH, kidney chromophobe; KIRC, kidney renal clear cell carcinoma; KIRP, kidney renal papillary cell carcinoma; LAML, acute myeloid leukemia; LGG, brain lower grade glioma; LIHC, liver hepatocellular carcinoma; LUAD, lung adenocarcinoma; LUSC, lung squamous cell carcinoma; MESO, mesothelioma; OV, ovarian serous cystadenocarcinoma; PAAD, pancreatic adenocarcinoma; PCPG, pheochromocytoma and paraganglioma; PRAD, prostate adenocarcinoma; READ, rectum adenocarcinoma; SARC, sarcoma; SKCM, skin cutaneous melanoma; STAD, stomach adenocarcinoma; TGCT, testicular germ cell tumors; THCA, thyroid carcinoma; THYM, thymoma; UCEC, uterine corpus endometrial carcinoma; UCS, uterine carcinosarcoma; UVM, uveal melanoma.
Figure 7
Figure 7
Analysis of the correlation of MDIG with immune-relevant genes, TMB and MSI. (A) Correlation analysis between MDIG expression and immunostimulatory genes. (B) Correlation between MDIG expression and TMB. (C) Correlation between MDIG expression and MSI. (D) Correlation analysis between MDIG expression and immune checkpoint genes. (E) Correlation analysis between MDIG expression and chemokine receptor genes. *P<0.05, **P<0.01, ***P<0.001. MDIG, mineral dust-induced gene; TMB, tumor mutational burden; MSI, microsatellite instability; ACC, adrenocortical carcinoma; BLCA, bladder urothelial carcinoma; BRCA, breast invasive carcinoma; CESC, cervical squamous cell carcinoma; CHOL, cholangiocarcinoma; COAD, colon adenocarcinoma; DLBC, diffuse large B cell lymphoma; ESCA, esophageal carcinoma; GBM, glioblastoma; HNSC, head and neck squamous cell carcinoma; KICH, kidney chromophobe; KIRC, kidney renal clear cell carcinoma; KIRP, kidney renal papillary cell carcinoma; LAML, acute myeloid leukemia; LGG, brain lower grade glioma; LIHC, liver hepatocellular carcinoma; LUAD, lung adenocarcinoma; LUSC, lung squamous cell carcinoma; MESO, mesothelioma; OV, ovarian serous cystadenocarcinoma; PAAD, pancreatic adenocarcinoma; PCPG, pheochromocytoma and paraganglioma; PRAD, prostate adenocarcinoma; READ, rectum adenocarcinoma; SARC, sarcoma; SKCM, skin cutaneous melanoma; STAD, stomach adenocarcinoma; TGCT, testicular germ cell tumors; THCA, thyroid carcinoma; THYM, thymoma; UCEC, uterine corpus endometrial carcinoma; UCS, uterine carcinosarcoma; UVM, uveal melanoma.
Figure 8
Figure 8
Association of MDIG with TME-relevant signatures and immune checkpoint blockade therapy in BLCA. (A) Correlation analysis between MDIG expression and TME-relevant signatures in BLCA obtained through the CIBERSORT web portal (Wilcoxon rank-sum test). (B) Kaplan-Meier curve analysis of OS in patients who had received anti-PD-L1 immunotherapy, stratified according to MDIG expression. *P<0.05, **P<0.01, ****P<0.0001. BLCA, bladder urothelial carcinoma; TME, tumor microenvironment; EMT, epithelial-to-mesenchymal transition; Pan-F-TBR, pan tissue fibroblast TGF-β response signature; OS, overall survival; CIBERSORT, Cell type Identification by Estimating Relative Subsets of RNA Transcripts; PD-L1, programmed cell death 1 ligand 1.
Figure 9
Figure 9
Relationship between MDIG expression and drug sensitivity in TCGA-LUAD cohort (Wilcoxon rank-sum test). The boxes in the violin plots indicate the pan-cancer samples (n=535) from the LUAD-TCGA cohort and were presented as the median and 25-75th percentile. MDIG, mineral dust-induced gene; HExp, high MDIG expression; LExp, low MDIG expression; LUAD, lung adenocarcinoma; TCGA, The Cancer Genome Atlas.
Figure 10
Figure 10
GSVA and GSEA in LUAD. (A) Functional enrichment analysis using GSVA. The y-axis indicates the t-value of the GSVA score. (B) The top 20 GSEA results for GOBP terms and KEGG pathways in LUAD are presented. The x-axis indicates the enrichment score. GSVA, gene set variation analysis; GSEA, gene set enrichment analysis; GOBP, Gene Ontology Biological Process; KEGG, Kyoto Encyclopedia of Genes and Genomes; LUAD, lung adenocarcinoma.
Figure 11
Figure 11
Effect of MDIG on A549 and EA.hy926 cell proliferation. CCK-8 and EdU assays were performed using A549 cells transfected with MDIG-targeting shRNA1 and shRNA2 (top). CCK-8 and EdU assays were carried out in EA.hy926 cells transfected with LV-MDIG and treated with LY294002 (bottom) (magnification, ×100). **P<0.01 vs. Con or LV-MDIG group, one-way ANOVA followed by Tukey's post-hoc test. MDIG, mineral dust-induced gene; Con, control; LV, lentiviral vector; shRNA, short hairpin RNA; CCK-8, Cell Counting Kit-8; OD, optical density.
Figure 12
Figure 12
Regulation of the mTORC2/Akt and PDK1/Akt signaling pathway by MDIG. Western blot analysis was used to examine the mTORC2/Akt and PDK1/Akt signaling pathways. GAPDH was used as the loading control. Phosphoproteins were presented as the ratio of phosphoprotein to total protein. *P<0.05, **P<0.01 vs. Con or Vector group (one-way ANOVA followed by Tukey's post-hoc test). MDIG, mineral dust-induced gene; Con, control; LV, lentiviral vector; shRNA, short hairpin RNA; P, phosphorylated; PDK1, pyruvate dehydrogenase kinase 1; mTORC2, mTOR complex 2.
Figure 13
Figure 13
Regulation of the expression of cell cycle-associated proteins by MDIG. Western blot analysis was used to determine the expression levels of cell cycle-associated proteins. GAPDH was used as the loading control. Phosphoprotein was presented as the ratio of phosphoprotein to total protein. *P<0.05, **P<0.01 vs. Con or LV-MDIG group (one-way ANOVA followed by Tukey's post-hoc test). MDIG, mineral dust-induced gene; Con, control; LV, lentiviral vector; shRNA, short hairpin RNA; P, phosphorylated; CDK, cyclin-dependent kinase; CDKN1A, CDK inhibitor 1A.

Similar articles

Cited by

  • Epigenetics of Thymic Epithelial Tumors.
    Nicolì V, Coppedè F. Nicolì V, et al. Cancers (Basel). 2023 Jan 5;15(2):360. doi: 10.3390/cancers15020360. Cancers (Basel). 2023. PMID: 36672310 Free PMC article. Review.

References

    1. Sung H, Ferlay J, Siegel RL, Laversanne M, Soerjomataram I, Jemal A, Bray F. Global cancer statistics 2020: GLOBOCAN estimates of incidence and mortality worldwide for 36 Cancers in 185 Countries. CA Cancer J Clin. 2021;71:209–249. doi: 10.3322/caac.21660. - DOI - PubMed
    1. Wu K, Li L, Thakur C, Lu Y, Zhang X, Yi Z, Chen F. Proteomic characterization of the world trade center dust-activated mdig and c-myc signaling circuit linked to multiple myeloma. Sci Rep. 2016;6:36305. doi: 10.1038/srep36305. - DOI - PMC - PubMed
    1. Zhang Y, Lu Y, Yuan BZ, Castranova V, Shi X, Stauffer JL, Demers LM, Chen F. The Human mineral dust-induced gene, mdig, is a cell growth regulating gene associated with lung cancer. Oncogene. 2005;24:4873–4882. doi: 10.1038/sj.onc.1208668. - DOI - PubMed
    1. Sun J, Yu M, Lu Y, Thakur C, Chen B, Qiu P, Zhao H, Chen F. Carcinogenic metalloid arsenic induces expression of mdig oncogene through JNK and STAT3 activation. Cancer Lett. 2014;346:257–263. doi: 10.1016/j.canlet.2014.01.002. - DOI - PMC - PubMed
    1. Thakur C, Wolfarth M, Sun J, Zhang Y, Lu Y, Battelli L, Porter DW, Chen F. Oncoprotein mdig contributes to silica-induced pulmonary fibrosis by altering balance between Th17 and Treg T cells. Oncotarget. 2015;6:3722–3736. doi: 10.18632/oncotarget.2914. - DOI - PMC - PubMed