. 2022 Jul 4;19(7):2549-2563.
doi: 10.1021/acs.molpharmaceut.2c00260. Epub 2022 May 18.

Photoimmunotherapy Retains Its Anti-Tumor Efficacy with Increasing Stromal Content in Heterotypic Pancreatic Cancer Spheroids

Affiliations

Photoimmunotherapy Retains Its Anti-Tumor Efficacy with Increasing Stromal Content in Heterotypic Pancreatic Cancer Spheroids

Mohammad A Saad et al. Mol Pharm. .

Abstract

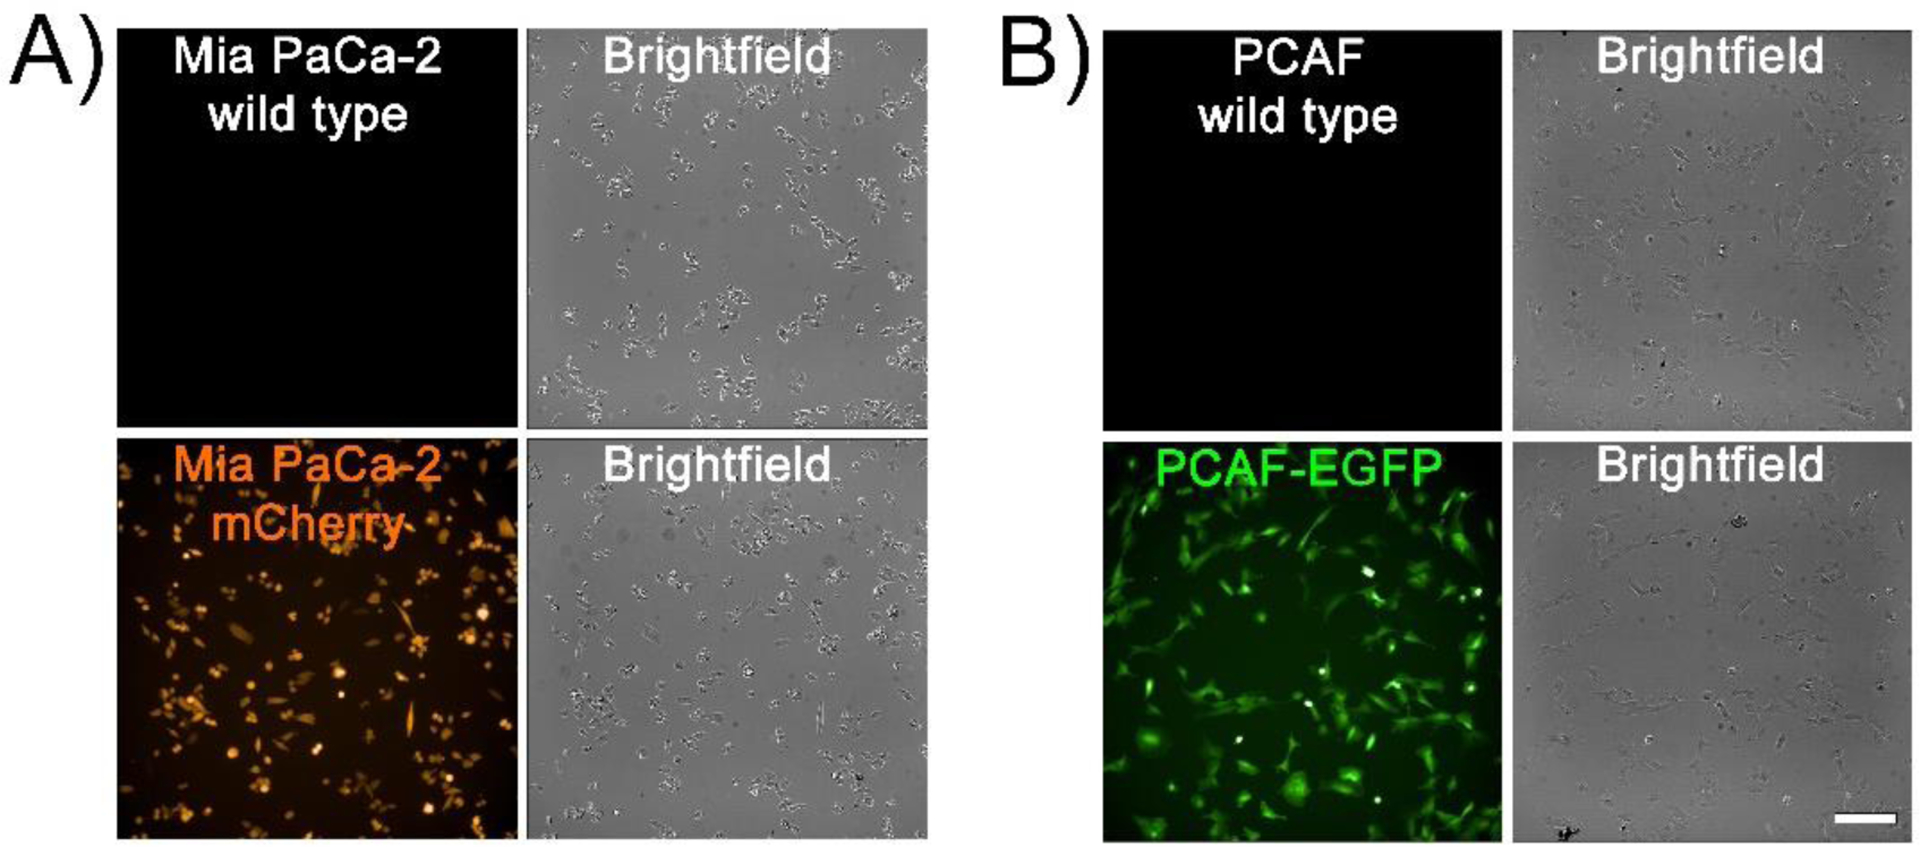
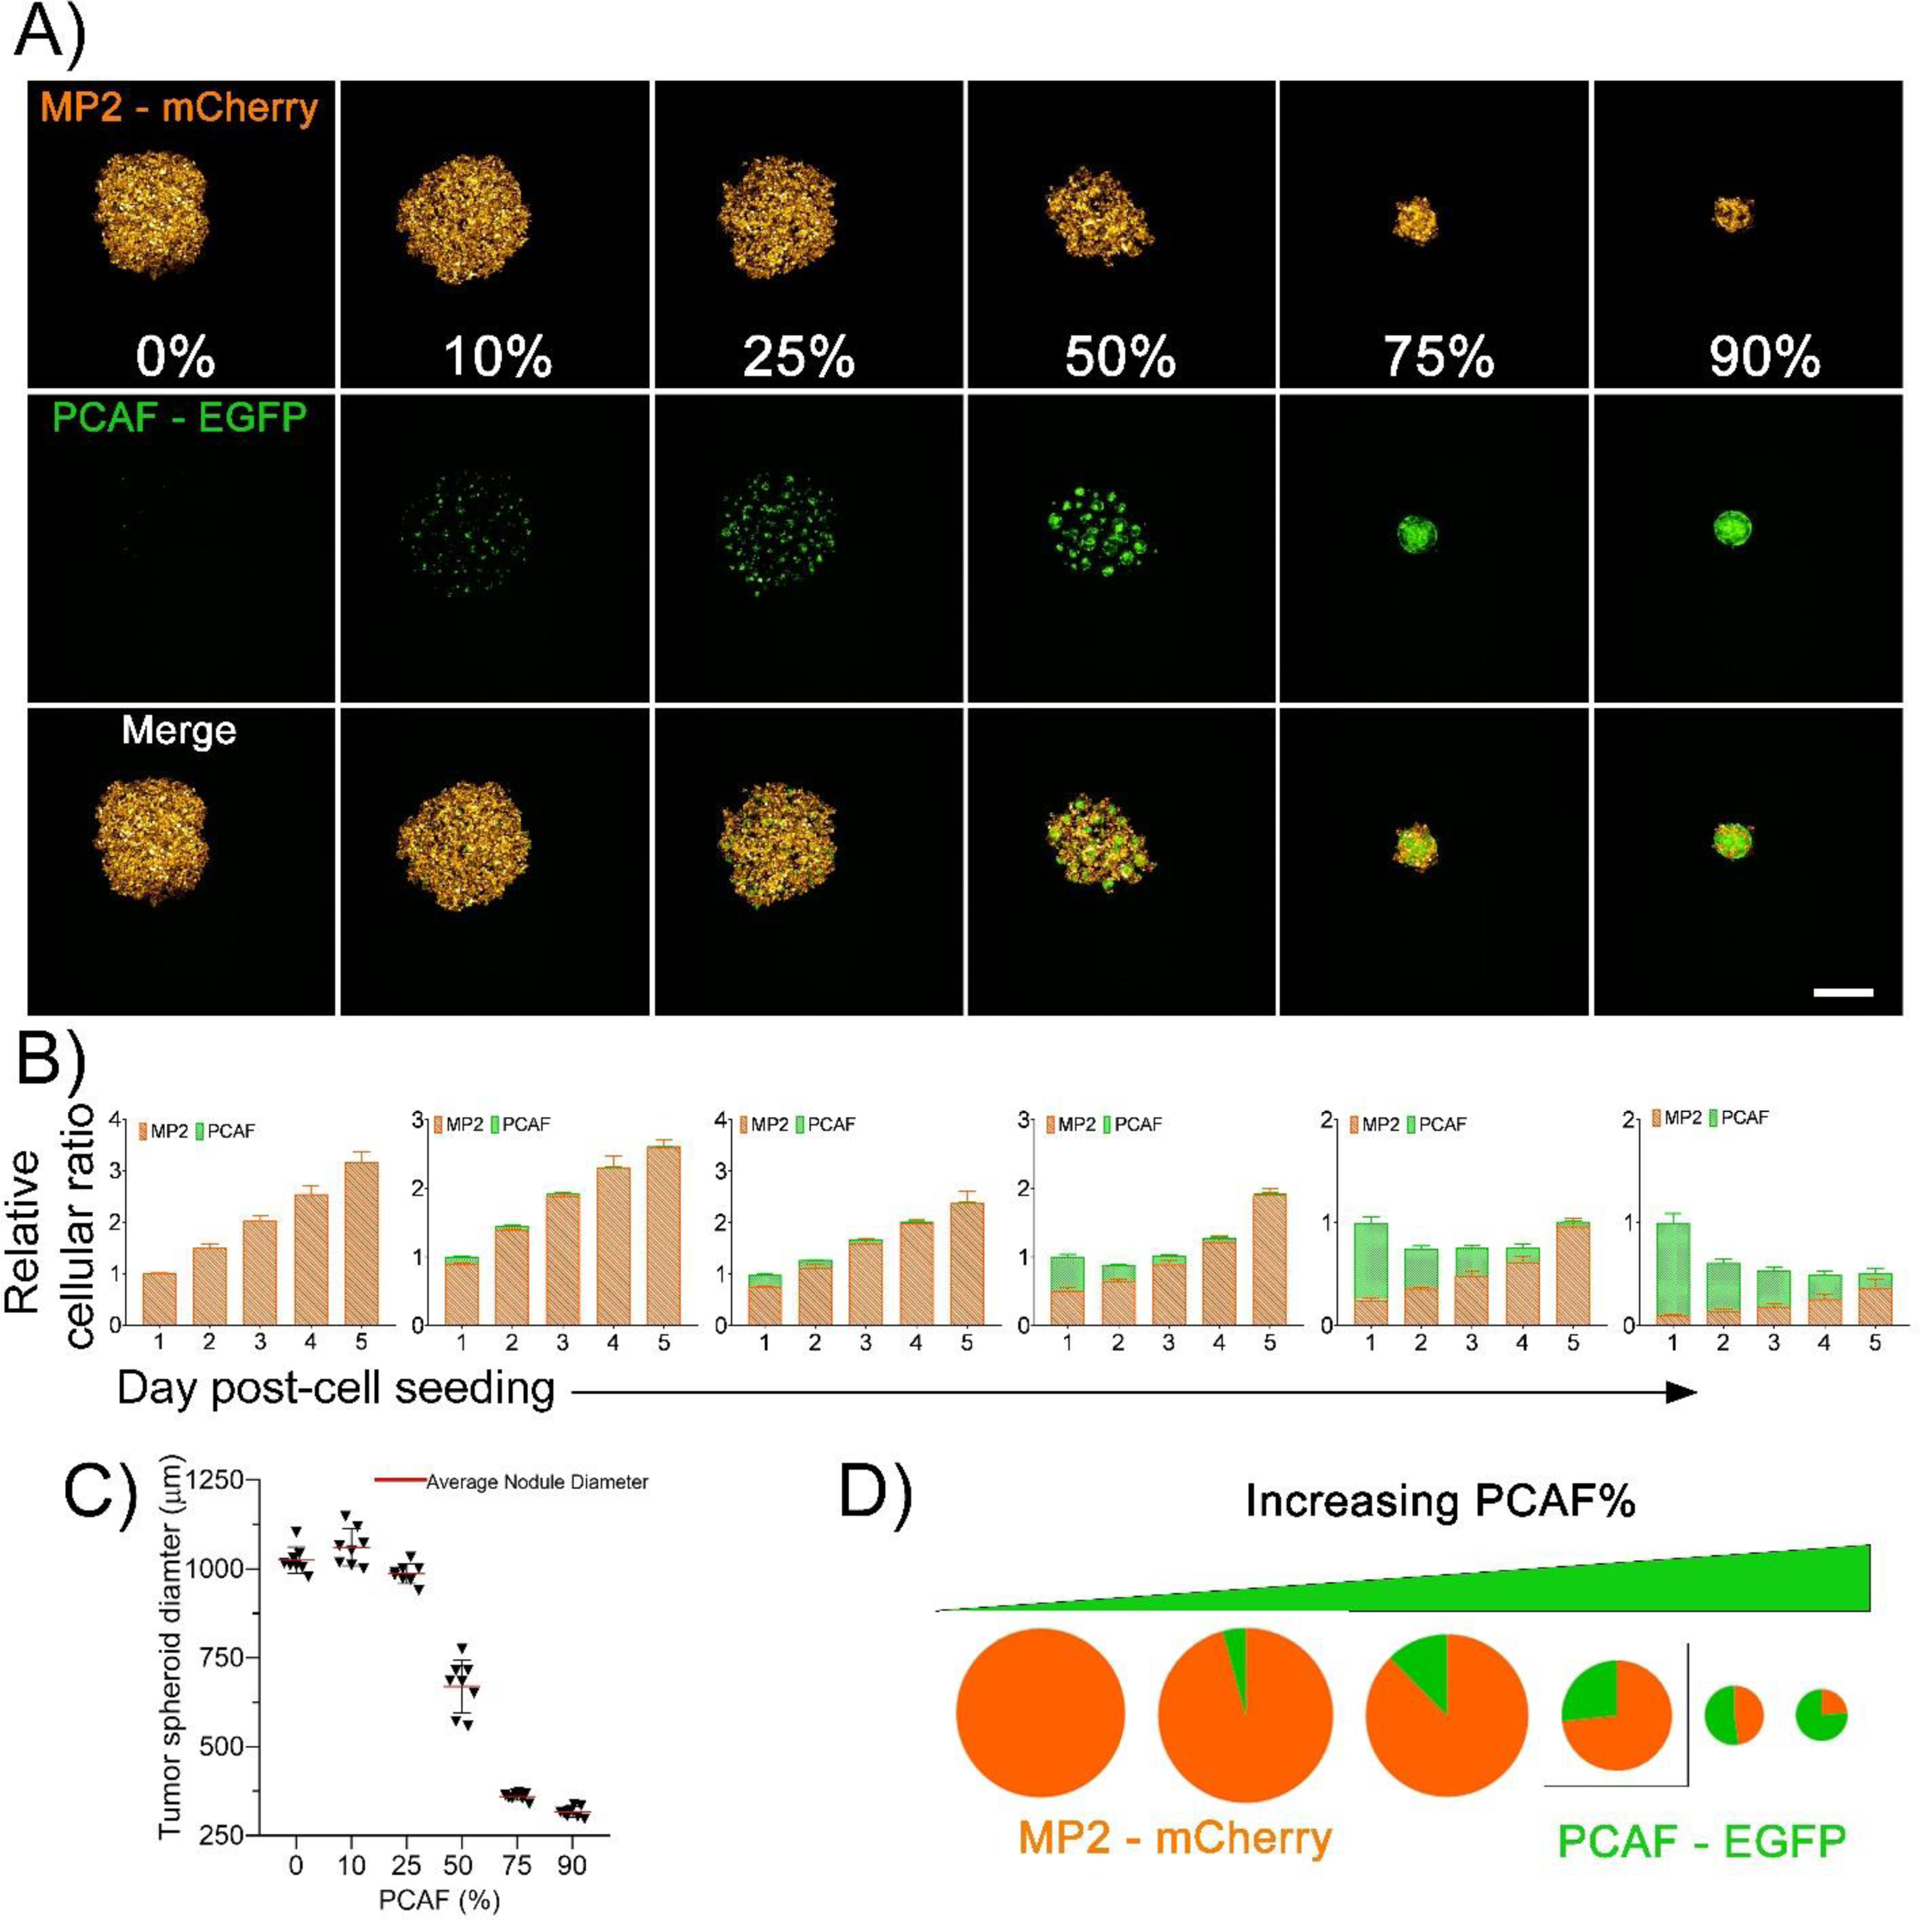
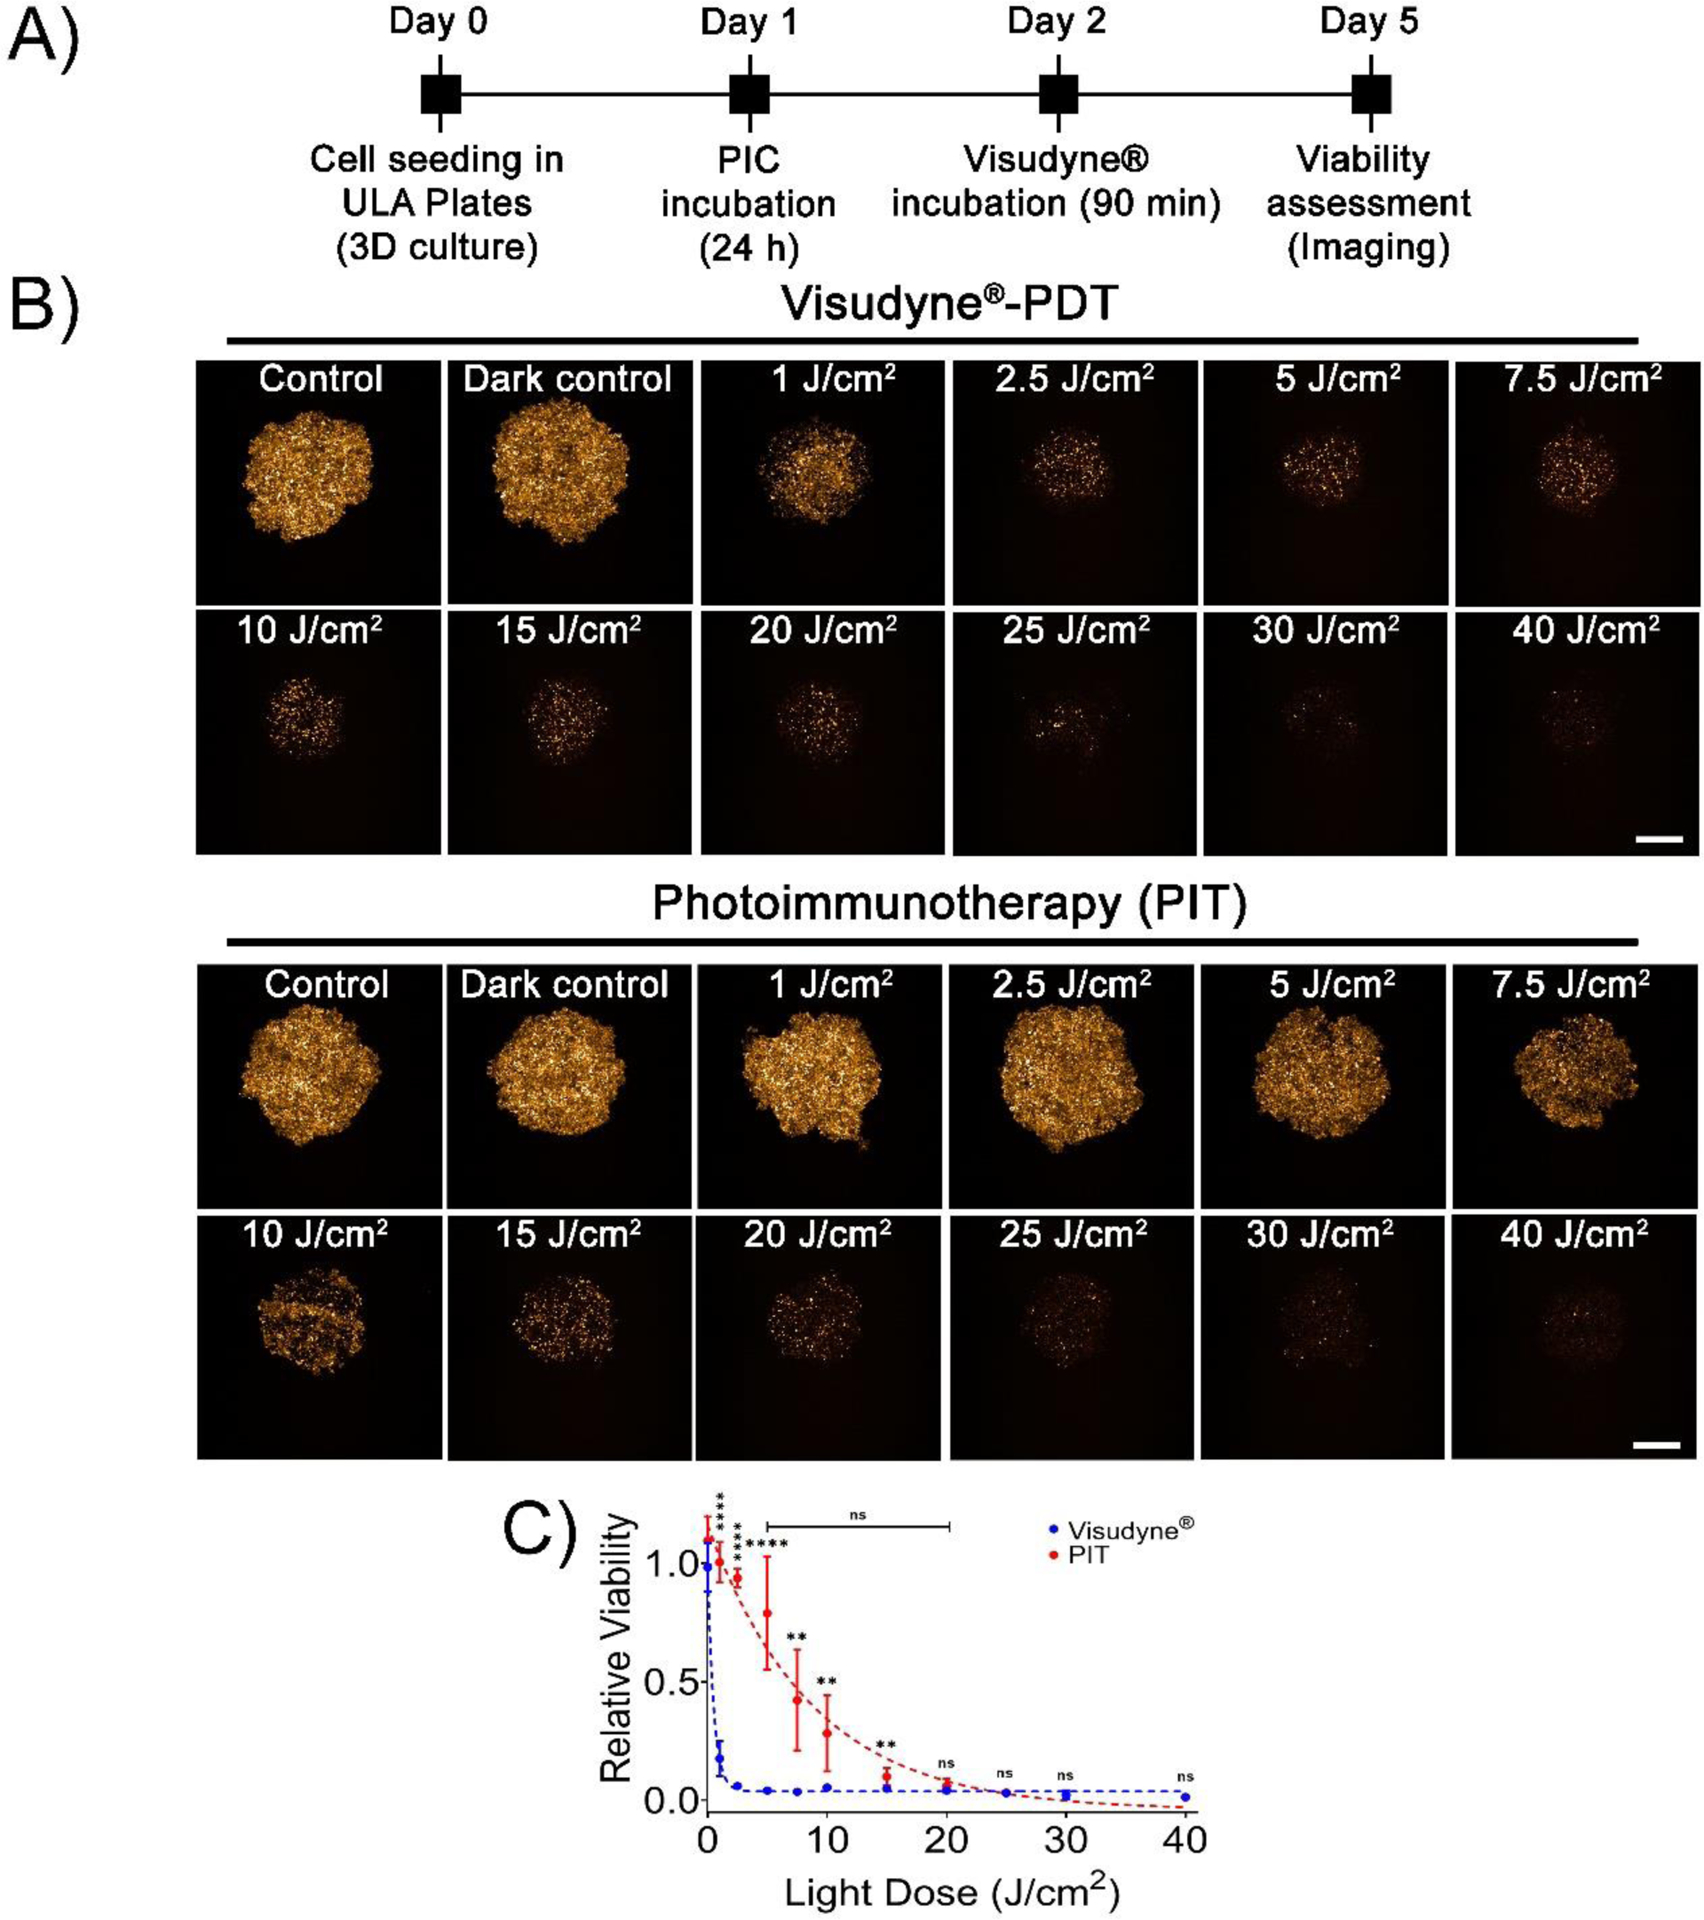
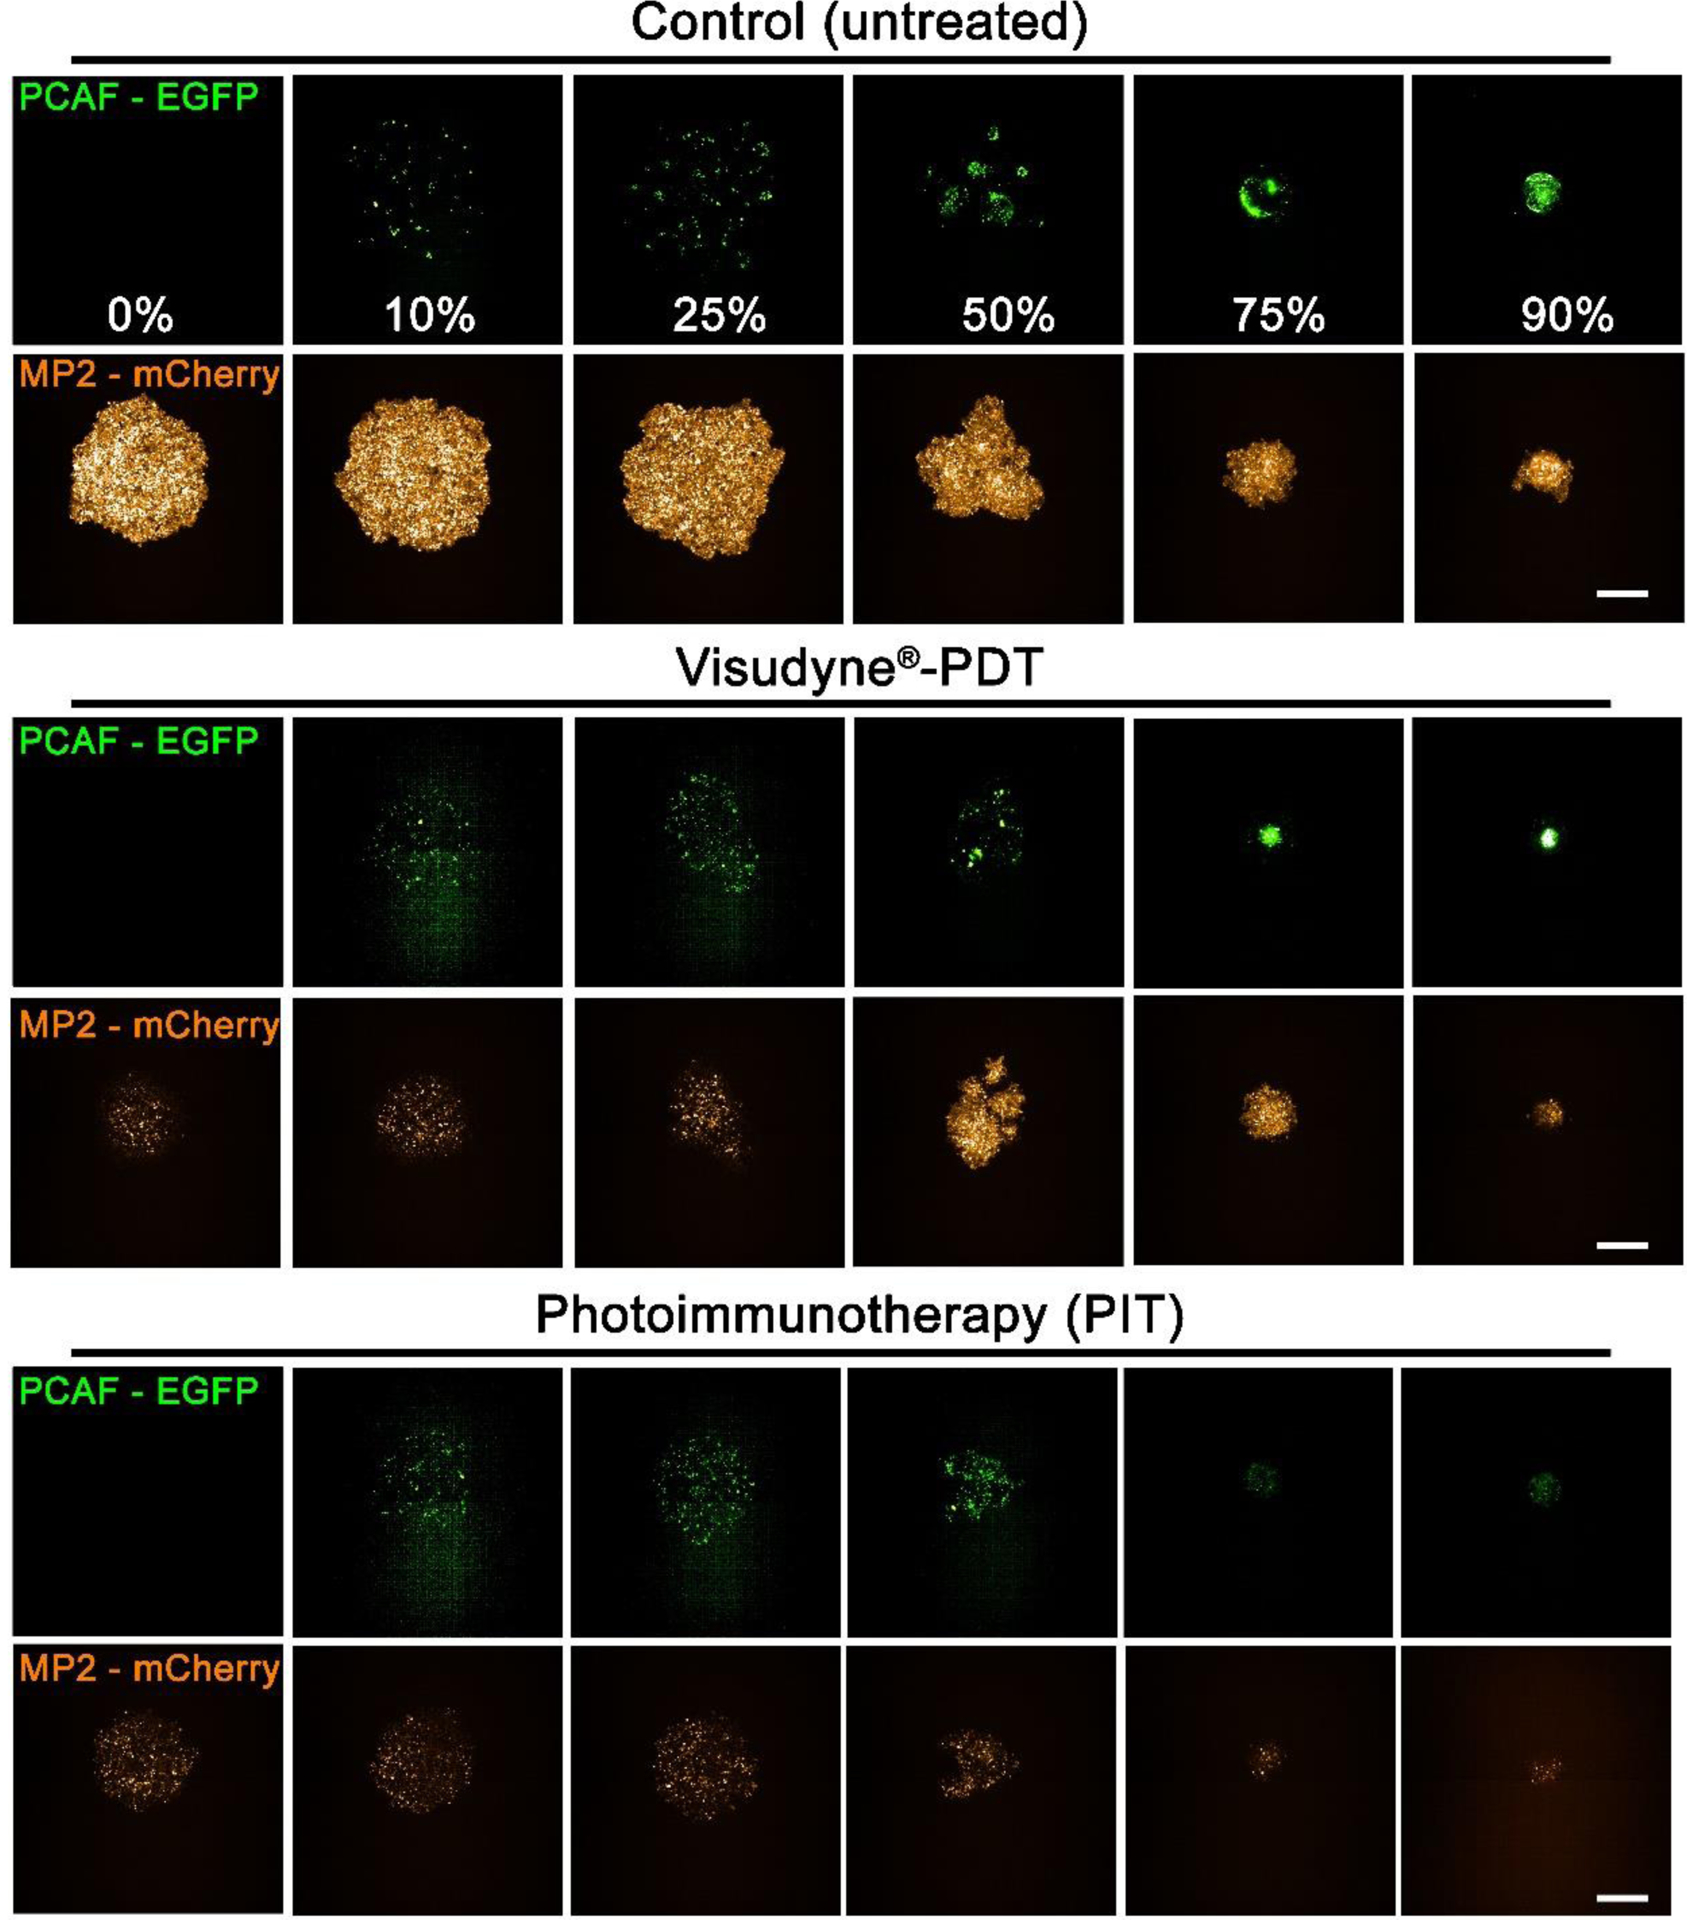
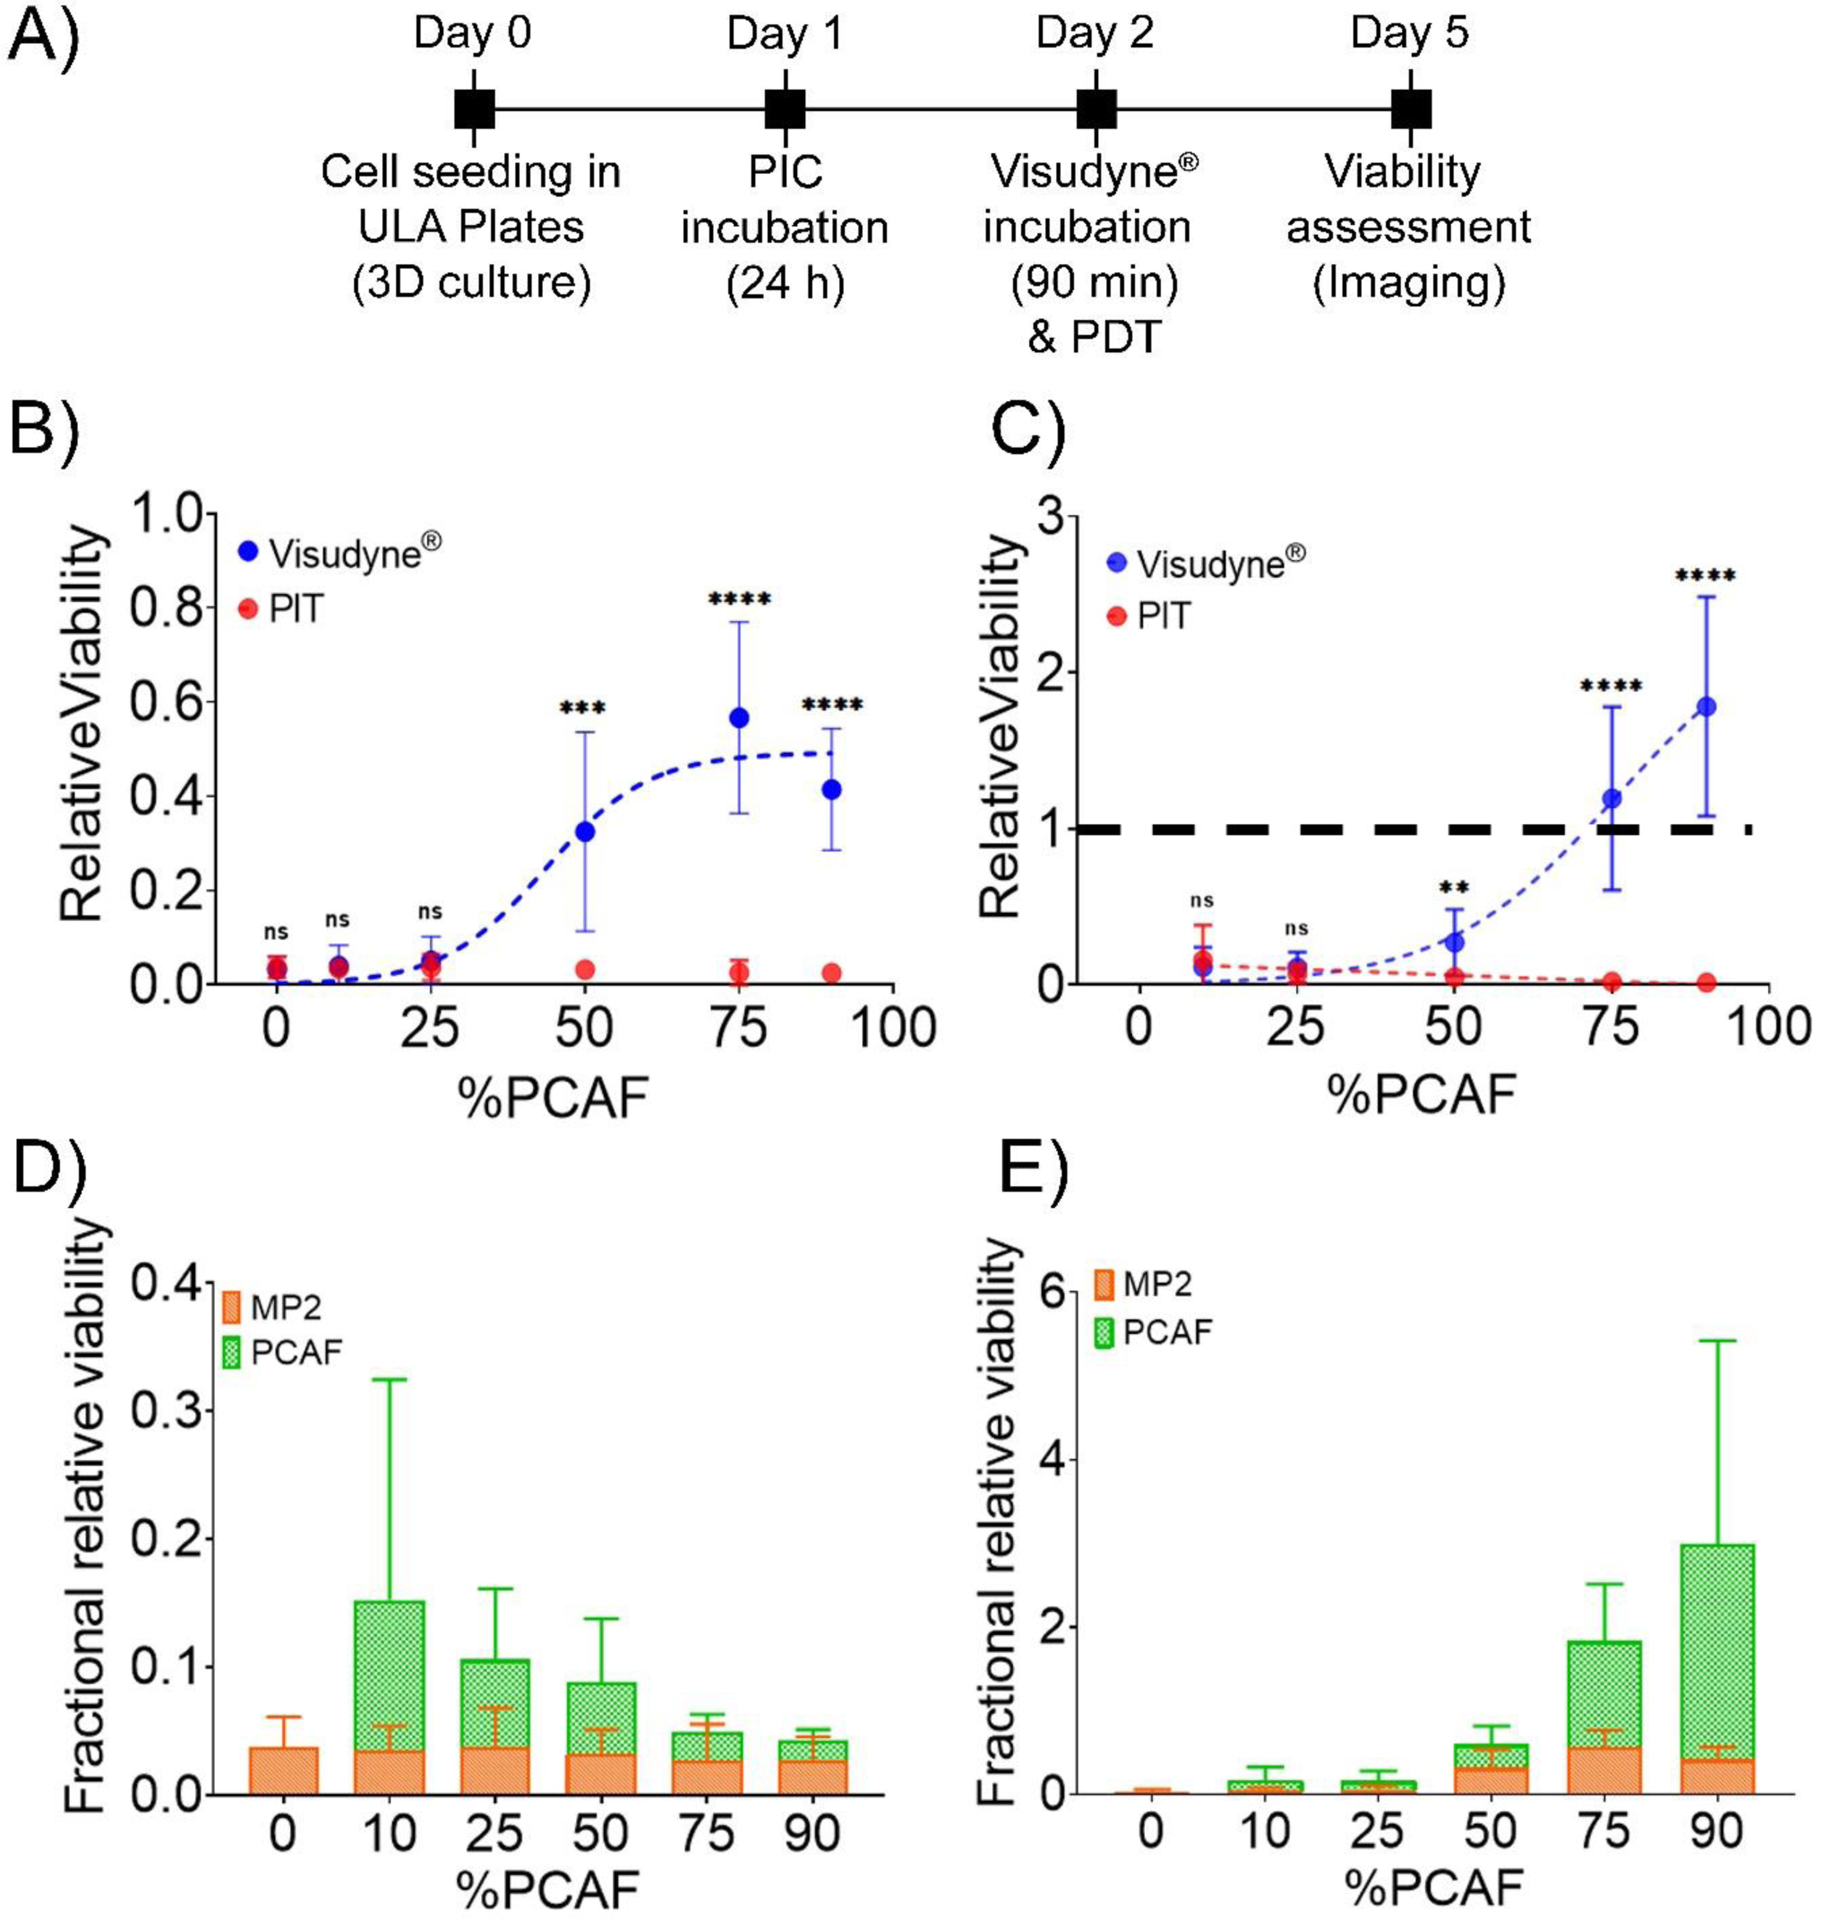
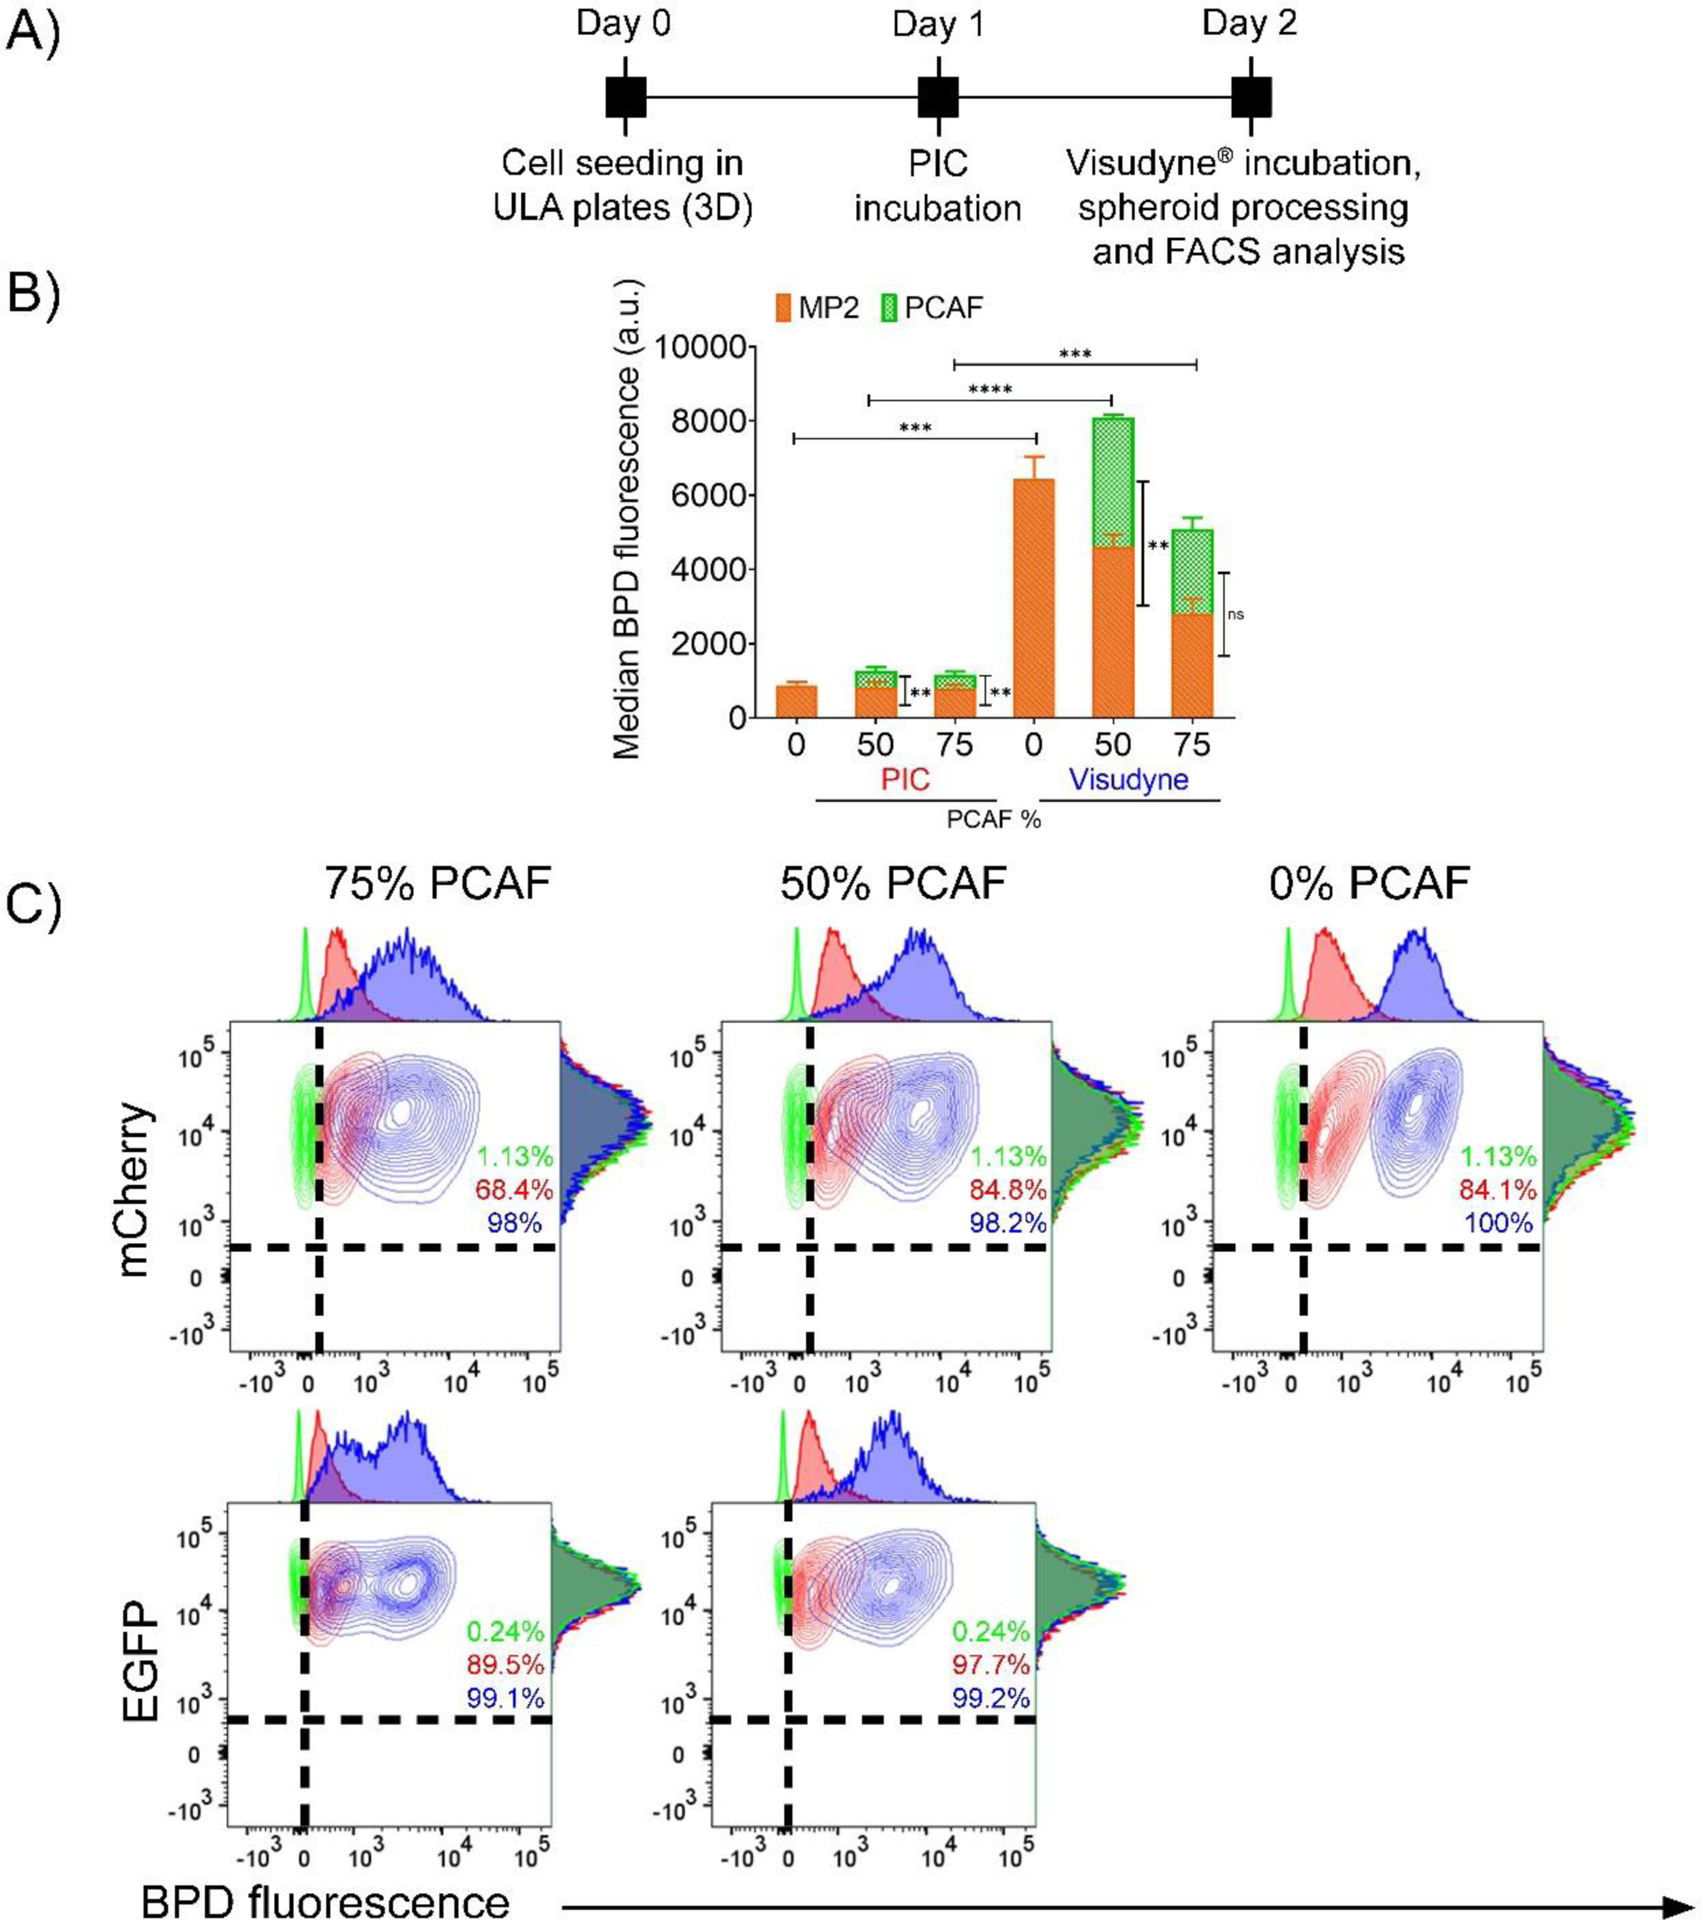
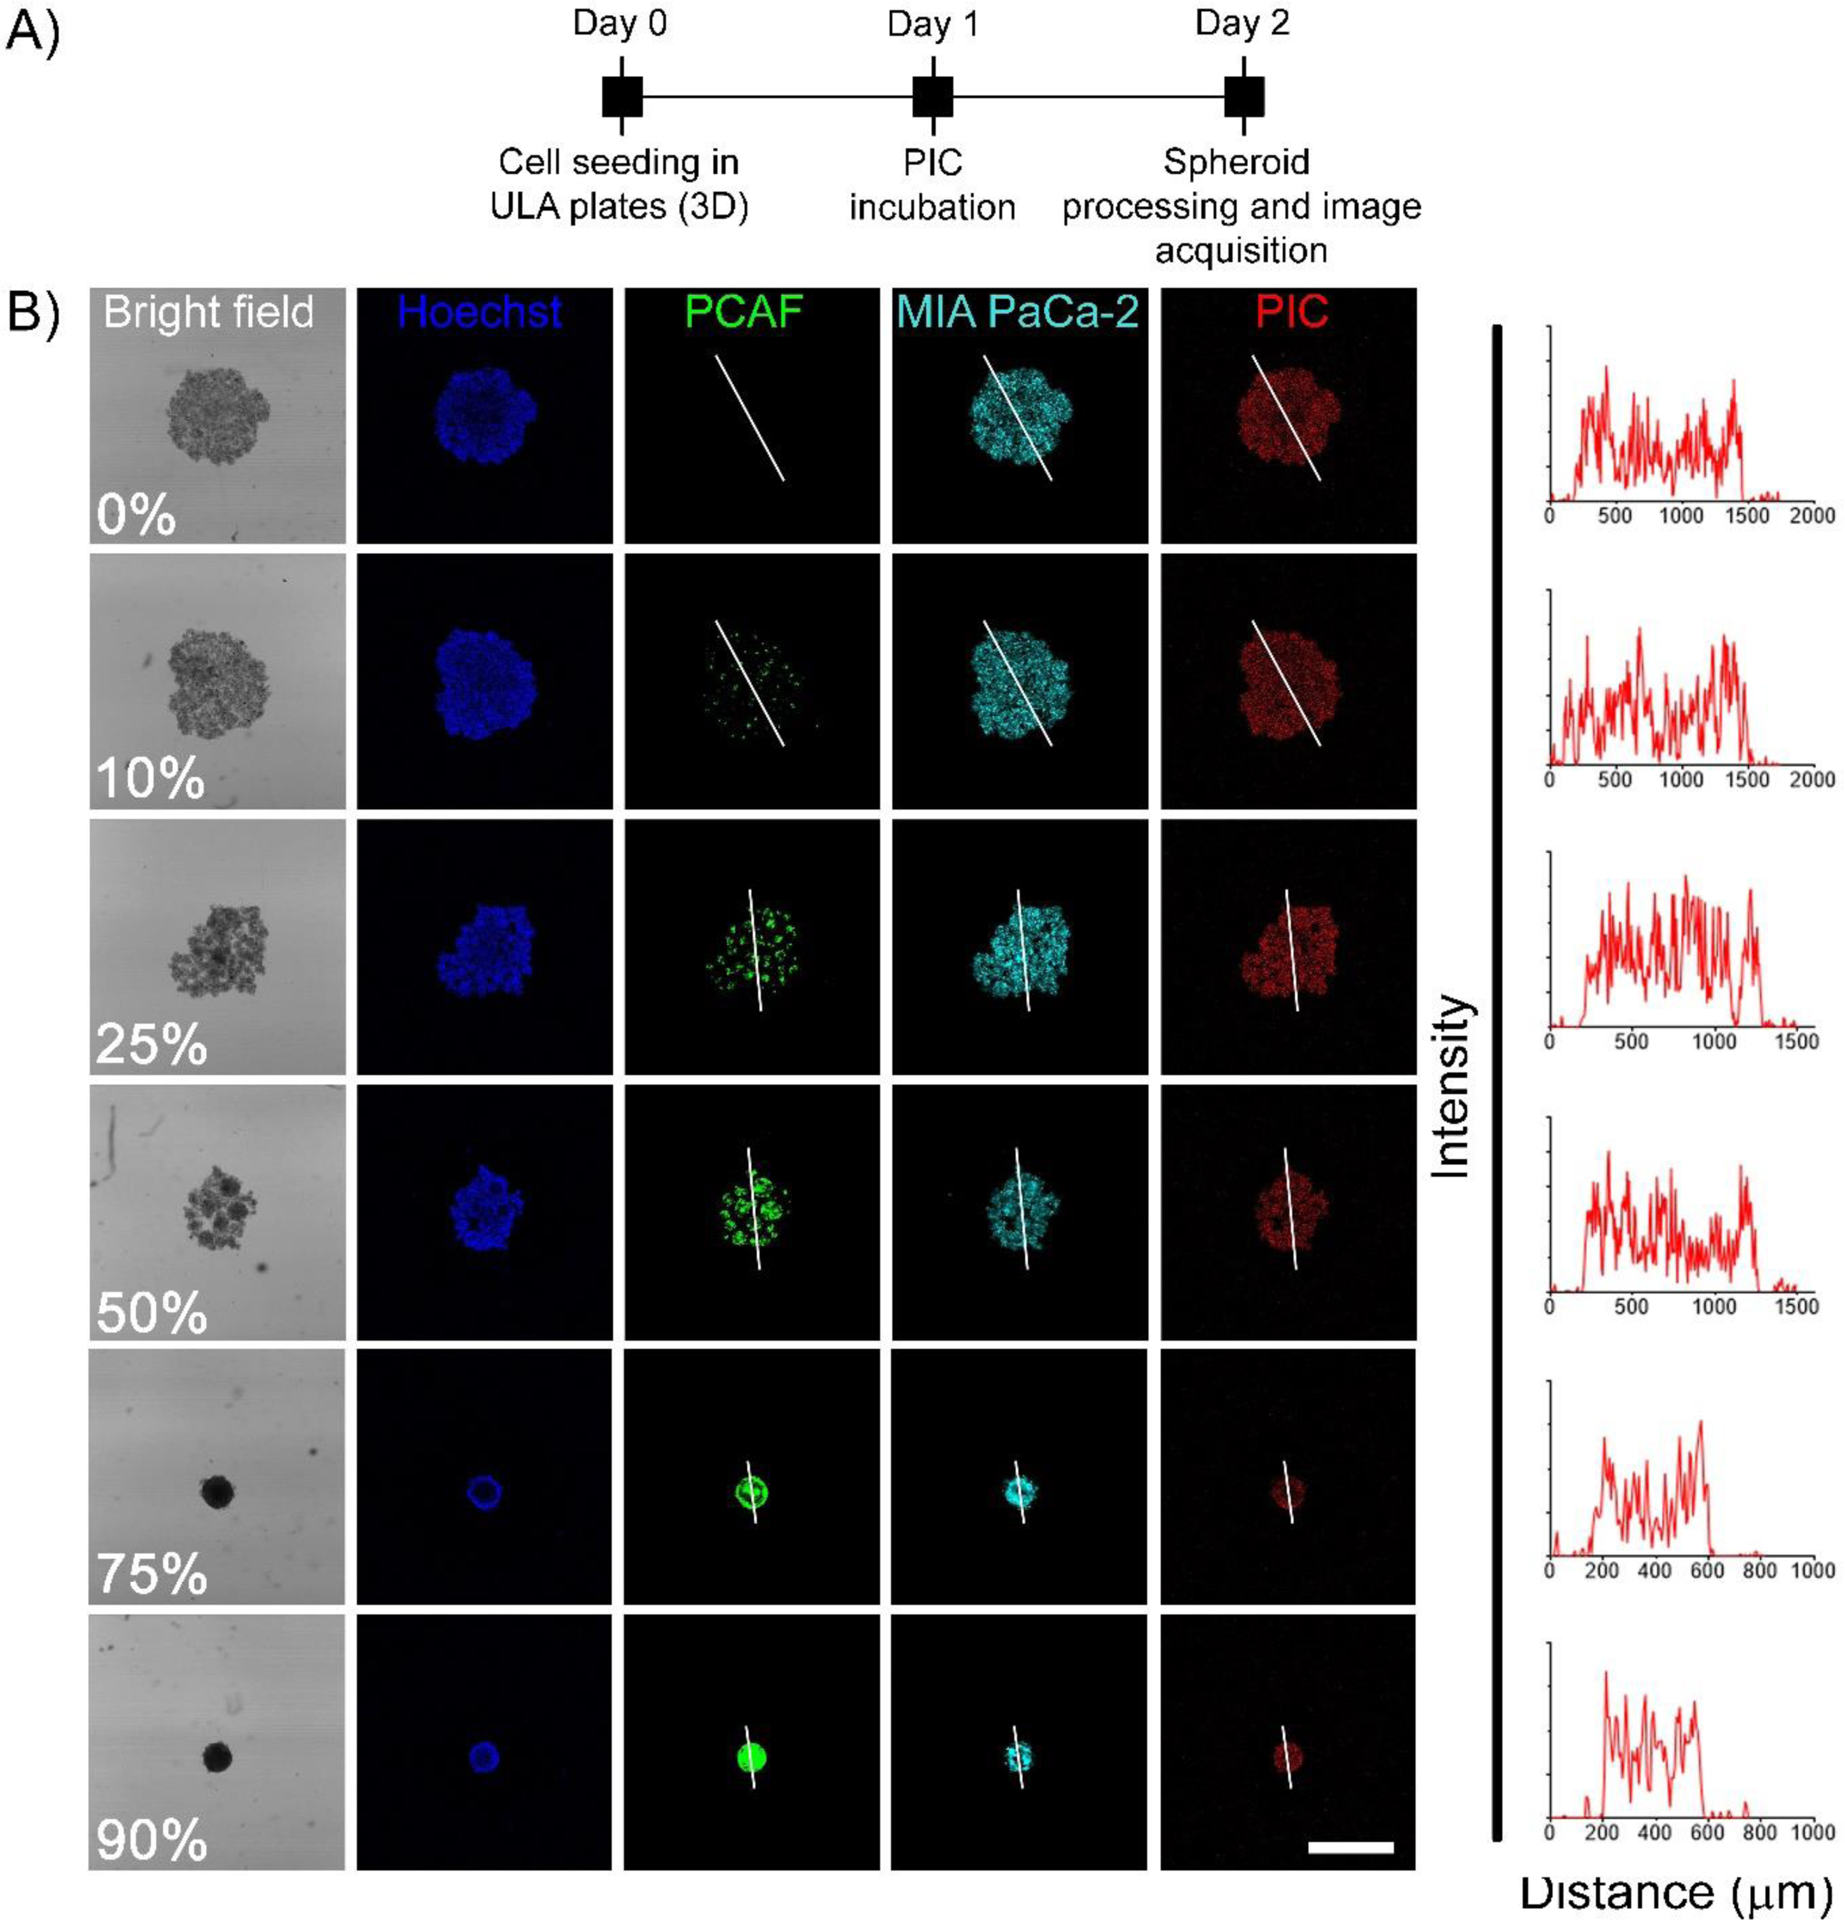
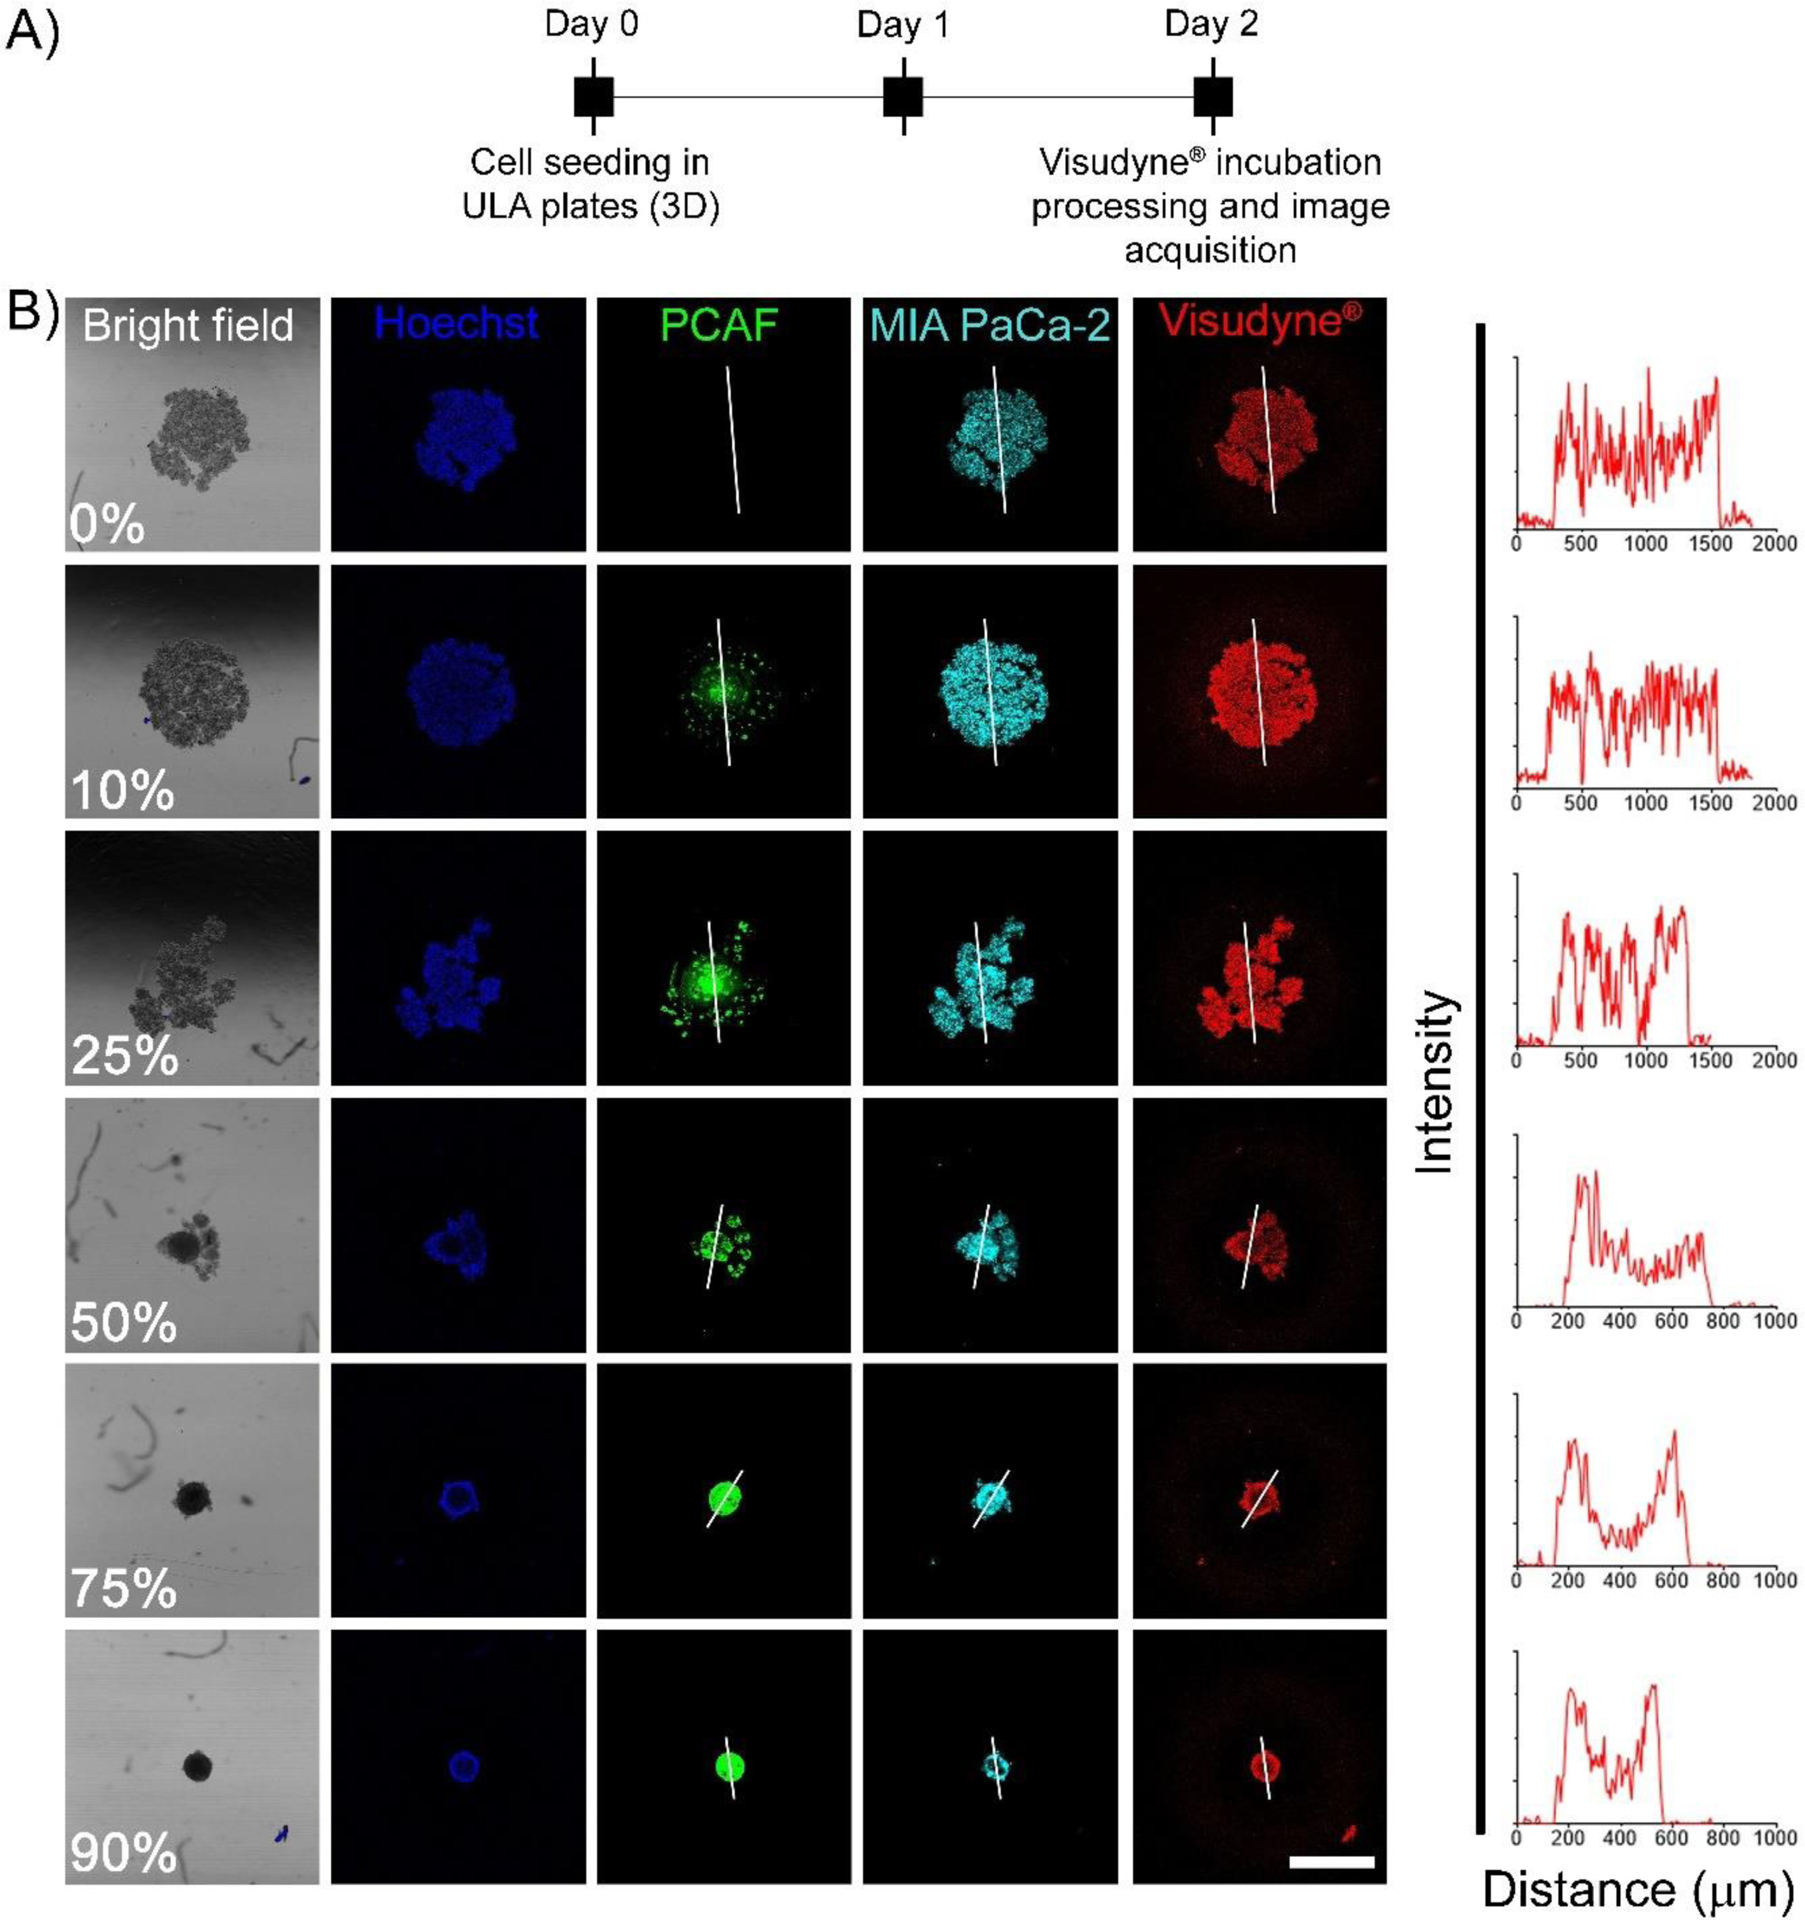
Pancreatic ductal adenocarcinoma (PDAC) is an aggressive disease characterized by increased levels of desmoplasia that contribute to reduced drug delivery and poor treatment outcomes. In PDAC, the stromal content can account for up to 90% of the total tumor volume. The complex interplay between stromal components, including pancreatic cancer-associated fibroblasts (PCAFs), and PDAC cells in the tumor microenvironment has a significant impact on the prognoses and thus needs to be recapitulated in vitro when evaluating various treatment strategies. This study is a systematic evaluation of photodynamic therapy (PDT) in 3D heterotypic coculture models of PDAC with varying ratios of patient-derived PCAFs that simulate heterogeneous PDAC tumors with increasing stromal content. The efficacy of antibody-targeted PDT (photoimmunotherapy; PIT) using cetuximab (a clinically approved anti-EGFR antibody) photoimmunoconjugates (PICs) of a benzoporphyrin derivative (BPD) is contrasted with that of liposomal BPD (Visudyne), which is currently in clinical trials for PDT of PDAC. We demonstrate that both Visudyne-PDT and PIT were effective in heterotypic PDAC 3D spheroids with a low stromal content. However, as the stromal content increases above 50% in the 3D spheroids, the efficacy of Visudyne-PDT is reduced by up to 10-fold, while PIT retains its efficacy. PIT was found to be 10-, 19-, and 14-fold more phototoxic in spheroids with 50, 75, and 90% PCAFs, respectively, as compared to Visudyne-PDT. This marked difference in efficacy is attributed to the ability of PICs to penetrate and distribute homogeneously within spheroids with a higher stromal content and the mechanistically different modes of action of the two formulations. This study thus demonstrates how the stromal content in PDAC spheroids directly impacts their responsiveness to PDT and proposes PIT to be a highly suited treatment option for desmoplastic tumors with particularly high degrees of stromal content.

Keywords: Visudyne; benzoporphyrin derivative; cancer-associated fibroblasts; desmoplasia; epidermal growth factor receptor (EGFR); pancreatic ductal adenocarcinoma (PDAC); photodynamic therapy; photoimmunoconjugates; tumor microenvironment.


Conflict of interest statement

Conflict of Interest Statement:

The authors declare no competing financial interest.

Figures

Figure 1:
Figure 1:
Representative images of 2D cultures of wild type (A) MIA PaCa-2 cells and Mia PaCa-2 cells expressing mCherry, (B) wild type PCAFs and PCAFs expressing EGFP. (scale bar = 200 μm).
Figure 2:
Figure 2:. Characterization of 3D in vitro heterotypic cultures generated with different ratios of Mia PaCa-2 and PCAFs.
(A) Maximum intensity projection (MIP) of fluorescence images of spheroids developed with increasing PCAF percentage. (left to right). Mia PaCa-2 are pseudo-colored as orange and PCAFs are pseudo-colored as green. Scale bar corresponds to 500 μm. (B) Relative cellular ratio of Mia PaCa-2 and PCAFs in the different spheroids (left to right, 0%, 10%, 25%, 50%, 75% and 90% PCAFs) as cultured for 5 days. The Mia PaCa-2 cells rapidly out-numbered the PCAFs during culture. The cellular ratios were calculated based on the 2D fluorescent MIP images for these spheroids using image J. Mia PaCa-2 are represented as orange bars and PCAFs are represented as green bars. (C) Diameter of the tumor spheroids formed with different PCAF percentage on day 2 of culture. (D) Pie charts providing a comparison of relative cellular ratio and spheroid size on day 2 post-cell seeding. Size of the pie charts represent the size of spheroids, while the orange and green colors represent the fraction of Mia PaCa-2 and PCAFs, respectively.
Figure 3:
Figure 3:. Dose-dependent response of Mia PaCa-2 homotypic 3D cultures to Visudyne®-PDT and PIT.
(A) Experimental schedule for Visudyne® and PIC-PDT. Cells were seeded in CellCarrier Spheroid ULA 96-well Microplates followed by incubation with either PICs or Visudyne® for 24 h and 90 min, respectively. The spheroids were then irradiated with different light doses and imaged for 3 days post-PDT. (B) Maximum intensity projection (MIP) of fluorescence images of MP2 spheroids on day 3 post-PDT. Scale bar corresponds to 500 μm. (C) Quantitative analysis of mCherry fluorescence from spheroids treated with PDT. PIT resulted in a gradual decrease in viability, while Visudyne®-PDT resulted in a sudden drop in viability with increasing light dose. Data points were fit in a non-linear exponential decay equation (R2 = 0.98 and 0.91 for Visudyne®-PDT and PIT, respectively). (Data points for Visudyne®-PDT and PIT are represented in blue and red dots, while the non-linear fits are represented as dotted lines of the same color). Data are presented as mean ± S.D (n ≥8), analyzed using Welch’s t-test analysis. P-values < 0.05 were considered to be significant and are indicated by asterisks as follows: nsP>0.05, *P<0.05, **P<0.01, ***P<0.001 and ****P<0.0001.
Figure 4:
Figure 4:. Response of heterotypic Mia PaCa-2-PCAF 3D cultures to Visudyne®-PDT and PIT.
Maximum intensity projection (MIP) of fluorescence signals from Mia PaCa-2-PCAF spheroids with different PCAF percentage on day 3 post-PDT. PCAF percentage is mentioned in the top panel (control spheroids PCAF-EGFP panel). Scale bar corresponds to 500 μm.
Figure 5:
Figure 5:. Quantitation of cell viability in heterotypic Mia PaCa-2-PCAF 3D cultures in response to Visudyne®-PDT and PIT.
(A) Experimental schedule for Visudyne®-PDT and PIT of heterotypic Mia PaCa-2-PCAF spheroids. Cells were seeded in CellCarrier Spheroid ULA 96-well Microplates followed by incubation with either Visudyne® or PIC for 90 min and 24 h, respectively. The spheroids were then irradiated with a light dose of 5 J/cm2 (for Visudyne® treated spheroids) and 20 J/cm2 (for PIC treated spheroids) followed by imaging for 3 days. Relative viability of individual Mia PaCa-2 (B) and PCAF (C) populations in spheroids (formed with different PCAF percentage) treated with either PIT (red circles) or Visudyne®-PDT (blue circles). Both Visudyne®-PDT and PIT reduced the relatively viability of Mia PaCa-2 and PCAFs significantly in spheroids with low PCAF percentage (0%, 10% and 25%). However, increasing the PCAF percentage further resulted in a decrease in efficiency of Visudyne®-PDT, while PIT was relatively unaffected. Relative viabilities were calculated by dividing fluorescence intensity of Mia PaCa-2-mCherry and PCAF-EGFP from the treated spheroids by the intensity of the respective Mia PaCa-2-mCherry and PCAF-EGFP from the untreated control spheroids, on the same day. Data are presented as mean ± S.D (n ≥3), analyzed using Welch’s t-test analysis. P-values < 0.05 were considered to be significant and are indicated by asterisks as follows: nsP>0.05, *P<0.05, **P<0.01, ***P<0.001 and ****P<0.0001. (C) Fractional relative viability of Mia PaCa-2 and PCAFs in spheroids treated with PIT (D) and Visudyne®-PDT (E) calculated as described in the methods. PIT was relatively more phototoxic (although not statistically significant) to Mia PaCa-2 cells in spheroids formed with low PCAF percentage (10%, 25% and 50%). However, increasing the PCAF percentage resulted in a decrease in selectivity and in spheroids with 75% and 90% PCAFs, the fractional relative viability of Mia Paca-2 and PCAFs were similar. On the other hand, spheroids treated with Visudyne®-PDT showed an increase in fractional relative viability of PCAFs in spheroids with 75% and 90% PCAFs. Mia PaCa-2 are represented as orange bars and PCAFs are represented as green bars. Data are presented as mean ± S.D (n ≥3).
Figure 6:
Figure 6:. Photosensitizer distribution in heterotypic 3D spheroids.
(A) Experimental timeline for studying BPD uptake in homotypic and heterotypic spheroids using Visudyne® and PIC. Cells were seeded in CellCarrier Spheroid ULA 96-well Microplates followed by incubation with either PICs or Visudyne® for 24 h and 90 min, respectively. The spheroids were then washed, trypsinized and analyzed through flow cytometry. (B) Median BPD fluorescence of spheroids treated with PICs and Visudyne®. Green bars represent PCAFs while orange bars represent MP2 cells. BPD distribution in Mia PaCa-2 and PCAFs were unaffected by PCAF percentage in the spheroids and remained same. However, BPD uptake in Mia-PaCa-2 cells when delivered through Visudyne® was significantly reduced with increasing PCAF percentage. The corresponding BPD uptake in PCAFs of these spheroids did not change significantly with increasing PCAF percentage. Mia PaCa-2 are represented as orange bars and PCAFs are represented as green bars. Data are presented as mean ± S.D (n ≥3), analyzed using Welch’s t-test analysis. P-values < 0.05 were considered to be significant and are indicated by asterisks as follows: nsP>0.05, *P<0.05, **P<0.01, ***P<0.001 and ****P<0.0001. (C) Contour plots for analyzing BPD distribution heterogeneity in homotypic and heterotypic spheroids. Mia PaCa-2 cells (upper panel) and PCAFs (lower panel) in spheroids with 75% and 50% PCAFs showed broader contour plots for Visudyne® (blue), while the contour plots for PIC (red) were narrow, suggesting a homogeneous distribution of BPD after PIC treatment.
Figure 7:
Figure 7:. PIC administered photosensitizer distribution in heterotypic 3D spheroids.
(A) Experimental timeline for studying BPD uptake and distribution in homotypic and heterotypic spheroids using PICs. Cells were seeded in CellCarrier Spheroid ULA 96-well Microplates followed by incubation with PICs for 24 h. The spheroids were then washed, fixed in PFA, counter-stained with Hoechst and visualized under a confocal fluorescence microscope. (B) Representative confocal images of the central optical section of the 3D spheroids. Mia PaCa-2 cells and PCAFs are pseudo-colored as cyan and green. Nuclei are stained with Hoechst (pseudocolored as blue) and BPD is shown in red. Profile plots were generated using image J to monitor BPD distribution across the central plane. As suggested by the profile-plots, the distribution of BPD was homogeneous across the central section irrespective of the spheroid composition (scale bar = 500 μm).
Figure 8:
Figure 8:. Visudyne® administered photosensitizer distribution in heterotypic 3D spheroids.
(A) Experimental schedule for studying BPD uptake and distribution in homotypic and heterotypic spheroids using PICs. Cells were seeded in CellCarrier Spheroid ULA 96-well Microplates followed by incubation with Visudyne® for 90 min. The spheroids were then washed, fixed in PFA, counterstained with Hoechst and visualized under a confocal fluorescence microscope. (B) Representative confocal images of the central optical section of the 3D spheroids. Mia PaCa-2 cells and PCAFs are pseudo-colored as cyan and green. Nuclei are stained with Hoechst (pseudo-colored as blue) and BPD is shown in red. Profile plots were generated using Image J to monitor BPD distribution across the central plane. As suggested by the profile-plots, the distribution of BPD was homogeneous for spheroids generated with 0%, 10% and 25% PCAFs. However, as the PCAF percentage increased beyond 50% the distribution of BPD appeared to be heterogeneous with higher signal on the periphery and lower signal in the spheroid core (scale bar = 500 μm).

References

    1. Siegel RL; Miller KD; Jemal A, Cancer statistics, 2020. CA 2020, 70 (1), 7–30. - PubMed
    1. Rahib L; Smith BD; Aizenberg R; Rosenzweig AB; Fleshman JM; Matrisian LM, Projecting Cancer Incidence and Deaths to 2030: The Unexpected Burden of Thyroid, Liver, and Pancreas Cancers in the United States. Cancer Res 2014, 74 (11), 2913–2921. - PubMed
    1. Liang C; Shi S; Meng Q; Liang D; Ji S; Zhang B; Qin Y; Xu J; Ni Q; Yu X, Complex roles of the stroma in the intrinsic resistance to gemcitabine in pancreatic cancer: where we are and where we are going. Experimental & Molecular Medicine 2017, 49 (12), e406–e406. - PMC - PubMed
    1. Capurso G; Sette C, Drug resistance in pancreatic cancer: new player caught in act. EBioMedicine 2019, 40, 39–40. - PMC - PubMed
    1. Grasso C; Jansen G; Giovannetti E, Drug resistance in pancreatic cancer: Impact of altered energy metabolism. Critical Reviews in Oncology/Hematology 2017, 114, 139–152. - PubMed

Publication types