

Contrast-to-Noise Ratios to Evaluate the Detection of Glaucomatous Progression in the Superior and Inferior Hemiretina
- PMID: 35583886
- PMCID: PMC9123513
- DOI: 10.1167/tvst.11.5.20
Contrast-to-Noise Ratios to Evaluate the Detection of Glaucomatous Progression in the Superior and Inferior Hemiretina
Abstract
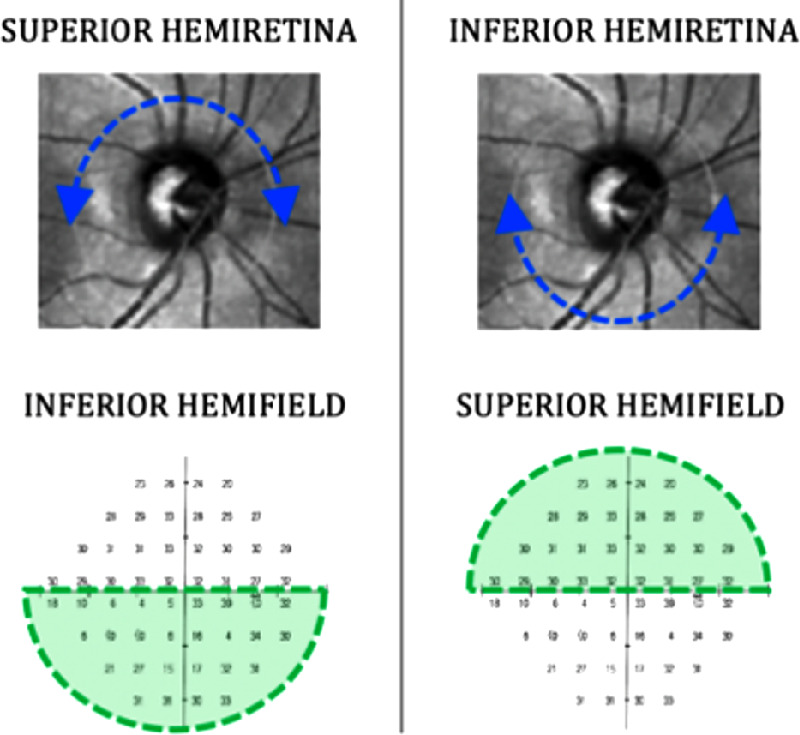
Purpose: To determine the sensitivity of optical coherence tomography (OCT) and standard automated perimetry (SAP) for detecting glaucomatous progression in the superior and inferior hemiretina.
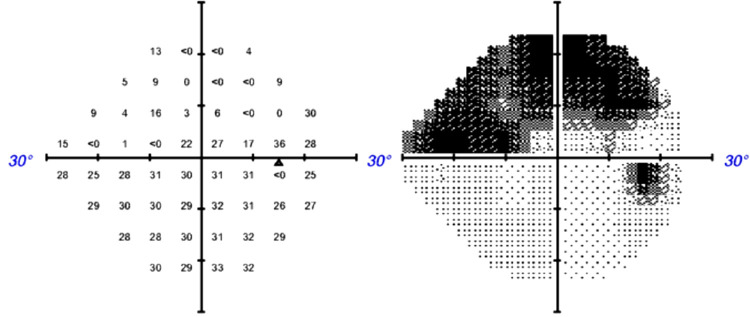
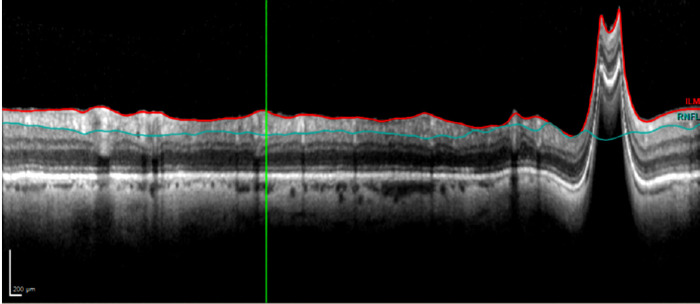
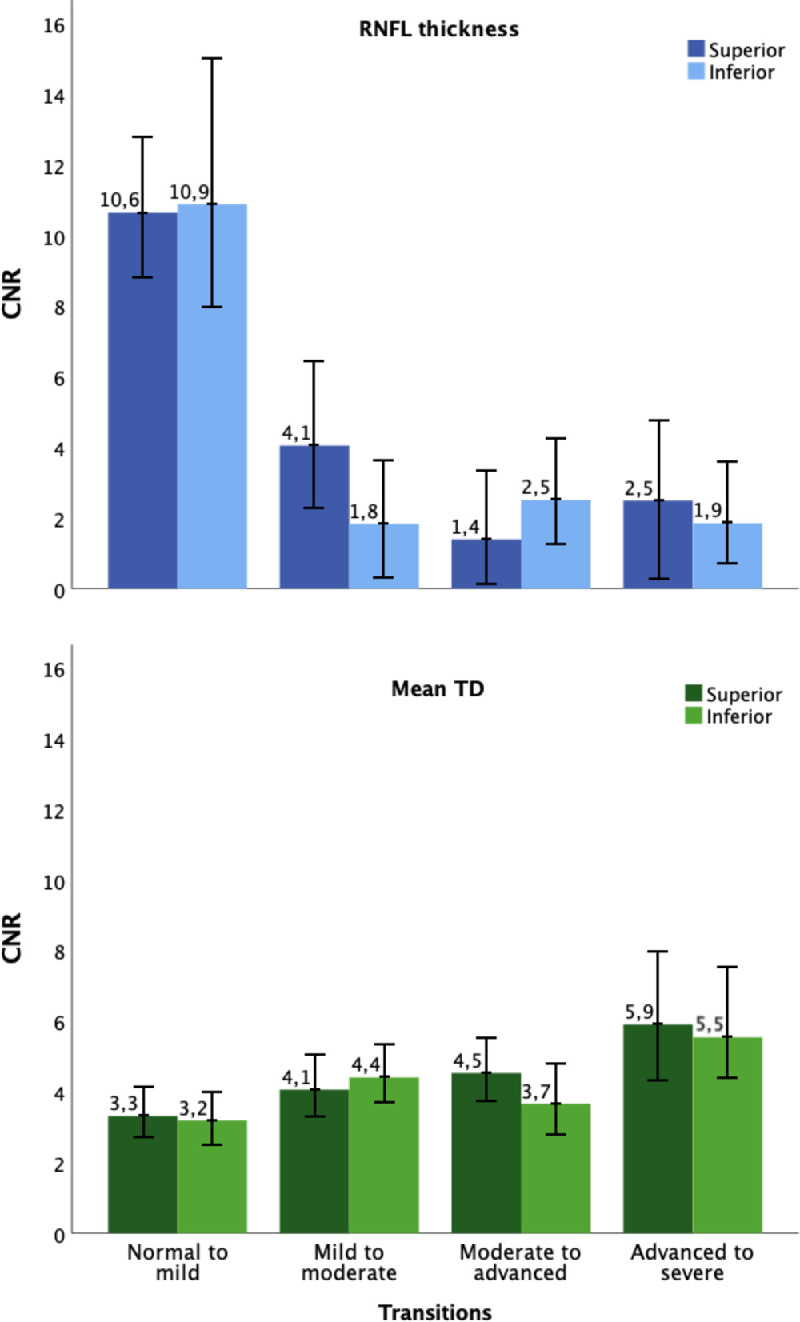
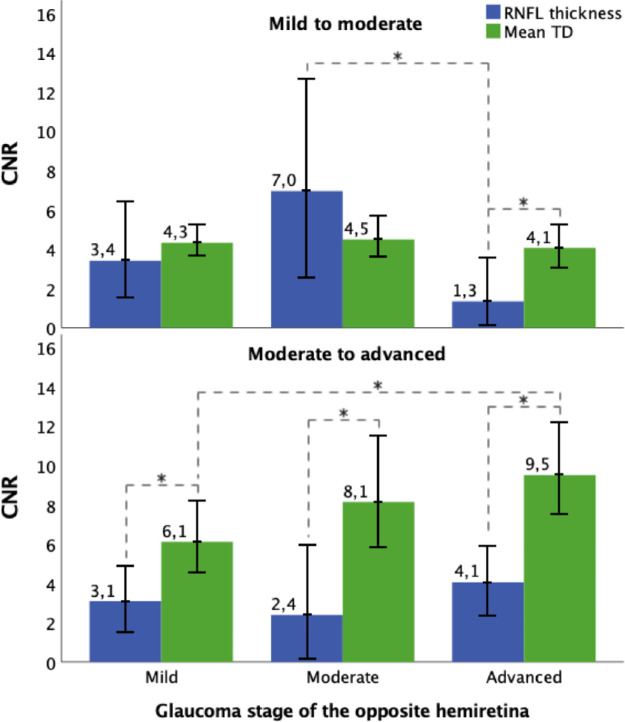
Methods: We calculated contrast-to-noise ratios (CNRs) for OCT retinal nerve fiber layer (RNFL) thickness of hemiretinas and for SAP mean total deviation (MTD) of the corresponding hemifields from longitudinal data (205 eyes, 125 participants). The glaucoma stage for each hemiretina was based on the corresponding hemifield's MTD. Contrast was defined as the difference of the parameter between two consecutive glaucoma stages, whereas noise was the measurement variability of the parameter in those stages. The higher the CNR of a parameter, the more sensitive it is to detecting progression in the transition between successive stages.
Results: There were no statistically significant differences for the RNFL CNR and MTD CNR between superior and inferior hemiretinas. As the glaucoma stage of the opposite hemiretina worsened, the MTD CNR in the transition from moderate to advanced glaucoma significantly increased. The RNFL CNR in the transition from mild to moderate glaucoma significantly decreased in case of advanced glaucoma in the opposite hemiretina.
Conclusions: Similar to full retinas, detecting conversion to glaucoma in hemiretinas is more sensitive with OCT than SAP, whereas with more advanced disease, SAP is more sensitive for detecting progression. More importantly, the sensitivity for detecting progression in one hemiretina with either technique depends on the glaucoma severity in the opposite hemiretina.
Translational relevance: Monitoring glaucomatous progression with either OCT or SAP partly depends on the glaucoma severity in the opposite hemiretina.
Conflict of interest statement
Disclosure:
Figures
Similar articles
-
Contrast-to-Noise Ratios for Assessing the Detection of Progression in the Various Stages of Glaucoma.Transl Vis Sci Technol. 2019 May 2;8(3):8. doi: 10.1167/tvst.8.3.8. eCollection 2019 May. Transl Vis Sci Technol. 2019. PMID: 31114714 Free PMC article.
-
Detecting the progression of normal tension glaucoma: a comparison of perimetry, optic coherence tomography, and Heidelberg retinal tomography.Korean J Ophthalmol. 2015 Feb;29(1):31-9. doi: 10.3341/kjo.2015.29.1.31. Epub 2015 Jan 22. Korean J Ophthalmol. 2015. PMID: 25646058 Free PMC article.
-
Nerve fiber layer thickness in glaucoma patients with asymmetric hemifield visual field loss.J Glaucoma. 2006 Aug;15(4):275-80. doi: 10.1097/01.ijg.0000212298.23787.bf. J Glaucoma. 2006. PMID: 16865002
-
Retinal Nerve Fiber Layer Damage in Young Myopic Eyes With Optic Disc Torsion and Glaucomatous Hemifield Defect.J Glaucoma. 2017 Jan;26(1):77-86. doi: 10.1097/IJG.0000000000000466. J Glaucoma. 2017. PMID: 27300647
-
Comparison of diagnostic ability of standard automated perimetry, short wavelength automated perimetry, retinal nerve fiber layer thickness analysis and ganglion cell layer thickness analysis in early detection of glaucoma.Indian J Ophthalmol. 2021 May;69(5):1108-1112. doi: 10.4103/ijo.IJO_2409_20. Indian J Ophthalmol. 2021. PMID: 33913843 Free PMC article.
References
-
- Mariotti SP. Global data on visual impairments: 2010. Br J Ophthalmol . 2012; 96: 614–618. - PubMed
-
- Quigley HA, Addicks EM, Green WR.. Optic nerve damage in human glaucoma. III. Quantitative correlation of nerve fiber loss and visual field defect in glaucoma, ischemic neuropathy, papilledema, and toxic neuropathy. Arch Ophthalmol . 1982; 100: 135–146. - PubMed
-
- Mwanza JC, Budenz DL.. Optical coherence tomography platforms and parameters for glaucoma diagnosis and progression. Curr Opin Ophthalmol . 2016; 27: 102–110. - PubMed
Publication types
MeSH terms
LinkOut - more resources
Full Text Sources
Medical
Research Materials
Miscellaneous
